SlideShare a Scribd company logo
1 of 2
Download to read offline
2011 COMPENSATION SURVEY RESULTS
                                                                                                                                     Respondents
Survey Observations                                                                                 Males 548
                                                                                                    64.2%
                                                                                                                    Females 306
                                                                                                                    35.8%             854
ExhibitRecruiter and their official marketing partner, Exhibitor Media Group have teamed up to produce the
Sixth Annual Compensation Survey.

Over 850 people participated in the 2011 Survey. Our thanks go out to you for making the survey successful. Two of
the fastest growing areas in our industry were added to this year's survey. The survey has grown to include
professionals in the Event Marketing and Branded Environments fields. Responses were gathered under General
Results starting this year.


                                                                                                                           Other
                                                                                                                     (UK, EURO, India)
                                                                                                                           5.4%


                  West           North           South        North          South
    West         Central        Central         Central        East         Atlantic      Canada
  $104,650       $74,300        $91,450         $87,200      $97,550        $93,200       $98,300


   14.2%          3.1%           30.5%          9.6%          19.5%          14.1%         3.6%

Average Salary by Region


 Number of Respondents                              Age Range                                        Salary Versus Education
 Tradeshows: 592                                    47% of our participants were between the         The average pay for those respondents in
 Event Marketing: 151                               ages of 40-55, 37% were between 25-40,           the tradeshow industry with a two year
 Branded Environments: 111                          15% were over 55 with only a small minority,     degree or less was $82,850, those with a
                                                    1% below 25.                                     four year degree or higher earned an
                                                                                                     average of $99,900.

                                                                                              70% of all respondents hold
                                                                                              a four year degree or higher.


 Salary Versus Years in the Industry               Years with Current Employer                        Benefits
 Respondents who have been in the                  60% of respondents have been with their           Medical and Dental insurance as well as
 tradeshow industry for 6 years or less are        present employer 6 years or less, 30% have        401Ks were the top benefits as reported by
 making an average of $82,100, 7-15 years          been with them for 7-15 years, while only         our respondents, Vision, Life insurance and
 $85,000 and over 15 years are making              10% have been with their employer for 16          Prescription Coverage were the second, with
 $112,900 on average.                              years or more.                                    Maternity Leave, the lowest being offered to
                                                                                                     35% of respondents. 10% of respondents
                                                                                                     indicated that they received no listed benefits
      Of those that responded, 95% are currently employed. Of the 5% indicating                      from their employers.
      they were unemployed 40% said they had been out of work for over a year.


Perks                                               Paid Vacation & Paid Sick Leave                  Software Usage & Familiarity
 Travel and performance bonuses were the           65% of respondents indicated they received        Microsoft Office Suite had the most actual
 two biggest perks reported by our                 between 10-15 paid vacation days with only        usage among respondents at 60% while the
 respondents while comp time, profit sharing       8% indicating they had none. 60% said they        Adobe Creative Suite was second with 15%,
 and continuing education ranked second,           were offered between 5-10 paid sick days          some others of varying use were AutoCAD at
 overtime pay was the lowest ranking perk.         while 25% reported no sick days were offered      6.7%, 3D Studio Max at 5.7%, Form Z at
 20% reported they did not receive any listed      to them.                                          3.1%, while things like Solid Works had less
 perks.                                                                                              than 1% usage.


                                                                                              Sponsored by
© ExhibitRecruiter 2012 All Rights Reserved
2011 COMPENSATION SURVEY RESULTS

 Annual Sales Volume of Current Employer

                             0-5              6-20             21-55             56-100          101-200          Over 200             Not Sure
                            Million          Million           Million           Million         Million           Million


                            23.3%            31.1%              13.4%             4.8%               4.8%              10.4%            12.2%
                             182              242                105               37                 37                 81               96


Number of People Employed at Current Employer

                     1-9               10-19            20-49             50-99            100-249          250-499            500-999       Over 1000
                    People            People           People            People            People           People             People         People


                    13.4%             8.7%             25.8%             16.0%             13.6%               7.7%             3.8%              11.0%
                     104               68               201               125               106                 60               30                 86


Social Networking Usage


                                  LinkedIn       Facebook         Twitter         Google +     None of These          Plaxo        Ning


                                                                                                                                                   Sponsored by


© ExhibitRecruiter 2012 All Rights Reserved

More Related Content

What's hot

2012 Salary Report
2012 Salary Report2012 Salary Report
2012 Salary Reportlelandb01
 
2009 The Edelman Trust Barometer Korea Report
2009 The Edelman Trust Barometer Korea Report2009 The Edelman Trust Barometer Korea Report
2009 The Edelman Trust Barometer Korea ReportEdelmankorea
 
Membership performance improvement seminar nyc oct 2012
Membership performance improvement seminar nyc oct 2012Membership performance improvement seminar nyc oct 2012
Membership performance improvement seminar nyc oct 2012ASI
 
Raddon Chart of the Day March 27, 2012
Raddon Chart of the Day March 27, 2012Raddon Chart of the Day March 27, 2012
Raddon Chart of the Day March 27, 2012Raddon Financial Group
 
2012 Edelman Trust Barometer: U.S. Financial Services and Banking Industries
2012 Edelman Trust Barometer: U.S. Financial Services and Banking Industries2012 Edelman Trust Barometer: U.S. Financial Services and Banking Industries
2012 Edelman Trust Barometer: U.S. Financial Services and Banking IndustriesEdelman
 
Scientific And Legal Perspectives On Science Generated For Regulatory Activities
Scientific And Legal Perspectives On Science Generated For Regulatory ActivitiesScientific And Legal Perspectives On Science Generated For Regulatory Activities
Scientific And Legal Perspectives On Science Generated For Regulatory Activitieslegaladvice
 
Survey of Career Service Professionals: Ontario
Survey of Career Service Professionals: OntarioSurvey of Career Service Professionals: Ontario
Survey of Career Service Professionals: OntarioCERIC
 

What's hot (10)

2012 Salary Report
2012 Salary Report2012 Salary Report
2012 Salary Report
 
2009 The Edelman Trust Barometer Korea Report
2009 The Edelman Trust Barometer Korea Report2009 The Edelman Trust Barometer Korea Report
2009 The Edelman Trust Barometer Korea Report
 
Membership performance improvement seminar nyc oct 2012
Membership performance improvement seminar nyc oct 2012Membership performance improvement seminar nyc oct 2012
Membership performance improvement seminar nyc oct 2012
 
Labour (Ireland) 2007 election
Labour (Ireland) 2007 electionLabour (Ireland) 2007 election
Labour (Ireland) 2007 election
 
Raddon Chart of the Day March 27, 2012
Raddon Chart of the Day March 27, 2012Raddon Chart of the Day March 27, 2012
Raddon Chart of the Day March 27, 2012
 
2012 Edelman Trust Barometer: U.S. Financial Services and Banking Industries
2012 Edelman Trust Barometer: U.S. Financial Services and Banking Industries2012 Edelman Trust Barometer: U.S. Financial Services and Banking Industries
2012 Edelman Trust Barometer: U.S. Financial Services and Banking Industries
 
Scientific And Legal Perspectives On Science Generated For Regulatory Activities
Scientific And Legal Perspectives On Science Generated For Regulatory ActivitiesScientific And Legal Perspectives On Science Generated For Regulatory Activities
Scientific And Legal Perspectives On Science Generated For Regulatory Activities
 
Executive Monitor
Executive MonitorExecutive Monitor
Executive Monitor
 
Cs3 p8 dyck listenning to the voices of rural mb
Cs3 p8 dyck listenning to the voices of rural mbCs3 p8 dyck listenning to the voices of rural mb
Cs3 p8 dyck listenning to the voices of rural mb
 
Survey of Career Service Professionals: Ontario
Survey of Career Service Professionals: OntarioSurvey of Career Service Professionals: Ontario
Survey of Career Service Professionals: Ontario
 

Similar to 2011 compensation survey averages salaries by region

2012 Connell & Partners Fall Pulse Survey Participant Report
2012 Connell & Partners Fall Pulse Survey Participant Report2012 Connell & Partners Fall Pulse Survey Participant Report
2012 Connell & Partners Fall Pulse Survey Participant ReportConnell & Partners
 
2012 eCommerce Salary Survey Results
2012 eCommerce Salary Survey Results2012 eCommerce Salary Survey Results
2012 eCommerce Salary Survey ResultsC.Y Wong
 
B2B buyers and social media
B2B buyers and social mediaB2B buyers and social media
B2B buyers and social mediaJosh Feldberg
 
2010 Salary Report
2010 Salary Report2010 Salary Report
2010 Salary Reportlelandb01
 
Panel Introduction
Panel IntroductionPanel Introduction
Panel IntroductionQingbin
 
north-east-salary-survey-2015
north-east-salary-survey-2015north-east-salary-survey-2015
north-east-salary-survey-2015Jenni Rankin
 
Health Care Workforce Trends to Fuel Your 2016 Strategic Plans
Health Care Workforce Trends to Fuel Your 2016 Strategic PlansHealth Care Workforce Trends to Fuel Your 2016 Strategic Plans
Health Care Workforce Trends to Fuel Your 2016 Strategic PlansCareerBuilder
 
2012 Membership Marketing Benchmarking Report by Tony Rossell_Marketing_Gener...
2012 Membership Marketing Benchmarking Report by Tony Rossell_Marketing_Gener...2012 Membership Marketing Benchmarking Report by Tony Rossell_Marketing_Gener...
2012 Membership Marketing Benchmarking Report by Tony Rossell_Marketing_Gener...Marketing General Incorporated (MGI)
 
2012 Membership Marketing Benchmarking Report
2012 Membership Marketing Benchmarking Report2012 Membership Marketing Benchmarking Report
2012 Membership Marketing Benchmarking ReportTony Rossell
 
The Forbes Funds Soundings Breakfast Session on the Wage and Compensation of ...
The Forbes Funds Soundings Breakfast Session on the Wage and Compensation of ...The Forbes Funds Soundings Breakfast Session on the Wage and Compensation of ...
The Forbes Funds Soundings Breakfast Session on the Wage and Compensation of ...GPNP
 
Membership performance improvement seminar nyc 2012
Membership performance improvement seminar nyc 2012Membership performance improvement seminar nyc 2012
Membership performance improvement seminar nyc 2012ASI
 
What do employees think about pay
What do employees think about payWhat do employees think about pay
What do employees think about payMark Beatson
 
2016 Laborshed Executive Summary for Greater Burlington
2016 Laborshed Executive Summary for Greater Burlington2016 Laborshed Executive Summary for Greater Burlington
2016 Laborshed Executive Summary for Greater BurlingtonGreater Burlington Partnership
 
Demand Generation Tools Webcast: Drive more leads with Alinean value-marketin...
Demand Generation Tools Webcast: Drive more leads with Alinean value-marketin...Demand Generation Tools Webcast: Drive more leads with Alinean value-marketin...
Demand Generation Tools Webcast: Drive more leads with Alinean value-marketin...Alinean, Inc.
 
Generational Retirement Trends Study - 2015
Generational Retirement Trends Study - 2015Generational Retirement Trends Study - 2015
Generational Retirement Trends Study - 2015T. Rowe Price
 
Intact Investor Presentation - March 2010
Intact Investor Presentation - March 2010Intact Investor Presentation - March 2010
Intact Investor Presentation - March 2010Intact
 
Intact Investor Presentation - June 2010
Intact Investor Presentation - June 2010Intact Investor Presentation - June 2010
Intact Investor Presentation - June 2010Intact
 
Intact Investor Presentation
Intact Investor PresentationIntact Investor Presentation
Intact Investor PresentationIntact
 

Similar to 2011 compensation survey averages salaries by region (20)

2012 Connell & Partners Fall Pulse Survey Participant Report
2012 Connell & Partners Fall Pulse Survey Participant Report2012 Connell & Partners Fall Pulse Survey Participant Report
2012 Connell & Partners Fall Pulse Survey Participant Report
 
2012 eCommerce Salary Survey Results
2012 eCommerce Salary Survey Results2012 eCommerce Salary Survey Results
2012 eCommerce Salary Survey Results
 
B2B buyers and social media
B2B buyers and social mediaB2B buyers and social media
B2B buyers and social media
 
2010 Salary Report
2010 Salary Report2010 Salary Report
2010 Salary Report
 
Panel Introduction
Panel IntroductionPanel Introduction
Panel Introduction
 
north-east-salary-survey-2015
north-east-salary-survey-2015north-east-salary-survey-2015
north-east-salary-survey-2015
 
North East Salary Survey 2015
North East Salary Survey 2015North East Salary Survey 2015
North East Salary Survey 2015
 
Health Care Workforce Trends to Fuel Your 2016 Strategic Plans
Health Care Workforce Trends to Fuel Your 2016 Strategic PlansHealth Care Workforce Trends to Fuel Your 2016 Strategic Plans
Health Care Workforce Trends to Fuel Your 2016 Strategic Plans
 
2012 Membership Marketing Benchmarking Report by Tony Rossell_Marketing_Gener...
2012 Membership Marketing Benchmarking Report by Tony Rossell_Marketing_Gener...2012 Membership Marketing Benchmarking Report by Tony Rossell_Marketing_Gener...
2012 Membership Marketing Benchmarking Report by Tony Rossell_Marketing_Gener...
 
2012 Membership Marketing Benchmarking Report
2012 Membership Marketing Benchmarking Report2012 Membership Marketing Benchmarking Report
2012 Membership Marketing Benchmarking Report
 
The Forbes Funds Soundings Breakfast Session on the Wage and Compensation of ...
The Forbes Funds Soundings Breakfast Session on the Wage and Compensation of ...The Forbes Funds Soundings Breakfast Session on the Wage and Compensation of ...
The Forbes Funds Soundings Breakfast Session on the Wage and Compensation of ...
 
AdoTube_2012 Global Format Index
AdoTube_2012 Global Format IndexAdoTube_2012 Global Format Index
AdoTube_2012 Global Format Index
 
Membership performance improvement seminar nyc 2012
Membership performance improvement seminar nyc 2012Membership performance improvement seminar nyc 2012
Membership performance improvement seminar nyc 2012
 
What do employees think about pay
What do employees think about payWhat do employees think about pay
What do employees think about pay
 
2016 Laborshed Executive Summary for Greater Burlington
2016 Laborshed Executive Summary for Greater Burlington2016 Laborshed Executive Summary for Greater Burlington
2016 Laborshed Executive Summary for Greater Burlington
 
Demand Generation Tools Webcast: Drive more leads with Alinean value-marketin...
Demand Generation Tools Webcast: Drive more leads with Alinean value-marketin...Demand Generation Tools Webcast: Drive more leads with Alinean value-marketin...
Demand Generation Tools Webcast: Drive more leads with Alinean value-marketin...
 
Generational Retirement Trends Study - 2015
Generational Retirement Trends Study - 2015Generational Retirement Trends Study - 2015
Generational Retirement Trends Study - 2015
 
Intact Investor Presentation - March 2010
Intact Investor Presentation - March 2010Intact Investor Presentation - March 2010
Intact Investor Presentation - March 2010
 
Intact Investor Presentation - June 2010
Intact Investor Presentation - June 2010Intact Investor Presentation - June 2010
Intact Investor Presentation - June 2010
 
Intact Investor Presentation
Intact Investor PresentationIntact Investor Presentation
Intact Investor Presentation
 

Recently uploaded

CARE OF CHILD IN INCUBATOR..........pptx
CARE OF CHILD IN INCUBATOR..........pptxCARE OF CHILD IN INCUBATOR..........pptx
CARE OF CHILD IN INCUBATOR..........pptxGaneshChakor2
 
The Most Excellent Way | 1 Corinthians 13
The Most Excellent Way | 1 Corinthians 13The Most Excellent Way | 1 Corinthians 13
The Most Excellent Way | 1 Corinthians 13Steve Thomason
 
Measures of Central Tendency: Mean, Median and Mode
Measures of Central Tendency: Mean, Median and ModeMeasures of Central Tendency: Mean, Median and Mode
Measures of Central Tendency: Mean, Median and ModeThiyagu K
 
1029-Danh muc Sach Giao Khoa khoi 6.pdf
1029-Danh muc Sach Giao Khoa khoi  6.pdf1029-Danh muc Sach Giao Khoa khoi  6.pdf
1029-Danh muc Sach Giao Khoa khoi 6.pdfQucHHunhnh
 
Industrial Policy - 1948, 1956, 1973, 1977, 1980, 1991
Industrial Policy - 1948, 1956, 1973, 1977, 1980, 1991Industrial Policy - 1948, 1956, 1973, 1977, 1980, 1991
Industrial Policy - 1948, 1956, 1973, 1977, 1980, 1991RKavithamani
 
Employee wellbeing at the workplace.pptx
Employee wellbeing at the workplace.pptxEmployee wellbeing at the workplace.pptx
Employee wellbeing at the workplace.pptxNirmalaLoungPoorunde1
 
Accessible design: Minimum effort, maximum impact
Accessible design: Minimum effort, maximum impactAccessible design: Minimum effort, maximum impact
Accessible design: Minimum effort, maximum impactdawncurless
 
Kisan Call Centre - To harness potential of ICT in Agriculture by answer farm...
Kisan Call Centre - To harness potential of ICT in Agriculture by answer farm...Kisan Call Centre - To harness potential of ICT in Agriculture by answer farm...
Kisan Call Centre - To harness potential of ICT in Agriculture by answer farm...Krashi Coaching
 
Introduction to AI in Higher Education_draft.pptx
Introduction to AI in Higher Education_draft.pptxIntroduction to AI in Higher Education_draft.pptx
Introduction to AI in Higher Education_draft.pptxpboyjonauth
 
Q4-W6-Restating Informational Text Grade 3
Q4-W6-Restating Informational Text Grade 3Q4-W6-Restating Informational Text Grade 3
Q4-W6-Restating Informational Text Grade 3JemimahLaneBuaron
 
Z Score,T Score, Percential Rank and Box Plot Graph
Z Score,T Score, Percential Rank and Box Plot GraphZ Score,T Score, Percential Rank and Box Plot Graph
Z Score,T Score, Percential Rank and Box Plot GraphThiyagu K
 
Software Engineering Methodologies (overview)
Software Engineering Methodologies (overview)Software Engineering Methodologies (overview)
Software Engineering Methodologies (overview)eniolaolutunde
 
18-04-UA_REPORT_MEDIALITERAСY_INDEX-DM_23-1-final-eng.pdf
18-04-UA_REPORT_MEDIALITERAСY_INDEX-DM_23-1-final-eng.pdf18-04-UA_REPORT_MEDIALITERAСY_INDEX-DM_23-1-final-eng.pdf
18-04-UA_REPORT_MEDIALITERAСY_INDEX-DM_23-1-final-eng.pdfssuser54595a
 
Web & Social Media Analytics Previous Year Question Paper.pdf
Web & Social Media Analytics Previous Year Question Paper.pdfWeb & Social Media Analytics Previous Year Question Paper.pdf
Web & Social Media Analytics Previous Year Question Paper.pdfJayanti Pande
 
Organic Name Reactions for the students and aspirants of Chemistry12th.pptx
Organic Name Reactions  for the students and aspirants of Chemistry12th.pptxOrganic Name Reactions  for the students and aspirants of Chemistry12th.pptx
Organic Name Reactions for the students and aspirants of Chemistry12th.pptxVS Mahajan Coaching Centre
 
Beyond the EU: DORA and NIS 2 Directive's Global Impact
Beyond the EU: DORA and NIS 2 Directive's Global ImpactBeyond the EU: DORA and NIS 2 Directive's Global Impact
Beyond the EU: DORA and NIS 2 Directive's Global ImpactPECB
 
Privatization and Disinvestment - Meaning, Objectives, Advantages and Disadva...
Privatization and Disinvestment - Meaning, Objectives, Advantages and Disadva...Privatization and Disinvestment - Meaning, Objectives, Advantages and Disadva...
Privatization and Disinvestment - Meaning, Objectives, Advantages and Disadva...RKavithamani
 
URLs and Routing in the Odoo 17 Website App
URLs and Routing in the Odoo 17 Website AppURLs and Routing in the Odoo 17 Website App
URLs and Routing in the Odoo 17 Website AppCeline George
 
Nutritional Needs Presentation - HLTH 104
Nutritional Needs Presentation - HLTH 104Nutritional Needs Presentation - HLTH 104
Nutritional Needs Presentation - HLTH 104misteraugie
 

Recently uploaded (20)

CARE OF CHILD IN INCUBATOR..........pptx
CARE OF CHILD IN INCUBATOR..........pptxCARE OF CHILD IN INCUBATOR..........pptx
CARE OF CHILD IN INCUBATOR..........pptx
 
The Most Excellent Way | 1 Corinthians 13
The Most Excellent Way | 1 Corinthians 13The Most Excellent Way | 1 Corinthians 13
The Most Excellent Way | 1 Corinthians 13
 
Measures of Central Tendency: Mean, Median and Mode
Measures of Central Tendency: Mean, Median and ModeMeasures of Central Tendency: Mean, Median and Mode
Measures of Central Tendency: Mean, Median and Mode
 
1029-Danh muc Sach Giao Khoa khoi 6.pdf
1029-Danh muc Sach Giao Khoa khoi  6.pdf1029-Danh muc Sach Giao Khoa khoi  6.pdf
1029-Danh muc Sach Giao Khoa khoi 6.pdf
 
Industrial Policy - 1948, 1956, 1973, 1977, 1980, 1991
Industrial Policy - 1948, 1956, 1973, 1977, 1980, 1991Industrial Policy - 1948, 1956, 1973, 1977, 1980, 1991
Industrial Policy - 1948, 1956, 1973, 1977, 1980, 1991
 
Employee wellbeing at the workplace.pptx
Employee wellbeing at the workplace.pptxEmployee wellbeing at the workplace.pptx
Employee wellbeing at the workplace.pptx
 
Accessible design: Minimum effort, maximum impact
Accessible design: Minimum effort, maximum impactAccessible design: Minimum effort, maximum impact
Accessible design: Minimum effort, maximum impact
 
Kisan Call Centre - To harness potential of ICT in Agriculture by answer farm...
Kisan Call Centre - To harness potential of ICT in Agriculture by answer farm...Kisan Call Centre - To harness potential of ICT in Agriculture by answer farm...
Kisan Call Centre - To harness potential of ICT in Agriculture by answer farm...
 
Introduction to AI in Higher Education_draft.pptx
Introduction to AI in Higher Education_draft.pptxIntroduction to AI in Higher Education_draft.pptx
Introduction to AI in Higher Education_draft.pptx
 
Q4-W6-Restating Informational Text Grade 3
Q4-W6-Restating Informational Text Grade 3Q4-W6-Restating Informational Text Grade 3
Q4-W6-Restating Informational Text Grade 3
 
Z Score,T Score, Percential Rank and Box Plot Graph
Z Score,T Score, Percential Rank and Box Plot GraphZ Score,T Score, Percential Rank and Box Plot Graph
Z Score,T Score, Percential Rank and Box Plot Graph
 
Software Engineering Methodologies (overview)
Software Engineering Methodologies (overview)Software Engineering Methodologies (overview)
Software Engineering Methodologies (overview)
 
18-04-UA_REPORT_MEDIALITERAСY_INDEX-DM_23-1-final-eng.pdf
18-04-UA_REPORT_MEDIALITERAСY_INDEX-DM_23-1-final-eng.pdf18-04-UA_REPORT_MEDIALITERAСY_INDEX-DM_23-1-final-eng.pdf
18-04-UA_REPORT_MEDIALITERAСY_INDEX-DM_23-1-final-eng.pdf
 
Web & Social Media Analytics Previous Year Question Paper.pdf
Web & Social Media Analytics Previous Year Question Paper.pdfWeb & Social Media Analytics Previous Year Question Paper.pdf
Web & Social Media Analytics Previous Year Question Paper.pdf
 
Organic Name Reactions for the students and aspirants of Chemistry12th.pptx
Organic Name Reactions  for the students and aspirants of Chemistry12th.pptxOrganic Name Reactions  for the students and aspirants of Chemistry12th.pptx
Organic Name Reactions for the students and aspirants of Chemistry12th.pptx
 
Beyond the EU: DORA and NIS 2 Directive's Global Impact
Beyond the EU: DORA and NIS 2 Directive's Global ImpactBeyond the EU: DORA and NIS 2 Directive's Global Impact
Beyond the EU: DORA and NIS 2 Directive's Global Impact
 
Staff of Color (SOC) Retention Efforts DDSD
Staff of Color (SOC) Retention Efforts DDSDStaff of Color (SOC) Retention Efforts DDSD
Staff of Color (SOC) Retention Efforts DDSD
 
Privatization and Disinvestment - Meaning, Objectives, Advantages and Disadva...
Privatization and Disinvestment - Meaning, Objectives, Advantages and Disadva...Privatization and Disinvestment - Meaning, Objectives, Advantages and Disadva...
Privatization and Disinvestment - Meaning, Objectives, Advantages and Disadva...
 
URLs and Routing in the Odoo 17 Website App
URLs and Routing in the Odoo 17 Website AppURLs and Routing in the Odoo 17 Website App
URLs and Routing in the Odoo 17 Website App
 
Nutritional Needs Presentation - HLTH 104
Nutritional Needs Presentation - HLTH 104Nutritional Needs Presentation - HLTH 104
Nutritional Needs Presentation - HLTH 104
 

2011 compensation survey averages salaries by region

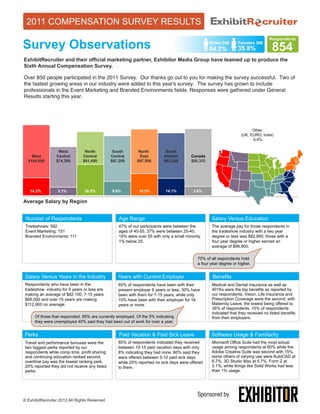
  • 1. 2011 COMPENSATION SURVEY RESULTS Respondents Survey Observations Males 548 64.2% Females 306 35.8% 854 ExhibitRecruiter and their official marketing partner, Exhibitor Media Group have teamed up to produce the Sixth Annual Compensation Survey. Over 850 people participated in the 2011 Survey. Our thanks go out to you for making the survey successful. Two of the fastest growing areas in our industry were added to this year's survey. The survey has grown to include professionals in the Event Marketing and Branded Environments fields. Responses were gathered under General Results starting this year. Other (UK, EURO, India) 5.4% West North South North South West Central Central Central East Atlantic Canada $104,650 $74,300 $91,450 $87,200 $97,550 $93,200 $98,300 14.2% 3.1% 30.5% 9.6% 19.5% 14.1% 3.6% Average Salary by Region Number of Respondents Age Range Salary Versus Education Tradeshows: 592 47% of our participants were between the The average pay for those respondents in Event Marketing: 151 ages of 40-55, 37% were between 25-40, the tradeshow industry with a two year Branded Environments: 111 15% were over 55 with only a small minority, degree or less was $82,850, those with a 1% below 25. four year degree or higher earned an average of $99,900. 70% of all respondents hold a four year degree or higher. Salary Versus Years in the Industry Years with Current Employer Benefits Respondents who have been in the 60% of respondents have been with their Medical and Dental insurance as well as tradeshow industry for 6 years or less are present employer 6 years or less, 30% have 401Ks were the top benefits as reported by making an average of $82,100, 7-15 years been with them for 7-15 years, while only our respondents, Vision, Life insurance and $85,000 and over 15 years are making 10% have been with their employer for 16 Prescription Coverage were the second, with $112,900 on average. years or more. Maternity Leave, the lowest being offered to 35% of respondents. 10% of respondents indicated that they received no listed benefits Of those that responded, 95% are currently employed. Of the 5% indicating from their employers. they were unemployed 40% said they had been out of work for over a year. Perks Paid Vacation & Paid Sick Leave Software Usage & Familiarity Travel and performance bonuses were the 65% of respondents indicated they received Microsoft Office Suite had the most actual two biggest perks reported by our between 10-15 paid vacation days with only usage among respondents at 60% while the respondents while comp time, profit sharing 8% indicating they had none. 60% said they Adobe Creative Suite was second with 15%, and continuing education ranked second, were offered between 5-10 paid sick days some others of varying use were AutoCAD at overtime pay was the lowest ranking perk. while 25% reported no sick days were offered 6.7%, 3D Studio Max at 5.7%, Form Z at 20% reported they did not receive any listed to them. 3.1%, while things like Solid Works had less perks. than 1% usage. Sponsored by © ExhibitRecruiter 2012 All Rights Reserved
  • 2. 2011 COMPENSATION SURVEY RESULTS Annual Sales Volume of Current Employer 0-5 6-20 21-55 56-100 101-200 Over 200 Not Sure Million Million Million Million Million Million 23.3% 31.1% 13.4% 4.8% 4.8% 10.4% 12.2% 182 242 105 37 37 81 96 Number of People Employed at Current Employer 1-9 10-19 20-49 50-99 100-249 250-499 500-999 Over 1000 People People People People People People People People 13.4% 8.7% 25.8% 16.0% 13.6% 7.7% 3.8% 11.0% 104 68 201 125 106 60 30 86 Social Networking Usage LinkedIn Facebook Twitter Google + None of These Plaxo Ning Sponsored by © ExhibitRecruiter 2012 All Rights Reserved