Multi-Family Housing Activity Report, October 2012
•
1 like•209 views

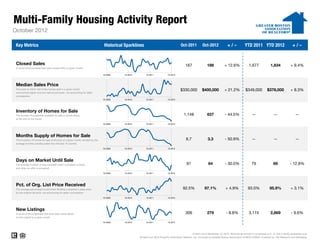
The report summarizes multi-family housing activity for October 2012. Key metrics such as closed sales, median sales price, inventory, and days on market are presented alongside year-over-year comparisons. Closed sales increased 12.6% from October 2011 while median sales price rose 21.2%. Inventory declined sharply by 44.5% and months supply fell by 50.9%, indicating a tighter market. Days on market also decreased by 30%, showing quicker sales.

Recommended
Recommended
More Related Content
What's hot
What's hot (17)
Similar to Multi-Family Housing Activity Report, October 2012
Similar to Multi-Family Housing Activity Report, October 2012 (20)
More from Unit Realty Group
More from Unit Realty Group (20)
Recently uploaded
Recently uploaded (20)
Multi-Family Housing Activity Report, October 2012
- 1. Multi-Family Housing Activity Report 5B October 2012 Key Metrics Historical Sparklines Oct-2011 Oct-2012 +/– YTD 2011 YTD 2012 +/– Closed Sales 167 188 + 12.6% 1,677 1,834 + 9.4% A count of actual sales that have closed within a given month. 10-2009 10-2010 10-2011 10-2012 Median Sales Price The point at which half of the homes sold in a given month $330,000 $400,000 + 21.2% $349,000 $378,000 + 8.3% were priced higher and one half priced lower, not accounting for seller concessions. 10-2009 10-2010 10-2011 10-2012 Inventory of Homes for Sale The number of properties available for sale in active status 1,148 637 - 44.5% -- -- -- at the end of the month. 10-2009 10-2010 10-2011 10-2012 Months Supply of Homes for Sale The inventory of homes for sale at the end of a given month, divided by the 6.7 3.3 - 50.9% -- -- -- average monthly pending sales from the last 12 months. 10-2009 10-2010 10-2011 10-2012 Days on Market Until Sale The average number of days between when a property is listed 91 64 - 30.0% 79 69 - 12.8% and when an offer is accepted. 10-2009 10-2010 10-2011 10-2012 Pct. of Org. List Price Received The average percentage found when dividing a property's sales price 92.5% 97.1% + 4.9% 93.0% 95.9% + 3.1% by the original list price, not accounting for seller concessions. 10-2009 10-2010 10-2011 10-2012 New Listings A count of the properties that have been newly listed 306 279 - 8.8% 3,174 2,869 - 9.6% on the market in a given month. 10-2009 10-2010 10-2011 10-2012 Current as of November 16, 2012. Multi-family activity is comprised of 2-, 3- and 4-family properties only. All data from MLS Property Information Network, Inc. Provided by Greater Boston Association of REALTORS®. Powered by 10K Research and Marketing.
- 2. Multi-Family Housing Activity Report – 2-Family Properties October 2012 Closed Sales Median Sales Price Days on Market Inventory 10-2011 10-2012 +/– 10-2011 10-2012 +/– 10-2011 10-2012 +/– 10-2011 10-2012 +/– Acton 0 2 -- $0 $350,000 -- 0 39 -- 1 0 -100.0% Arlington 4 4 0.0% $555,500 $577,000 +3.9% 46 15 -68.6% 11 3 -72.7% Ashland 1 0 -100.0% $210,000 $0 -100.0% 130 0 -100.0% 2 2 0.0% Attleboro 4 2 -50.0% $122,700 $206,250 +68.1% 122 46 -62.8% 23 18 -21.7% Bedford 1 1 0.0% $440,000 $332,000 -24.5% 37 39 5.4% 2 1 -50.0% Bellingham 0 0 -- $0 $0 -- 0 0 -- 1 2 +100.0% Belmont 1 3 +200.0% $440,000 $676,000 +53.6% 361 19 -94.6% 9 6 -33.3% Boston 24 29 +20.8% $332,500 $400,000 +20.3% 82 62 -23.9% 200 101 -49.5% Boxborough 0 0 -- $0 $0 -- 0 0 -- 0 0 -- Brookline 2 1 -50.0% $862,000 $650,000 -24.6% 2 9 500.0% 9 5 -44.4% Burlington 0 0 -- $0 $0 -- 0 0 -- 1 1 0.0% Cambridge 2 4 +100.0% $875,000 $599,550 -31.5% 123 35 -71.6% 13 6 -53.8% Canton 0 0 -- $0 $0 -- 0 0 -- 4 3 -25.0% Carlisle 0 0 -- $0 $0 -- 0 0 -- 1 1 0.0% Chelsea 2 3 +50.0% $208,500 $268,000 +28.5% 44 98 124.5% 20 9 -55.0% Concord 0 0 -- $0 $0 -- 0 0 -- 4 6 +50.0% Dedham 1 1 0.0% $181,500 $317,000 +74.7% 49 150 206.1% 5 8 +60.0% Dover 0 0 -- $0 $0 -- 0 0 -- 0 1 -- Everett 8 7 -12.5% $240,000 $327,500 +36.5% 97 59 -39.2% 33 15 -54.5% Foxborough 0 0 -- $0 $0 -- 0 0 -- 2 0 -100.0% Framingham 3 2 -33.3% $292,900 $282,500 -3.6% 98 148 50.0% 15 4 -73.3% Franklin 0 1 -- $0 $320,000 -- 0 26 -- 5 2 -60.0% Holliston 1 0 -100.0% $226,000 $0 -100.0% 331 0 -100.0% 1 0 -100.0% Hopkinton 0 0 -- $0 $0 -- 0 0 -- 1 0 -100.0% Hudson 0 1 -- $0 $205,000 -- 0 24 -- 8 5 -37.5% Lexington 0 0 -- $0 $0 -- 0 0 -- 1 1 0.0% Lincoln 0 0 -- $0 $0 -- 0 0 -- 1 4 +300.0% Malden 5 7 +40.0% $312,199 $385,000 +23.3% 97 47 -52.0% 49 25 -49.0% Mansfield 1 0 -100.0% $160,250 $0 -100.0% 8 0 -100.0% 8 3 -62.5% Marlborough 3 3 0.0% $140,600 $156,900 +11.6% 180 137 -24.2% 18 14 -22.2% Maynard 0 1 -- $0 $190,000 -- 0 151 -- 4 3 -25.0% Medfield 0 0 -- $0 $0 -- 0 0 -- 1 4 +300.0% Medford 2 6 +200.0% $371,000 $441,250 +18.9% 80 23 -70.8% 27 17 -37.0% Medway 0 0 -- $0 $0 -- 0 0 -- 6 3 -50.0% Milford 3 2 -33.3% $203,500 $220,750 +8.5% 30 111 264.3% 13 11 -15.4% Millis 0 0 -- $0 $0 -- 0 0 -- 2 1 -50.0% Milton 3 2 -33.3% $362,500 $288,500 -20.4% 223 81 -63.7% 14 5 -64.3% Natick 0 3 -- $0 $418,000 -- 0 75 -- 4 3 -25.0% Needham 0 0 -- $0 $0 -- 0 0 -- 2 1 -50.0% Newton 5 2 -60.0% $633,000 $742,500 +17.3% 60 39 -34.8% 29 14 -51.7% All data from MLS Property Information Network, Inc. Provided by Greater Boston Association of REALTORS®. Powered by 10K Research and Marketing.
- 3. Multi-Family Housing Activity Report – 2-Family Properties (cont.) October 2012 Closed Sales Median Sales Price Days on Market Inventory 10-2011 10-2012 +/– 10-2011 10-2012 +/– 10-2011 10-2012 +/– 10-2011 10-2012 +/– Norfolk 0 0 -- $0 $0 -- 0 0 -- 0 0 -- North Attleboro 0 0 -- $0 $0 -- 0 0 -- 7 4 - 42.9% Norwood 1 0 - 100.0% $361,000 $0 - 100.0% 87 0 - 100.0% 9 3 - 66.7% Plainville 0 1 -- $0 $235,000 -- 0 76 -- 3 1 - 66.7% Quincy 8 8 0.0% $329,444 $391,500 + 18.8% 64 57 - 10.4% 33 18 - 45.5% Revere 7 9 + 28.6% $365,000 $351,000 - 3.8% 108 111 + 2.5% 46 24 - 47.8% Saugus 1 1 0.0% $299,000 $463,500 + 55.0% 115 28 - 75.7% 4 5 + 25.0% Sharon 0 0 -- $0 $0 -- 0 0 -- 1 1 0.0% Sherborn 0 0 -- $0 $0 -- 0 0 -- 0 1 -- Somerville 7 10 + 42.9% $467,500 $537,500 + 15.0% 92 47 - 49.1% 41 21 - 48.8% Southborough 1 0 - 100.0% $324,000 $0 - 100.0% 332 0 - 100.0% 2 2 0.0% Stow 0 0 -- $0 $0 -- 0 0 -- 1 2 + 100.0% Sudbury 0 0 -- $0 $0 -- 0 0 -- 0 1 -- Walpole 0 1 -- $0 $152,000 -- 0 75 -- 3 1 - 66.7% Waltham 3 4 + 33.3% $415,000 $354,500 - 14.6% 185 211 + 14.1% 19 4 - 78.9% Watertown 4 6 + 50.0% $456,500 $566,500 + 24.1% 76 73 - 3.5% 15 6 - 60.0% Wayland 0 0 -- $0 $0 -- 0 0 -- 2 1 - 50.0% Wellesley 1 0 - 100.0% $685,000 $0 - 100.0% 7 0 - 100.0% 3 1 - 66.7% Weston 0 0 -- $0 $0 -- 0 0 -- 1 0 - 100.0% Westwood 0 0 -- $0 $0 -- 0 0 -- 0 0 -- Winchester 0 2 -- $0 $558,803 -- 0 151 -- 5 4 - 20.0% Winthrop 2 1 - 50.0% $257,500 $141,000 - 45.2% 26 129 + 405.9% 13 3 - 76.9% Woburn 4 1 - 75.0% $220,500 $330,900 + 50.1% 39 7 - 81.9% 11 10 - 9.1% Wrentham 0 0 -- $0 $0 -- 0 0 -- 1 1 0.0% Greater Boston 115 131 +13.9% $330,000 $385,000 +16.7% 93 69 -26.2% 767 420 -45.2% Note: The "Greater Boston" figures are not a compilation or total of the individual areas. All data from MLS Property Information Network, Inc. Provided by Greater Boston Association of REALTORS®. Powered by 10K Research and Marketing.
- 4. Multi-Family Housing Activity Report – 3-Family Properties October 2012 Closed Sales Median Sales Price Days on Market Inventory 10-2011 10-2012 +/– 10-2011 10-2012 +/– 10-2011 10-2012 +/– 10-2011 10-2012 +/– Acton 0 0 -- $0 $0 -- 0 0 -- 0 0 -- Arlington 0 0 -- $0 $0 -- 0 0 -- 2 1 -50.0% Ashland 0 0 -- $0 $0 -- 0 0 -- 3 4 +33.3% Attleboro 2 2 0.0% $143,500 $114,250 -20.4% 37 60 +60.8% 13 9 -30.8% Bedford 0 0 -- $0 $0 -- 0 0 -- 0 0 -- Bellingham 0 0 -- $0 $0 -- 0 0 -- 0 0 -- Belmont 0 0 -- $0 $0 -- 0 0 -- 0 0 -- Boston 22 24 +9.1% $317,500 $396,250 +24.8% 39 49 +27.2% 156 85 -45.5% Boxborough 0 0 -- $0 $0 -- 0 0 -- 0 0 -- Brookline 0 0 -- $0 $0 -- 0 0 -- 5 2 -60.0% Burlington 0 0 -- $0 $0 -- 0 0 -- 1 0 -100.0% Cambridge 1 3 +200.0% $669,000 $856,000 +28.0% 63 24 -62.4% 7 4 -42.9% Canton 0 0 -- $0 $0 -- 0 0 -- 0 0 -- Carlisle 0 0 -- $0 $0 -- 0 0 -- 0 0 -- Chelsea 4 0 -100.0% $240,500 $0 -100.0% 85 0 -100.0% 15 15 0.0% Concord 0 0 -- $0 $0 -- 0 0 -- 2 1 -50.0% Dedham 0 0 -- $0 $0 -- 0 0 -- 1 0 -100.0% Dover 0 0 -- $0 $0 -- 0 0 -- 0 0 -- Everett 2 5 +150.0% $362,500 $385,000 +6.2% 22 46 +115.8% 15 14 -6.7% Foxborough 0 0 -- $0 $0 -- 0 0 -- 0 0 -- Framingham 1 1 0.0% $155,000 $270,000 +74.2% 46 227 +393.5% 5 2 -60.0% Franklin 0 0 -- $0 $0 -- 0 0 -- 4 1 -75.0% Holliston 0 0 -- $0 $0 -- 0 0 -- 0 1 -- Hopkinton 0 0 -- $0 $0 -- 0 0 -- 0 0 -- Hudson 0 0 -- $0 $0 -- 0 0 -- 1 5 +400.0% Lexington 0 0 -- $0 $0 -- 0 0 -- 0 0 -- Lincoln 0 0 -- $0 $0 -- 0 0 -- 0 0 -- Malden 2 1 -50.0% $358,000 $435,000 +21.5% 503 25 -95.0% 10 4 -60.0% Mansfield 0 0 -- $0 $0 -- 0 0 -- 0 0 -- Marlborough 1 0 -100.0% $185,000 $0 -100.0% 11 0 -100.0% 4 2 -50.0% Maynard 0 0 -- $0 $0 -- 0 0 -- 1 0 -100.0% Medfield 0 0 -- $0 $0 -- 0 0 -- 0 0 -- Medford 0 3 -- $0 $550,000 -- 0 8 -- 10 2 -80.0% Medway 0 0 -- $0 $0 -- 0 0 -- 0 0 -- Milford 0 0 -- $0 $0 -- 0 0 -- 4 3 -25.0% Millis 0 0 -- $0 $0 -- 0 0 -- 0 0 -- Milton 0 0 -- $0 $0 -- 0 0 -- 2 0 -100.0% Natick 1 0 -100.0% $355,000 $0 -100.0% 316 0 -100.0% 2 1 -50.0% Needham 0 0 -- $0 $0 -- 0 0 -- 2 2 0.0% Newton 1 1 0.0% $465,000 $1,885,000 +305.4% 63 123 +95.2% 5 3 -40.0% All data from MLS Property Information Network, Inc. Provided by Greater Boston Association of REALTORS®. Powered by 10K Research and Marketing.
- 5. Multi-Family Housing Activity Report – 3-Family Properties (cont.) October 2012 Closed Sales Median Sales Price Days on Market Inventory 10-2011 10-2012 +/– 10-2011 10-2012 +/– 10-2011 10-2012 +/– 10-2011 10-2012 +/– Norfolk 0 0 -- $0 $0 -- 0 0 -- 0 0 -- North Attleboro 0 1 -- $0 $240,000 -- 0 136 -- 4 3 -25.0% Norwood 0 1 -- $0 $346,125 -- 0 39 -- 2 0 -100.0% Plainville 0 0 -- $0 $0 -- 0 0 -- 1 1 0.0% Quincy 1 1 0.0% $239,900 $510,000 +112.6% 21 22 +4.8% 8 4 -50.0% Revere 1 0 -100.0% $175,000 $0 -100.0% 155 0 -100.0% 10 2 -80.0% Saugus 0 0 -- $0 $0 -- 0 0 -- 0 1 -- Sharon 0 0 -- $0 $0 -- 0 0 -- 0 0 -- Sherborn 0 0 -- $0 $0 -- 0 0 -- 0 0 -- Somerville 3 1 -66.7% $530,000 $680,000 +28.3% 30 31 +3.3% 16 10 -37.5% Southborough 0 0 -- $0 $0 -- 0 0 -- 0 0 -- Stow 0 0 -- $0 $0 -- 0 0 -- 0 0 -- Sudbury 0 0 -- $0 $0 -- 0 0 -- 0 0 -- Walpole 0 0 -- $0 $0 -- 0 0 -- 1 1 0.0% Waltham 0 1 -- $0 $463,000 -- 0 36 -- 9 1 -88.9% Watertown 1 0 -100.0% $505,000 $0 -100.0% 123 0 -100.0% 1 2 +100.0% Wayland 0 0 -- $0 $0 -- 0 0 -- 0 0 -- Wellesley 0 0 -- $0 $0 -- 0 0 -- 0 0 -- Weston 0 0 -- $0 $0 -- 0 0 -- 0 0 -- Westwood 0 0 -- $0 $0 -- 0 0 -- 0 0 -- Winchester 0 0 -- $0 $0 -- 0 0 -- 0 0 -- Winthrop 1 0 -100.0% $323,000 $0 -100.0% 159 0 -100.0% 3 1 -66.7% Woburn 0 0 -- $0 $0 -- 0 0 -- 0 1 -- Wrentham 0 0 -- $0 $0 -- 0 0 -- 1 1 0.0% Greater Boston 44 45 +2.3% $317,500 $402,000 +26.6% 76 50 -34.0% 325 185 -43.1% Note: The "Greater Boston" figures are not a compilation or total of the individual areas. All data from MLS Property Information Network, Inc. Provided by Greater Boston Association of REALTORS®. Powered by 10K Research and Marketing.
- 6. Multi-Family Housing Activity Report – 4-Family Properties October 2012 Closed Sales Median Sales Price Days on Market Inventory 10-2011 10-2012 +/– 10-2011 10-2012 +/– 10-2011 10-2012 +/– 10-2011 10-2012 +/– Acton 0 0 -- $0 $0 -- 0 0 -- 0 1 -- Arlington 0 0 -- $0 $0 -- 0 0 -- 1 0 -100.0% Ashland 0 0 -- $0 $0 -- 0 0 -- 0 0 -- Attleboro 0 0 -- $0 $0 -- 0 0 -- 3 1 -66.7% Bedford 0 0 -- $0 $0 -- 0 0 -- 0 0 -- Bellingham 0 0 -- $0 $0 -- 0 0 -- 1 0 -100.0% Belmont 0 0 -- $0 $0 -- 0 0 -- 0 0 -- Boston 4 3 -25.0% $605,000 $700,000 +15.7% 174 20 -88.5% 12 8 -33.3% Boxborough 0 0 -- $0 $0 -- 0 0 -- 0 0 -- Brookline 0 1 -- $0 $1,680,000 -- 0 22 -- 0 1 -- Burlington 0 0 -- $0 $0 -- 0 0 -- 0 0 -- Cambridge 0 1 -- $0 $1,475,000 -- 0 98 -- 2 2 0.0% Canton 1 0 -100.0% $490,000 $0 -100.0% 16 0 -100.0% 0 0 -- Carlisle 0 0 -- $0 $0 -- 0 0 -- 0 0 -- Chelsea 0 0 -- $0 $0 -- 0 0 -- 2 0 -100.0% Concord 0 0 -- $0 $0 -- 0 0 -- 0 0 -- Dedham 0 0 -- $0 $0 -- 0 0 -- 0 0 -- Dover 0 0 -- $0 $0 -- 0 0 -- 0 0 -- Everett 0 0 -- $0 $0 -- 0 0 -- 1 1 0.0% Foxborough 0 0 -- $0 $0 -- 0 0 -- 0 0 -- Framingham 0 0 -- $0 $0 -- 0 0 -- 3 1 -66.7% Franklin 0 0 -- $0 $0 -- 0 0 -- 0 0 -- Holliston 0 0 -- $0 $0 -- 0 0 -- 1 3 +200.0% Hopkinton 0 0 -- $0 $0 -- 0 0 -- 0 0 -- Hudson 0 0 -- $0 $0 -- 0 0 -- 0 1 -- Lexington 0 0 -- $0 $0 -- 0 0 -- 0 0 -- Lincoln 0 0 -- $0 $0 -- 0 0 -- 1 0 -100.0% Malden 0 0 -- $0 $0 -- 0 0 -- 2 0 -100.0% Mansfield 0 0 -- $0 $0 -- 0 0 -- 0 0 -- Marlborough 0 0 -- $0 $0 -- 0 0 -- 2 3 +50.0% Maynard 0 0 -- $0 $0 -- 0 0 -- 0 0 -- Medfield 0 0 -- $0 $0 -- 0 0 -- 0 1 -- Medford 0 0 -- $0 $0 -- 0 0 -- 2 1 -50.0% Medway 0 0 -- $0 $0 -- 0 0 -- 0 0 -- Milford 0 0 -- $0 $0 -- 0 0 -- 2 1 -50.0% Millis 0 0 -- $0 $0 -- 0 0 -- 0 0 -- Milton 0 0 -- $0 $0 -- 0 0 -- 0 0 -- Natick 0 0 -- $0 $0 -- 0 0 -- 0 0 -- Needham 0 0 -- $0 $0 -- 0 0 -- 0 0 -- Newton 0 0 -- $0 $0 -- 0 0 -- 1 1 0.0% All data from MLS Property Information Network, Inc. Provided by Greater Boston Association of REALTORS®. Powered by 10K Research and Marketing.
- 7. Multi-Family Housing Activity Report – 4-Family Properties (cont.) October 2012 Closed Sales Median Sales Price Days on Market Inventory 10-2011 10-2012 +/– 10-2011 10-2012 +/– 10-2011 10-2012 +/– 10-2011 10-2012 +/– Norfolk 0 0 -- $0 $0 -- 0 0 -- 0 0 -- North Attleboro 0 0 -- $0 $0 -- 0 0 -- 1 1 0.0% Norwood 0 0 -- $0 $0 -- 0 0 -- 0 0 -- Plainville 0 0 -- $0 $0 -- 0 0 -- 2 2 0.0% Quincy 0 2 -- $0 $692,500 -- 0 190 -- 12 2 -83.3% Revere 0 0 -- $0 $0 -- 0 0 -- 1 1 0.0% Saugus 0 0 -- $0 $0 -- 0 0 -- 0 0 -- Sharon 0 0 -- $0 $0 -- 0 0 -- 0 0 -- Sherborn 0 0 -- $0 $0 -- 0 0 -- 0 0 -- Somerville 2 1 -50.0% $575,000 $1,400,000 +143.5% 134 83 -37.8% 2 1 -50.0% Southborough 0 0 -- $0 $0 -- 0 0 -- 0 0 -- Stow 0 0 -- $0 $0 -- 0 0 -- 0 0 -- Sudbury 0 0 -- $0 $0 -- 0 0 -- 0 0 -- Walpole 0 0 -- $0 $0 -- 0 0 -- 0 0 -- Waltham 0 4 -- $0 $369,666 -- 0 9 -- 2 1 -50.0% Watertown 1 0 -100.0% $577,500 $0 -100.0% 114 0 -100.0% 0 0 -- Wayland 0 0 -- $0 $0 -- 0 0 -- 0 0 -- Wellesley 0 0 -- $0 $0 -- 0 0 -- 0 0 -- Weston 0 0 -- $0 $0 -- 0 0 -- 0 0 -- Westwood 0 0 -- $0 $0 -- 0 0 -- 0 0 -- Winchester 0 0 -- $0 $0 -- 0 0 -- 0 0 -- Winthrop 0 0 -- $0 $0 -- 0 0 -- 0 0 -- Woburn 0 0 -- $0 $0 -- 0 0 -- 1 0 -100.0% Wrentham 0 0 -- $0 $0 -- 0 0 -- 0 0 -- Greater Boston 8 12 +50.0% $553,750 $696,250 +25.7% 136 56 -58.7% 56 32 -42.9% Note: The "Greater Boston" figures are not a compilation or total of the individual areas. All data from MLS Property Information Network, Inc. Provided by Greater Boston Association of REALTORS®. Powered by 10K Research and Marketing.