SlideShare a Scribd company logo
1 of 13
Download to read offline
Monthly IndicatorsA RESEARCH TOOL PROVIDED BY THE GREATER BOSTON ASSOCIATION OF REALTORS®
June 2013 Quick Facts
- 2.8%
Year-Over-Year
(YoY) Change in
Closed Sales
Single-Family Only
As potentially the brightest sun in the current economic recovery, housing
activity has followed the mercury higher this summer. Interest rates and new
construction activity have been in the spotlight lately, fueled by concerns over
tapering Federal Reserve activity and ongoing inventory constraints. Watch for
indications that more homes are selling in less time and at higher price points.
Also watch for sellers returning to an inviting marketplace, which will help
replenish neighborhoods with new listings.
- 4.0%
Year-Over-Year
(YoY) Change in
Closed Sales
Condominium Only
- 3.4%
Year-Over-Year
(YoY) Change in
Closed Sales
All Properties
2
3
4
5
6
7
8
9
10
11
12
13
Data is refreshed regularly to capture changes in market activity so figures shown may be different than previously reported. Current as of July 16, 2013. All data from MLS Property
Information Network, Inc. Provided by Greater Boston Association of REALTORS® and the Massachusetts Association of REALTORS®. Powered by 10K Research and Marketing.
New Listings in the Greater Boston region were up 14.2 percent for detached
homes and 8.5 percent for condominiums. Closed Sales decreased 2.8 percent
for detached homes and 4.0 percent for condominiums.
The Median Sales Price was up 7.8 percent to $541,500 for single-family
properties and 5.5 percent to $422,000 for condominiums. Months Supply of
Inventory decreased 33.6 percent for single-family units and 37.7 percent for
townhouse-condo units.
The economy – which generates the jobs that fuel housing demand – continued
to improve at a moderate pace during the second quarter of 2013. Budget
sequesters and sluggish export growth have taken a back seat to housing
recovery and stronger consumer spending. Interest rates could flirt with 4.0 or
4.25 percent again but the days of 3.3 percent interest are likely behind us.
Single-Family Market Overview
Condominium Market Overview
Closed Sales
Median Sales Price
Housing Affordability Index
Inventory of Homes for Sale
Click on desired metric to jump to that page.
Months Supply of Inventory
Days On Market Until Sale
Percent of Original List Price Received
City of Boston Overview
Pending Sales
New Listings
Single-Family Market Overview
Key market metrics for the current month and year-to-date figures for Single-Family Homes Only.
Key Metrics Historical Sparklines Jun-2012 Jun-2013 + / – YTD 2012 YTD 2013 + / –
Median Sales Price
- 35.4% -- --
- 11.5% 112 100 - 11.2%
--
Housing Affordability Index
Inventory of Homes for Sale
$502,500 + 7.6%
102 90
4,316 2,786
$541,500 + 7.8% $450,000
5,028 + 2.7%Closed Sales 1,511 1,468 - 2.8% 4,894
$484,000
6-2010 6-2011 6-2012 6-2013
6-2010 6-2011 6-2012 6-2013
6-2010 6-2011 6-2012 6-2013
6-2010 6-2011 6-2012 6-2013
93.8% 96.7%
- 23.6%
+ 3.0%
Percent of Original
List Price Received
Days on Market Until Sale
95.3%
- 37.2%
+ 3.2%
56
98.3%
Pending Sales + 10.8%6,9311,192 1,377 + 15.5% 6,257
Months Supply of Inventory 2.9
90 84
-- -- --1.9 - 33.6%
110
All data from MLS Property Information Network, Inc. Provided by the Greater Boston Association of REALTORS® and the Massachusetts Association of REALTORS®. Powered by 10K Research and Marketing. | Click for Cover Page | 2
New Listings 1,352 1,544 + 14.2% 9,223 8,966 - 2.8%
6 2010 6 2011 6 2012 6 2013
6-2010 6-2011 6-2012 6-2013
6-2010 6-2011 6-2012 6-2013
6-2010 6-2011 6-2012 6-2013
6-2010 6-2011 6-2012 6-2013
6-2010 6-2011 6-2012 6-2013
Condominium Market Overview
Key market metrics for the current month and year-to-date figures for Condominium Properties Only.
Key Metrics Historical Sparklines Jun-2012 Jun-2013 + / – YTD 2012 YTD 2013 + / –
+ 5.1%
Median Sales Price $400,000 $422,000 + 5.5% $375,000 $399,900 + 6.6%
Closed Sales 1,264 1,214 - 4.0% 4,437 4,663
- 10.3%
Inventory of Homes for Sale 3,086 1,847 - 40.1% -- -- --
Housing Affordability Index 126 114 - 9.6% 133 119
6-2010 6-2011 6-2012 6-2013
6-2010 6-2011 6-2012 6-2013
6-2010 6-2011 6-2012 6-2013
6-2010 6-2011 6-2012 6-2013
--
Days on Market Until Sale 75 42 - 43.6% 96 62 - 35.5%
Months Supply of Inventory 2.4 1.5 - 37.7% -- --
+ 3.4%
Pending Sales 1,001 1,158 + 15.7% 5,721 6,338 + 10.8%
Percent of Original
List Price Received
96.3% 99.7% + 3.5% 95.3% 98.5%
- 1.7%
All data from MLS Property Information Network, Inc. Provided by the Greater Boston Association of REALTORS® and the Massachusetts Association of REALTORS®. Powered by 10K Research and Marketing. | Click for Cover Page | 3
New Listings 1,152 1,250 + 8.5% 7,874 7,741
6 2010 6 2011 6 2012 6 2013
6-2010 6-2011 6-2012 6-2013
6-2010 6-2011 6-2012 6-2013
6-2010 6-2011 6-2012 6-2013
6-2010 6-2011 6-2012 6-2013
6-2010 6-2011 6-2012 6-2013
Closed Sales
A count of the actual sales that have closed in a given month.
Single-Family
YoY
Change
Condominium
YoY
Change
Jul-2012 1,279 + 25.3% 1,042 + 21.9%
Aug-2012 1,300 + 26.1% 1,204 + 25.3%
Sep-2012 766 - 1.2% 753 + 16.4%
Oct-2012 792 + 28.8% 712 + 39.1%
Nov-2012 907 + 32.4% 760 + 35.0%
Dec-2012 824 + 11.8% 769 + 19.6%
Jan-2013 605 + 15.7% 514 + 24.8%
Feb-2013 431 - 7.1% 434 + 13.0%
Mar-2013 631 - 2.6% 629 + 3.6%
Apr-2013 778 + 4.7% 806 + 6.3%
May-2013 1,115 + 10.9% 1,066 + 5.3%
Jun-2013 1,468 - 2.8% 1,214 - 4.0%
1,245
1,051
1,511
1,264
1,468
1,214
June
20132012 20132012
4,106
3,740
4,894
4,437
5,028
4,663
Year to Date
20132012 201320122011 2011 2011 2011
Total 10,896 + 11.7% 9,903 + 14.9%
All data from MLS Property Information Network, Inc. Provided by the Greater Boston Association of REALTORS® and the Massachusetts Association of REALTORS®. Powered by 10K Research and Marketing. | Click for Cover Page | 4
Single-Family Condominium
200
400
600
800
1,000
1,200
1,400
1,600
1,800
Jan-2003 Jan-2004 Jan-2005 Jan-2006 Jan-2007 Jan-2008 Jan-2009 Jan-2010 Jan-2011 Jan-2012 Jan-2013
Historical Closed Sales Activity Single-Family Condominium
-4.0%+20.3%+21.4%
Single-Family Condominium
+5.1%+18.6%+19.2%-2.8% +2.7%
Median Sales Price
Median price point for all closed sales, not accounting for seller concessions, in a given month.
Single-Family
YoY
Change
Condominium
YoY
Change
Jul-2012 $510,000 + 2.0% $387,000 + 6.3%
Aug-2012 $490,000 - 1.8% $380,000 + 3.0%
Sep-2012 $430,475 - 4.3% $375,000 + 2.0%
Oct-2012 $430,250 + 10.3% $368,133 + 5.6%
Nov-2012 $447,500 + 5.9% $380,000 + 8.2%
Dec-2012 $470,000 + 6.8% $381,000 + 10.4%
Jan-2013 $430,000 + 6.2% $375,000 + 5.6%
Feb-2013 $429,900 + 8.8% $350,375 - 5.3%
Mar-2013 $430,000 + 3.7% $405,500 + 19.3%
Apr-2013 $476,500 + 13.9% $389,000 + 4.7%
May-2013 $499,900 + 7.5% $410,000 + 7.6%
Jun-2013 $541,500 + 7.8% $422,000 + 5.5%
$505,000
$375,000
$502,500
$400,000
$541,500
$422,000
June
20132012 20132012
$450,000
$359,000
$450,000
$375,000
$484,000
$399,900
Year to Date
20132012 201320122011 2011 2011 2011
Median $475,000 + 5.3% $389,000 + 5.6%
All data from MLS Property Information Network, Inc. Provided by the Greater Boston Association of REALTORS® and the Massachusetts Association of REALTORS®. Powered by 10K Research and Marketing. | Click for Cover Page | 5
Single-Family Condominium
$250,000
$300,000
$350,000
$400,000
$450,000
$500,000
$550,000
Jan-2003 Jan-2004 Jan-2005 Jan-2006 Jan-2007 Jan-2008 Jan-2009 Jan-2010 Jan-2011 Jan-2012 Jan-2013
Historical Median Sales Price Single-Family Condominium
+5.5%+6.7%-0.5%
Single-Family Condominium
+6.6%+4.5%0.0%+7.8% +7.6%
Housing Affordability Index
Single-Family
YoY
Change
Condominium
YoY
Change
Jul-2012 102 + 13.9% 131 + 9.5%
Aug-2012 105 + 14.0% 133 + 9.0%
Sep-2012 121 + 17.2% 137 + 10.4%
Oct-2012 120 + 3.2% 139 + 7.3%
Nov-2012 117 + 6.7% 135 + 4.6%
Dec-2012 113 + 6.8% 136 + 3.6%
Jan-2013 125 + 3.7% 141 + 4.2%
Feb-2013 122 - 2.0% 146 + 11.1%
Mar-2013 121 + 3.4% 128 - 8.9%
Apr-2013 112 - 5.0% 135 + 2.6%
May-2013 104 - 5.0% 124 - 5.0%
Jun-2013 90 - 11.5% 114 - 9.6%
This index measures housing affordability for the region. An index of 120 means the median household income was 120% of what is necessary
to qualify for the median-priced home under prevailing interest rates. A higher number means greater affordability.
89
117
102
126
90
114
June
98
122
112
133
100
119
Year to Date
20132012 20132012 20132012 201320122011 2011 2011 2011
Average 113 +3.8% 133 +3.2%
All data from MLS Property Information Network, Inc. Provided by the Greater Boston Association of REALTORS® and the Massachusetts Association of REALTORS®. Powered by 10K Research and Marketing. | Click for Cover Page | 6
Single-Family Condominium
60
70
80
90
100
110
120
130
140
150
160
Jan-2004 Jan-2005 Jan-2006 Jan-2007 Jan-2008 Jan-2009 Jan-2010 Jan-2011 Jan-2012 Jan-2013
Historical Housing Affordability Index Single-Family Condominium
-9.6%+7.4%+14.6%
Single-Family Condominium
-10.3%+9.2%+13.9%-11.5% -11.2%
Inventory of Homes for Sale
The number of properties available for sale in active status at the end of a given month.
Single-Family
YoY
Change
Condominium
YoY
Change
Jul-2012 3,985 - 23.6% 2,846 - 37.2%
Aug-2012 3,747 - 25.8% 2,534 - 38.1%
Sep-2012 3,920 - 26.2% 2,632 - 37.0%
Oct-2012 3,637 - 28.3% 2,428 - 38.6%
Nov-2012 3,120 - 27.9% 2,095 - 39.5%
Dec-2012 2,396 - 31.4% 1,605 - 41.4%
Jan-2013 2,381 - 31.3% 1,656 - 41.5%
Feb-2013 2,490 - 33.4% 1,766 - 41.2%
Mar-2013 2,428 - 42.1% 1,782 - 47.3%
Apr-2013 2,769 - 37.7% 2,005 - 41.2%
May-2013 2,955 - 35.3% 2,008 - 39.3%
Jun-2013 2,786 - 35.4% 1,847 - 40.1%
5,289
4,862
4,316
3,086
2,786
1,847
June
20132012 201320122011 2011
Average 3,051 - 31.2% 2,100 - 40.0%
All data from MLS Property Information Network, Inc. Provided by the Greater Boston Association of REALTORS® and the Massachusetts Association of REALTORS®. Powered by 10K Research and Marketing. | Click for Cover Page | 7
Single-Family Condominium
1,000
2,000
3,000
4,000
5,000
6,000
7,000
8,000
9,000
Jan-2003 Jan-2004 Jan-2005 Jan-2006 Jan-2007 Jan-2008 Jan-2009 Jan-2010 Jan-2011 Jan-2012 Jan-2013
Historical Inventory of Homes for Sale Single-Family Condominium
-40.1%-36.5%-18.4% -35.4%
Months Supply of Inventory
The inventory of homes for sale at the end of a given month, divided by the average monthly pending sales from the last 12 months.
Single-Family
YoY
Change
Condominium
YoY
Change
Jul-2012 3.1 - 39.0% 2.7 - 48.5%
Aug-2012 2.9 - 41.2% 2.1 - 50.6%
Sep-2012 5.1 - 25.3% 3.5 - 45.9%
Oct-2012 4.6 - 44.3% 3.4 - 55.8%
Nov-2012 3.4 - 45.6% 2.8 - 55.2%
Dec-2012 2.9 - 38.7% 2.1 - 51.0%
Jan-2013 3.9 - 40.6% 3.2 - 53.1%
Feb-2013 5.8 - 28.2% 4.1 - 48.0%
Mar-2013 3.8 - 40.5% 2.8 - 49.1%
Apr-2013 3.6 - 40.5% 2.5 - 44.7%
May-2013 2.7 - 41.7% 1.9 - 42.4%
Jun-2013 1.9 - 33.6% 1.5 - 37.7%
4.2
4.6
2.9
2.4
1.9
1.5
June
20132012 201320122011 2011
Average 3.5 - 41.0% 2.7 - 49.5%
All data from MLS Property Information Network, Inc. Provided by the Greater Boston Association of REALTORS® and the Massachusetts Association of REALTORS®. Powered by 10K Research and Marketing. | Click for Cover Page | 8
Single-Family Condominium
0
2
4
6
8
10
12
14
16
Jan-2004 Jan-2005 Jan-2006 Jan-2007 Jan-2008 Jan-2009 Jan-2010 Jan-2011 Jan-2012 Jan-2013
Historical Months Supply of Inventory Single-Family Condominium
-37.7%-47.2%-32.8% -33.6%
Days on Market Until Sale
Average number of days between when a property is listed and when an offer is accepted in a given month.
Single-Family
YoY
Change
Condominium
YoY
Change
Jul-2012 80 - 3.9% 71 - 20.6%
Aug-2012 87 - 5.7% 76 - 18.2%
Sep-2012 89 - 12.0% 85 - 18.1%
Oct-2012 90 - 17.4% 84 - 11.5%
Nov-2012 89 - 17.9% 77 - 29.9%
Dec-2012 97 - 12.4% 84 - 30.1%
Jan-2013 109 - 16.5% 88 - 29.6%
Feb-2013 111 - 17.2% 95 - 22.6%
Mar-2013 108 - 17.5% 72 - 39.0%
Apr-2013 94 - 22.1% 63 - 35.1%
May-2013 75 - 22.0% 51 - 40.4%
Jun-2013 56 - 37.2% 42 - 43.6%
90
94
90
75
56
42
June
110 111110
96
84
62
Year to Date
20132012 20132012 20132012 201320122011 2011 2011 2011
Total 86 - 17.6% 66 - 26.7%
All data from MLS Property Information Network, Inc. Provided by the Greater Boston Association of REALTORS® and the Massachusetts Association of REALTORS®. Powered by 10K Research and Marketing. | Click for Cover Page | 9
Single-Family Condominium
40
60
80
100
120
140
160
Jan-2003 Jan-2004 Jan-2005 Jan-2006 Jan-2007 Jan-2008 Jan-2009 Jan-2010 Jan-2011 Jan-2012 Jan-2013
Historical Days on Market Until Sale Single-Family Condominium
-43.6%-20.4%-0.1%
Single-Family Condominium
-35.5%-13.4%-0.0%-37.2% -23.6%
Percent of Original List Price Received
Single-Family
YoY
Change
Condominium
YoY
Change
Jul-2012 95.8% + 1.6% 96.6% + 1.7%
Aug-2012 94.8% + 1.5% 96.3% + 2.2%
Sep-2012 94.6% + 1.5% 96.4% + 2.3%
Oct-2012 94.3% + 2.8% 95.9% + 2.4%
Nov-2012 94.6% + 2.4% 96.2% + 2.5%
Dec-2012 94.2% + 2.2% 96.2% + 3.4%
Jan-2013 93.8% + 3.6% 95.9% + 3.2%
Feb-2013 94.1% + 3.2% 96.7% + 3.5%
Mar-2013 95.2% + 2.4% 97.6% + 3.8%
Apr-2013 96.7% + 3.4% 98.8% + 3.3%
May-2013 97.8% + 2.6% 99.4% + 3.5%
Jun-2013 98.3% + 3.2% 99.7% + 3.5%
Percentage found when dividing a property’s sales price by its original list price, then taking the average for all properties sold in a given month,
not accounting for seller concessions.
94.6% 94.7%95.3% 96.3%98.3% 99.7%
June
93.2% 93.9%93.8% 95.3%96.7% 98.5%
Year to Date
20132012 20132012 20132012 201320122011 2011 2011 2011
Average 95.7% + 2.4% 97.3% + 2.8%
All data from MLS Property Information Network, Inc. Provided by the Greater Boston Association of REALTORS® and the Massachusetts Association of REALTORS®. Powered by 10K Research and Marketing. | Click for Cover Page | 10
Single-Family Condominium
89%
91%
93%
95%
97%
99%
101%
Jan-2003 Jan-2004 Jan-2005 Jan-2006 Jan-2007 Jan-2008 Jan-2009 Jan-2010 Jan-2011 Jan-2012 Jan-2013
Historical Percent of Original List Price Received Single-Family Condominium
+3.5%+1.8%+0.8%
Single-Family Condominium
+3.4%+1.5%+0.7%+3.2% +3.0%
Pending Sales
A count of the properties in UAG status between the first and last day in a given month, regardless of current status (based on Off Market Date).
Single-Family
YoY
Change
Condominium
YoY
Change
Jul-2012 952 + 25.6% 810 + 14.6%
Aug-2012 790 + 11.6% 734 + 19.9%
Sep-2012 874 + 28.7% 743 + 38.1%
Oct-2012 885 + 19.3% 795 + 34.5%
Nov-2012 697 + 13.5% 608 + 10.3%
Dec-2012 517 + 9.3% 463 + 11.6%
Jan-2013 639 + 4.4% 666 + 20.4%
Feb-2013 720 - 5.3% 722 - 3.5%
Mar-2013 1,206 + 4.5% 1,184 + 10.9%
Apr-2013 1,433 + 15.5% 1,294 + 10.6%
May-2013 1,556 + 19.9% 1,314 + 11.3%
Jun-2013 1,377 + 15.5% 1,158 + 15.7%
1,040
840
1,192
1,001
1,377
1,158
June
5,131
4,546
6,257
5,721
6,931
6,338
Year to Date
20132012 20132012 20132012 201320122011 2011 2011 2011
Total 11,646 + 13.8% 10,491 + 14.8%
All data from MLS Property Information Network, Inc. Provided by the Greater Boston Association of REALTORS® and the Massachusetts Association of REALTORS®. Powered by 10K Research and Marketing. | Click for Cover Page | 11
Single-Family Condominium
200
400
600
800
1,000
1,200
1,400
1,600
1,800
2,000
2,200
Jan-2003 Jan-2004 Jan-2005 Jan-2006 Jan-2007 Jan-2008 Jan-2009 Jan-2010 Jan-2011 Jan-2012 Jan-2013
Historical Pending Sales Activity Single-Family Condominium
+15.7%+19.2%+14.6%
Single-Family Condominium
+10.8%+25.8%+21.9%+15.5% +10.8%
New Listings
A count of the properties that have been newly listed on the market in a given month.
Single-Family
YoY
Change
Condominium
YoY
Change
Jul-2012 1,022 - 12.5% 903 - 7.5%
Aug-2012 1,001 - 8.7% 790 - 7.5%
Sep-2012 1,419 - 10.2% 1,153 - 9.6%
Oct-2012 1,079 - 4.5% 881 - 2.1%
Nov-2012 649 - 3.3% 561 - 10.4%
Dec-2012 366 - 19.0% 319 - 17.8%
Jan-2013 903 - 6.2% 916 - 4.0%
Feb-2013 1,029 - 22.0% 966 - 15.3%
Mar-2013 1,395 - 30.5% 1,367 - 21.5%
Apr-2013 2,052 + 14.1% 1,696 + 13.1%
May-2013 2,043 + 14.6% 1,546 + 11.5%
Jun-2013 1,544 + 14.2% 1,250 + 8.5%
1,596
1,3421,352
1,152
1,544
1,250
June
9,096
8,592
9,223
7,874
8,966
7,741
Year to Date
20132012 20132012 20132012 201320122011 2011 2011 2011
Total 14,502 - 5.3% 12,348 - 4.2%
All data from MLS Property Information Network, Inc. Provided by the Greater Boston Association of REALTORS® and the Massachusetts Association of REALTORS®. Powered by 10K Research and Marketing. | Click for Cover Page | 12
Single-Family Condominium
0
250
500
750
1,000
1,250
1,500
1,750
2,000
2,250
2,500
2,750
Jan-2003 Jan-2004 Jan-2005 Jan-2006 Jan-2007 Jan-2008 Jan-2009 Jan-2010 Jan-2011 Jan-2012 Jan-2013
Historical New Listing Activity Single-Family Condominium
+8.5%-14.2%-15.3%
Single-Family Condominium
-1.7%-8.4%+1.4%+14.2% -2.8%
City of Boston – Market Overview
Key market metrics for the current month and year-to-date figures for the City of Boston.
Key Metrics Historical Sparklines Jun-2012 Jun-2013 + / – YTD 2012 YTD 2013 + / –
- 1.6%
Median Sales Price $428,000 $447,000 + 4.4% $400,500 $430,000 + 7.4%
Closed Sales 706 643 - 8.9% 2,533 2,493
- 11.2%
Inventory of Homes for Sale 1,623 981 - 39.6% -- -- --
Housing Affordability Index 102 90 - 11.5% 112 100
6-2010 6-2011 6-2012 6-2013
6-2010 6-2011 6-2012 6-2013
6-2010 6-2011 6-2012 6-2013
6-2010 6-2011 6-2012 6-2013
--
Days on Market Until Sale 75 36 - 52.5% 94 53 - 43.4%
Months Supply of Inventory 2.3 1.5 - 33.6% -- --
+ 3.4%
Pending Sales 586 648 + 10.6% 3,247 3,474 + 7.0%
Percent of Original
List Price Received
96.1% 99.4% + 3.5% 95.1% 98.4%
- 3.6%
All data from MLS Property Information Network, Inc. Provided by the Greater Boston Association of REALTORS® and the Massachusetts Association of REALTORS®. Powered by 10K Research and Marketing. | Click for Cover Page | 13
New Listings 644 701 + 8.9% 4,496 4,336
6 2010 6 2011 6 2012 6 2013
6-2010 6-2011 6-2012 6-2013
6-2010 6-2011 6-2012 6-2013
6-2010 6-2011 6-2012 6-2013
6-2010 6-2011 6-2012 6-2013
6-2010 6-2011 6-2012 6-2013

More Related Content

What's hot

October 2014 Greater Boston Real Estate Market Trends Report
October 2014 Greater Boston Real Estate Market Trends ReportOctober 2014 Greater Boston Real Estate Market Trends Report
October 2014 Greater Boston Real Estate Market Trends Report
Unit Realty Group
 

What's hot (20)

November 2014 Greater Boston Real Estate Market Trends Report
November 2014 Greater Boston Real Estate Market Trends ReportNovember 2014 Greater Boston Real Estate Market Trends Report
November 2014 Greater Boston Real Estate Market Trends Report
 
San Francisco Market Focus May 2013
San Francisco Market Focus May 2013San Francisco Market Focus May 2013
San Francisco Market Focus May 2013
 
San Francisco Market Focus June 2014
San Francisco Market Focus June 2014San Francisco Market Focus June 2014
San Francisco Market Focus June 2014
 
October 2014 Greater Boston Real Estate Market Trends Report
October 2014 Greater Boston Real Estate Market Trends ReportOctober 2014 Greater Boston Real Estate Market Trends Report
October 2014 Greater Boston Real Estate Market Trends Report
 
San Francisco Market Focus December 2013
San Francisco Market Focus December 2013San Francisco Market Focus December 2013
San Francisco Market Focus December 2013
 
Greater Boston Association of Realtors January 2017 Monthly Indicators Report
Greater Boston Association of Realtors January 2017 Monthly Indicators ReportGreater Boston Association of Realtors January 2017 Monthly Indicators Report
Greater Boston Association of Realtors January 2017 Monthly Indicators Report
 
San francisco residential apr 2011 apr 2013
San francisco residential apr 2011   apr 2013San francisco residential apr 2011   apr 2013
San francisco residential apr 2011 apr 2013
 
December 2016 Greater Boston Real Estate Market Trends
December 2016 Greater Boston Real Estate Market TrendsDecember 2016 Greater Boston Real Estate Market Trends
December 2016 Greater Boston Real Estate Market Trends
 
January 2014 Greater Boston Real Estate Market Trends Report
January 2014 Greater Boston Real Estate Market Trends ReportJanuary 2014 Greater Boston Real Estate Market Trends Report
January 2014 Greater Boston Real Estate Market Trends Report
 
August 2013 Housing Sales Statistics
August 2013 Housing Sales StatisticsAugust 2013 Housing Sales Statistics
August 2013 Housing Sales Statistics
 
GBAR Monthly Housing Market Data November 2016
GBAR Monthly Housing Market Data November 2016GBAR Monthly Housing Market Data November 2016
GBAR Monthly Housing Market Data November 2016
 
San Francisco Market Focus Sept 2017
San Francisco Market Focus Sept 2017San Francisco Market Focus Sept 2017
San Francisco Market Focus Sept 2017
 
2014 Market Forecast - California Association of Realtors
2014 Market Forecast - California Association of Realtors2014 Market Forecast - California Association of Realtors
2014 Market Forecast - California Association of Realtors
 
San Francisco Market Focus July 2013
San Francisco Market Focus July 2013San Francisco Market Focus July 2013
San Francisco Market Focus July 2013
 
2013 Annual Historical Data
2013 Annual Historical Data2013 Annual Historical Data
2013 Annual Historical Data
 
San Francisco Market Focus Jan 2014
San Francisco Market Focus Jan 2014 San Francisco Market Focus Jan 2014
San Francisco Market Focus Jan 2014
 
San Francisco Market Focus May 2017
San Francisco Market Focus May 2017San Francisco Market Focus May 2017
San Francisco Market Focus May 2017
 
San Francisco Market Focus April 2017
San Francisco Market Focus April 2017San Francisco Market Focus April 2017
San Francisco Market Focus April 2017
 
San Francisco Market Focus June 2017
San Francisco Market Focus June 2017San Francisco Market Focus June 2017
San Francisco Market Focus June 2017
 
Greater Boston Association of Realtors Monthly Housing Data: October 2016
Greater Boston Association of Realtors Monthly Housing Data: October 2016Greater Boston Association of Realtors Monthly Housing Data: October 2016
Greater Boston Association of Realtors Monthly Housing Data: October 2016
 

Viewers also liked

Feudalism
FeudalismFeudalism
Feudalism
wh10063
 
Slides Familiekursus formidlingskonference
Slides Familiekursus formidlingskonferenceSlides Familiekursus formidlingskonference
Slides Familiekursus formidlingskonference
Kristine Nygaard
 
Just us file
Just us fileJust us file
Just us file
sunny_300
 
Online presentation
Online presentationOnline presentation
Online presentation
M10p3309
 

Viewers also liked (15)

September 2014 Multi-family Housing Activity Report – Boston, MA Real Estate
September 2014 Multi-family Housing Activity Report – Boston, MA Real EstateSeptember 2014 Multi-family Housing Activity Report – Boston, MA Real Estate
September 2014 Multi-family Housing Activity Report – Boston, MA Real Estate
 
April 2013 Monthly Multi-family Housing Activity Report – Boston Real Estate
April 2013 Monthly Multi-family Housing Activity Report – Boston Real Estate April 2013 Monthly Multi-family Housing Activity Report – Boston Real Estate
April 2013 Monthly Multi-family Housing Activity Report – Boston Real Estate
 
Feudalism
FeudalismFeudalism
Feudalism
 
Slides Familiekursus formidlingskonference
Slides Familiekursus formidlingskonferenceSlides Familiekursus formidlingskonference
Slides Familiekursus formidlingskonference
 
Multi-Family Housing Activity Report, September 2012
Multi-Family Housing Activity Report, September 2012Multi-Family Housing Activity Report, September 2012
Multi-Family Housing Activity Report, September 2012
 
Just us file
Just us fileJust us file
Just us file
 
June 2013 Multifamily Housing Activity Report – Boston, MA Real Estate
June 2013 Multifamily Housing Activity Report – Boston, MA Real EstateJune 2013 Multifamily Housing Activity Report – Boston, MA Real Estate
June 2013 Multifamily Housing Activity Report – Boston, MA Real Estate
 
Feudalism
FeudalismFeudalism
Feudalism
 
September 2013 Multifamily Housing Activity Report – Boston, MA Real Estate
September 2013 Multifamily Housing Activity Report – Boston, MA Real EstateSeptember 2013 Multifamily Housing Activity Report – Boston, MA Real Estate
September 2013 Multifamily Housing Activity Report – Boston, MA Real Estate
 
Greater Boston Real Estate Market Data, September 2012
Greater Boston Real Estate Market Data, September 2012Greater Boston Real Estate Market Data, September 2012
Greater Boston Real Estate Market Data, September 2012
 
Building meeting design foundation at EIBTM Barcelona 2013
Building meeting design foundation at EIBTM Barcelona 2013Building meeting design foundation at EIBTM Barcelona 2013
Building meeting design foundation at EIBTM Barcelona 2013
 
August 2013 Multifamily Housing Activity Report – Boston, MA Real Estate
August 2013 Multifamily Housing Activity Report – Boston, MA Real EstateAugust 2013 Multifamily Housing Activity Report – Boston, MA Real Estate
August 2013 Multifamily Housing Activity Report – Boston, MA Real Estate
 
Biofuel and keystone oil pipeline
Biofuel and keystone oil pipelineBiofuel and keystone oil pipeline
Biofuel and keystone oil pipeline
 
January 2013's Monthly Indicators report
January 2013's Monthly Indicators reportJanuary 2013's Monthly Indicators report
January 2013's Monthly Indicators report
 
Online presentation
Online presentationOnline presentation
Online presentation
 

Similar to June 2013's Monthly Indicators report - Boston Real Estate Market Trends

Apr13 abormarketreport
Apr13 abormarketreportApr13 abormarketreport
Apr13 abormarketreport
austinhometeam
 
San Francisco Real Estate Market Report August 2014
San Francisco Real Estate Market Report August 2014San Francisco Real Estate Market Report August 2014
San Francisco Real Estate Market Report August 2014
Ronny Budiutama
 
San Francisco Market Focus November 2013
San Francisco Market Focus November 2013San Francisco Market Focus November 2013
San Francisco Market Focus November 2013
Ronny Budiutama
 

Similar to June 2013's Monthly Indicators report - Boston Real Estate Market Trends (20)

December 2014 Greater Boston Real Estate Market Trends Report
December 2014 Greater Boston Real Estate Market Trends ReportDecember 2014 Greater Boston Real Estate Market Trends Report
December 2014 Greater Boston Real Estate Market Trends Report
 
Apr13 abormarketreport
Apr13 abormarketreportApr13 abormarketreport
Apr13 abormarketreport
 
San Francisco Real Estate Market Report August 2014
San Francisco Real Estate Market Report August 2014San Francisco Real Estate Market Report August 2014
San Francisco Real Estate Market Report August 2014
 
San Francisco Market Focus November 2013
San Francisco Market Focus November 2013San Francisco Market Focus November 2013
San Francisco Market Focus November 2013
 
San Francisco Market Focus July 2015
San Francisco Market Focus July 2015San Francisco Market Focus July 2015
San Francisco Market Focus July 2015
 
October 2015 Greater Boston Real Estate Market Trends Report
October 2015 Greater Boston Real Estate Market Trends ReportOctober 2015 Greater Boston Real Estate Market Trends Report
October 2015 Greater Boston Real Estate Market Trends Report
 
September 2015 Greater Boston Real Estate Market Trends Report
September 2015 Greater Boston Real Estate Market Trends ReportSeptember 2015 Greater Boston Real Estate Market Trends Report
September 2015 Greater Boston Real Estate Market Trends Report
 
Austin Real Estate Market Report May 2013
Austin Real Estate Market Report May 2013 Austin Real Estate Market Report May 2013
Austin Real Estate Market Report May 2013
 
January 2015 Greater Boston Real Estate Market Trends Report
January 2015 Greater Boston Real Estate Market Trends ReportJanuary 2015 Greater Boston Real Estate Market Trends Report
January 2015 Greater Boston Real Estate Market Trends Report
 
The Georgia Association Of Realtors Monthly Indicators For April 2014
The Georgia Association Of Realtors Monthly Indicators For April 2014The Georgia Association Of Realtors Monthly Indicators For April 2014
The Georgia Association Of Realtors Monthly Indicators For April 2014
 
May 2013 Housing Sales Statistics
May 2013 Housing Sales StatisticsMay 2013 Housing Sales Statistics
May 2013 Housing Sales Statistics
 
August 2015 Greater Boston Real Estate Market Trends Report
August 2015 Greater Boston Real Estate Market Trends ReportAugust 2015 Greater Boston Real Estate Market Trends Report
August 2015 Greater Boston Real Estate Market Trends Report
 
San Francisco Market Focus October 2014
San Francisco Market Focus October 2014San Francisco Market Focus October 2014
San Francisco Market Focus October 2014
 
San Francisco Market Focus July 2014
San Francisco Market Focus July 2014San Francisco Market Focus July 2014
San Francisco Market Focus July 2014
 
San Francisco Market Focus September 2013
San Francisco Market Focus September 2013San Francisco Market Focus September 2013
San Francisco Market Focus September 2013
 
San Francisco Market Report September 2021
San Francisco Market Report September 2021San Francisco Market Report September 2021
San Francisco Market Report September 2021
 
San Francisco Market Focus April 2015
San Francisco Market Focus April 2015San Francisco Market Focus April 2015
San Francisco Market Focus April 2015
 
February 2015 Greater Boston Real Estate Market Trends Report
February 2015 Greater Boston Real Estate Market Trends ReportFebruary 2015 Greater Boston Real Estate Market Trends Report
February 2015 Greater Boston Real Estate Market Trends Report
 
San Francisco Market Focus June 2015
San Francisco Market Focus June 2015San Francisco Market Focus June 2015
San Francisco Market Focus June 2015
 
San Francisco Market Focus October 2013
San Francisco Market Focus October 2013San Francisco Market Focus October 2013
San Francisco Market Focus October 2013
 

More from Unit Realty Group

January 2015′s Monthly Multi-family Housing Activity Report
January 2015′s Monthly Multi-family Housing Activity ReportJanuary 2015′s Monthly Multi-family Housing Activity Report
January 2015′s Monthly Multi-family Housing Activity Report
Unit Realty Group
 
November 2014 Multi-family Housing Activity Report – Boston, MA Real Estate
November 2014 Multi-family Housing Activity Report – Boston, MA Real EstateNovember 2014 Multi-family Housing Activity Report – Boston, MA Real Estate
November 2014 Multi-family Housing Activity Report – Boston, MA Real Estate
Unit Realty Group
 

More from Unit Realty Group (12)

December 2015 multi family housing activity report – boston, ma real estate
December 2015 multi family housing activity report – boston, ma real estateDecember 2015 multi family housing activity report – boston, ma real estate
December 2015 multi family housing activity report – boston, ma real estate
 
January 2015′s Monthly Multi-family Housing Activity Report
January 2015′s Monthly Multi-family Housing Activity ReportJanuary 2015′s Monthly Multi-family Housing Activity Report
January 2015′s Monthly Multi-family Housing Activity Report
 
November 2014 Multi-family Housing Activity Report – Boston, MA Real Estate
November 2014 Multi-family Housing Activity Report – Boston, MA Real EstateNovember 2014 Multi-family Housing Activity Report – Boston, MA Real Estate
November 2014 Multi-family Housing Activity Report – Boston, MA Real Estate
 
Boston By The Numbers - Boston Housing Stock (Report)
Boston By The Numbers - Boston Housing Stock (Report)Boston By The Numbers - Boston Housing Stock (Report)
Boston By The Numbers - Boston Housing Stock (Report)
 
May 2014 Multi-family Housing Activity Report – Boston, MA Real Estate
May 2014 Multi-family Housing Activity Report – Boston, MA Real EstateMay 2014 Multi-family Housing Activity Report – Boston, MA Real Estate
May 2014 Multi-family Housing Activity Report – Boston, MA Real Estate
 
November 2013 Multi-family Housing Activity Report – Boston, MA Real Estate
November 2013 Multi-family Housing Activity Report – Boston, MA Real EstateNovember 2013 Multi-family Housing Activity Report – Boston, MA Real Estate
November 2013 Multi-family Housing Activity Report – Boston, MA Real Estate
 
October 2013 Multi-family Housing Activity Report – Boston, MA Real Estate
October 2013 Multi-family Housing Activity Report – Boston, MA Real EstateOctober 2013 Multi-family Housing Activity Report – Boston, MA Real Estate
October 2013 Multi-family Housing Activity Report – Boston, MA Real Estate
 
July 2013 Multifamily Housing Activity Report – Boston, MA Real Estate
July 2013 Multifamily Housing Activity Report – Boston, MA Real EstateJuly 2013 Multifamily Housing Activity Report – Boston, MA Real Estate
July 2013 Multifamily Housing Activity Report – Boston, MA Real Estate
 
May 2013's Monthly Indicators report - Boston Real Estate Market Trends
May 2013's Monthly Indicators report - Boston Real Estate Market Trends May 2013's Monthly Indicators report - Boston Real Estate Market Trends
May 2013's Monthly Indicators report - Boston Real Estate Market Trends
 
March 2013 Monthly Multi-family Housing Activity Report - Boston Real Estate
March 2013 Monthly Multi-family Housing Activity Report - Boston Real Estate March 2013 Monthly Multi-family Housing Activity Report - Boston Real Estate
March 2013 Monthly Multi-family Housing Activity Report - Boston Real Estate
 
February 2013 Monthly Multi-family Housing Activity Report - Boston Real Estate
February 2013 Monthly Multi-family Housing Activity Report - Boston Real EstateFebruary 2013 Monthly Multi-family Housing Activity Report - Boston Real Estate
February 2013 Monthly Multi-family Housing Activity Report - Boston Real Estate
 
February 2013's Monthly Indicators report - Boston Real Estate Market Trends
February 2013's Monthly Indicators report - Boston Real Estate Market TrendsFebruary 2013's Monthly Indicators report - Boston Real Estate Market Trends
February 2013's Monthly Indicators report - Boston Real Estate Market Trends
 

Recently uploaded

Bptp The Amaario Launch Luxury Project Sector 37D Gurgaon Dwarka Expressway...
Bptp The Amaario Launch  Luxury Project  Sector 37D Gurgaon Dwarka Expressway...Bptp The Amaario Launch  Luxury Project  Sector 37D Gurgaon Dwarka Expressway...
Bptp The Amaario Launch Luxury Project Sector 37D Gurgaon Dwarka Expressway...
ApartmentWala1
 
9990771857 Call Girls in Dwarka Sector 3 Delhi (Call Girls) Delhi
9990771857 Call Girls in Dwarka Sector 3 Delhi (Call Girls) Delhi9990771857 Call Girls in Dwarka Sector 3 Delhi (Call Girls) Delhi
9990771857 Call Girls in Dwarka Sector 3 Delhi (Call Girls) Delhi
delhimodel235
 
Call Girls in Karkardooma Delhi +91 84487779280}Woman Seeking Man in Delhi NCR
Call Girls in Karkardooma Delhi +91 84487779280}Woman Seeking Man in Delhi NCRCall Girls in Karkardooma Delhi +91 84487779280}Woman Seeking Man in Delhi NCR
Call Girls in Karkardooma Delhi +91 84487779280}Woman Seeking Man in Delhi NCR
asmaqueen5
 
Cheap Rate ✨➥9711108085▻✨Call Girls In Malviya Nagar(Delhi)
Cheap Rate ✨➥9711108085▻✨Call Girls In Malviya Nagar(Delhi)Cheap Rate ✨➥9711108085▻✨Call Girls In Malviya Nagar(Delhi)
Cheap Rate ✨➥9711108085▻✨Call Girls In Malviya Nagar(Delhi)
delhi24hrs1
 
9990771857 Call Girls in Dwarka Sector 6 Delhi (Call Girls) Delhi
9990771857 Call Girls in Dwarka Sector 6 Delhi (Call Girls) Delhi9990771857 Call Girls in Dwarka Sector 6 Delhi (Call Girls) Delhi
9990771857 Call Girls in Dwarka Sector 6 Delhi (Call Girls) Delhi
delhimodel235
 
9990771857 Call Girls Dwarka Sector 9 Delhi (Call Girls ) Delhi
9990771857 Call Girls Dwarka Sector 9 Delhi (Call Girls ) Delhi9990771857 Call Girls Dwarka Sector 9 Delhi (Call Girls ) Delhi
9990771857 Call Girls Dwarka Sector 9 Delhi (Call Girls ) Delhi
delhimodel235
 
9990771857 Call Girls in Dwarka Sector 6 Delhi (Call Girls) Delhi
9990771857 Call Girls in Dwarka Sector 6 Delhi (Call Girls) Delhi9990771857 Call Girls in Dwarka Sector 6 Delhi (Call Girls) Delhi
9990771857 Call Girls in Dwarka Sector 6 Delhi (Call Girls) Delhi
delhimodel235
 
9990771857 Call Girls in Dwarka Sector 137 Noida (Call Girls) Delhi
9990771857 Call Girls in Dwarka Sector 137 Noida (Call Girls) Delhi9990771857 Call Girls in Dwarka Sector 137 Noida (Call Girls) Delhi
9990771857 Call Girls in Dwarka Sector 137 Noida (Call Girls) Delhi
delhimodel235
 

Recently uploaded (20)

Bptp The Amaario Launch Luxury Project Sector 37D Gurgaon Dwarka Expressway...
Bptp The Amaario Launch  Luxury Project  Sector 37D Gurgaon Dwarka Expressway...Bptp The Amaario Launch  Luxury Project  Sector 37D Gurgaon Dwarka Expressway...
Bptp The Amaario Launch Luxury Project Sector 37D Gurgaon Dwarka Expressway...
 
9990771857 Call Girls in Dwarka Sector 3 Delhi (Call Girls) Delhi
9990771857 Call Girls in Dwarka Sector 3 Delhi (Call Girls) Delhi9990771857 Call Girls in Dwarka Sector 3 Delhi (Call Girls) Delhi
9990771857 Call Girls in Dwarka Sector 3 Delhi (Call Girls) Delhi
 
Call Girls in Karkardooma Delhi +91 84487779280}Woman Seeking Man in Delhi NCR
Call Girls in Karkardooma Delhi +91 84487779280}Woman Seeking Man in Delhi NCRCall Girls in Karkardooma Delhi +91 84487779280}Woman Seeking Man in Delhi NCR
Call Girls in Karkardooma Delhi +91 84487779280}Woman Seeking Man in Delhi NCR
 
SVN Live 5.6.24 Weekly Property Broadcast
SVN Live 5.6.24 Weekly Property BroadcastSVN Live 5.6.24 Weekly Property Broadcast
SVN Live 5.6.24 Weekly Property Broadcast
 
Purva Soukhyam in Guduvancheri Chennai.pdf
Purva Soukhyam in Guduvancheri Chennai.pdfPurva Soukhyam in Guduvancheri Chennai.pdf
Purva Soukhyam in Guduvancheri Chennai.pdf
 
Parksville 96 Surrey Floor Plans May 2024
Parksville 96 Surrey Floor Plans May 2024Parksville 96 Surrey Floor Plans May 2024
Parksville 96 Surrey Floor Plans May 2024
 
Eldeco Dwarka Project In Delhi-brochure.pdf.pdf
Eldeco Dwarka Project In Delhi-brochure.pdf.pdfEldeco Dwarka Project In Delhi-brochure.pdf.pdf
Eldeco Dwarka Project In Delhi-brochure.pdf.pdf
 
Kohinoor Hinjewadi Phase 2 Pune E-Brochure.pdf
Kohinoor Hinjewadi Phase 2 Pune  E-Brochure.pdfKohinoor Hinjewadi Phase 2 Pune  E-Brochure.pdf
Kohinoor Hinjewadi Phase 2 Pune E-Brochure.pdf
 
Cheap Rate ✨➥9711108085▻✨Call Girls In Malviya Nagar(Delhi)
Cheap Rate ✨➥9711108085▻✨Call Girls In Malviya Nagar(Delhi)Cheap Rate ✨➥9711108085▻✨Call Girls In Malviya Nagar(Delhi)
Cheap Rate ✨➥9711108085▻✨Call Girls In Malviya Nagar(Delhi)
 
Kolte Patil Kharadi Pune E Brochure.pdf
Kolte Patil Kharadi Pune E  Brochure.pdfKolte Patil Kharadi Pune E  Brochure.pdf
Kolte Patil Kharadi Pune E Brochure.pdf
 
The Gale at Godrej Park World Hinjewadi Pune Brochure.pdf
The Gale at Godrej Park World Hinjewadi Pune Brochure.pdfThe Gale at Godrej Park World Hinjewadi Pune Brochure.pdf
The Gale at Godrej Park World Hinjewadi Pune Brochure.pdf
 
9990771857 Call Girls in Dwarka Sector 6 Delhi (Call Girls) Delhi
9990771857 Call Girls in Dwarka Sector 6 Delhi (Call Girls) Delhi9990771857 Call Girls in Dwarka Sector 6 Delhi (Call Girls) Delhi
9990771857 Call Girls in Dwarka Sector 6 Delhi (Call Girls) Delhi
 
David Litt Foreclosure Specialist - Your Partner in Real Estate Success
David Litt Foreclosure Specialist - Your Partner in Real Estate SuccessDavid Litt Foreclosure Specialist - Your Partner in Real Estate Success
David Litt Foreclosure Specialist - Your Partner in Real Estate Success
 
9990771857 Call Girls Dwarka Sector 9 Delhi (Call Girls ) Delhi
9990771857 Call Girls Dwarka Sector 9 Delhi (Call Girls ) Delhi9990771857 Call Girls Dwarka Sector 9 Delhi (Call Girls ) Delhi
9990771857 Call Girls Dwarka Sector 9 Delhi (Call Girls ) Delhi
 
Retail Center For Sale - 1019 River St., Belleville, WI
Retail Center For Sale - 1019 River St., Belleville, WIRetail Center For Sale - 1019 River St., Belleville, WI
Retail Center For Sale - 1019 River St., Belleville, WI
 
2k Shot Call girls Karol Bagh Delhi 9205541914
2k Shot Call girls Karol Bagh Delhi 92055419142k Shot Call girls Karol Bagh Delhi 9205541914
2k Shot Call girls Karol Bagh Delhi 9205541914
 
9990771857 Call Girls in Dwarka Sector 6 Delhi (Call Girls) Delhi
9990771857 Call Girls in Dwarka Sector 6 Delhi (Call Girls) Delhi9990771857 Call Girls in Dwarka Sector 6 Delhi (Call Girls) Delhi
9990771857 Call Girls in Dwarka Sector 6 Delhi (Call Girls) Delhi
 
TENANT SCREENING REPORT SERVICES​ How Tenant Screening Reports Work
TENANT SCREENING REPORT SERVICES​ How Tenant Screening Reports WorkTENANT SCREENING REPORT SERVICES​ How Tenant Screening Reports Work
TENANT SCREENING REPORT SERVICES​ How Tenant Screening Reports Work
 
9990771857 Call Girls in Dwarka Sector 137 Noida (Call Girls) Delhi
9990771857 Call Girls in Dwarka Sector 137 Noida (Call Girls) Delhi9990771857 Call Girls in Dwarka Sector 137 Noida (Call Girls) Delhi
9990771857 Call Girls in Dwarka Sector 137 Noida (Call Girls) Delhi
 
Mahindra Happinest Tathawade Pune Brochure.pdf
Mahindra Happinest Tathawade Pune Brochure.pdfMahindra Happinest Tathawade Pune Brochure.pdf
Mahindra Happinest Tathawade Pune Brochure.pdf
 

June 2013's Monthly Indicators report - Boston Real Estate Market Trends

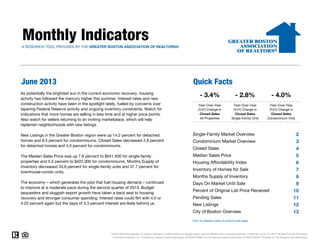
  • 1. Monthly IndicatorsA RESEARCH TOOL PROVIDED BY THE GREATER BOSTON ASSOCIATION OF REALTORS® June 2013 Quick Facts - 2.8% Year-Over-Year (YoY) Change in Closed Sales Single-Family Only As potentially the brightest sun in the current economic recovery, housing activity has followed the mercury higher this summer. Interest rates and new construction activity have been in the spotlight lately, fueled by concerns over tapering Federal Reserve activity and ongoing inventory constraints. Watch for indications that more homes are selling in less time and at higher price points. Also watch for sellers returning to an inviting marketplace, which will help replenish neighborhoods with new listings. - 4.0% Year-Over-Year (YoY) Change in Closed Sales Condominium Only - 3.4% Year-Over-Year (YoY) Change in Closed Sales All Properties 2 3 4 5 6 7 8 9 10 11 12 13 Data is refreshed regularly to capture changes in market activity so figures shown may be different than previously reported. Current as of July 16, 2013. All data from MLS Property Information Network, Inc. Provided by Greater Boston Association of REALTORS® and the Massachusetts Association of REALTORS®. Powered by 10K Research and Marketing. New Listings in the Greater Boston region were up 14.2 percent for detached homes and 8.5 percent for condominiums. Closed Sales decreased 2.8 percent for detached homes and 4.0 percent for condominiums. The Median Sales Price was up 7.8 percent to $541,500 for single-family properties and 5.5 percent to $422,000 for condominiums. Months Supply of Inventory decreased 33.6 percent for single-family units and 37.7 percent for townhouse-condo units. The economy – which generates the jobs that fuel housing demand – continued to improve at a moderate pace during the second quarter of 2013. Budget sequesters and sluggish export growth have taken a back seat to housing recovery and stronger consumer spending. Interest rates could flirt with 4.0 or 4.25 percent again but the days of 3.3 percent interest are likely behind us. Single-Family Market Overview Condominium Market Overview Closed Sales Median Sales Price Housing Affordability Index Inventory of Homes for Sale Click on desired metric to jump to that page. Months Supply of Inventory Days On Market Until Sale Percent of Original List Price Received City of Boston Overview Pending Sales New Listings
  • 2. Single-Family Market Overview Key market metrics for the current month and year-to-date figures for Single-Family Homes Only. Key Metrics Historical Sparklines Jun-2012 Jun-2013 + / – YTD 2012 YTD 2013 + / – Median Sales Price - 35.4% -- -- - 11.5% 112 100 - 11.2% -- Housing Affordability Index Inventory of Homes for Sale $502,500 + 7.6% 102 90 4,316 2,786 $541,500 + 7.8% $450,000 5,028 + 2.7%Closed Sales 1,511 1,468 - 2.8% 4,894 $484,000 6-2010 6-2011 6-2012 6-2013 6-2010 6-2011 6-2012 6-2013 6-2010 6-2011 6-2012 6-2013 6-2010 6-2011 6-2012 6-2013 93.8% 96.7% - 23.6% + 3.0% Percent of Original List Price Received Days on Market Until Sale 95.3% - 37.2% + 3.2% 56 98.3% Pending Sales + 10.8%6,9311,192 1,377 + 15.5% 6,257 Months Supply of Inventory 2.9 90 84 -- -- --1.9 - 33.6% 110 All data from MLS Property Information Network, Inc. Provided by the Greater Boston Association of REALTORS® and the Massachusetts Association of REALTORS®. Powered by 10K Research and Marketing. | Click for Cover Page | 2 New Listings 1,352 1,544 + 14.2% 9,223 8,966 - 2.8% 6 2010 6 2011 6 2012 6 2013 6-2010 6-2011 6-2012 6-2013 6-2010 6-2011 6-2012 6-2013 6-2010 6-2011 6-2012 6-2013 6-2010 6-2011 6-2012 6-2013 6-2010 6-2011 6-2012 6-2013
  • 3. Condominium Market Overview Key market metrics for the current month and year-to-date figures for Condominium Properties Only. Key Metrics Historical Sparklines Jun-2012 Jun-2013 + / – YTD 2012 YTD 2013 + / – + 5.1% Median Sales Price $400,000 $422,000 + 5.5% $375,000 $399,900 + 6.6% Closed Sales 1,264 1,214 - 4.0% 4,437 4,663 - 10.3% Inventory of Homes for Sale 3,086 1,847 - 40.1% -- -- -- Housing Affordability Index 126 114 - 9.6% 133 119 6-2010 6-2011 6-2012 6-2013 6-2010 6-2011 6-2012 6-2013 6-2010 6-2011 6-2012 6-2013 6-2010 6-2011 6-2012 6-2013 -- Days on Market Until Sale 75 42 - 43.6% 96 62 - 35.5% Months Supply of Inventory 2.4 1.5 - 37.7% -- -- + 3.4% Pending Sales 1,001 1,158 + 15.7% 5,721 6,338 + 10.8% Percent of Original List Price Received 96.3% 99.7% + 3.5% 95.3% 98.5% - 1.7% All data from MLS Property Information Network, Inc. Provided by the Greater Boston Association of REALTORS® and the Massachusetts Association of REALTORS®. Powered by 10K Research and Marketing. | Click for Cover Page | 3 New Listings 1,152 1,250 + 8.5% 7,874 7,741 6 2010 6 2011 6 2012 6 2013 6-2010 6-2011 6-2012 6-2013 6-2010 6-2011 6-2012 6-2013 6-2010 6-2011 6-2012 6-2013 6-2010 6-2011 6-2012 6-2013 6-2010 6-2011 6-2012 6-2013
  • 4. Closed Sales A count of the actual sales that have closed in a given month. Single-Family YoY Change Condominium YoY Change Jul-2012 1,279 + 25.3% 1,042 + 21.9% Aug-2012 1,300 + 26.1% 1,204 + 25.3% Sep-2012 766 - 1.2% 753 + 16.4% Oct-2012 792 + 28.8% 712 + 39.1% Nov-2012 907 + 32.4% 760 + 35.0% Dec-2012 824 + 11.8% 769 + 19.6% Jan-2013 605 + 15.7% 514 + 24.8% Feb-2013 431 - 7.1% 434 + 13.0% Mar-2013 631 - 2.6% 629 + 3.6% Apr-2013 778 + 4.7% 806 + 6.3% May-2013 1,115 + 10.9% 1,066 + 5.3% Jun-2013 1,468 - 2.8% 1,214 - 4.0% 1,245 1,051 1,511 1,264 1,468 1,214 June 20132012 20132012 4,106 3,740 4,894 4,437 5,028 4,663 Year to Date 20132012 201320122011 2011 2011 2011 Total 10,896 + 11.7% 9,903 + 14.9% All data from MLS Property Information Network, Inc. Provided by the Greater Boston Association of REALTORS® and the Massachusetts Association of REALTORS®. Powered by 10K Research and Marketing. | Click for Cover Page | 4 Single-Family Condominium 200 400 600 800 1,000 1,200 1,400 1,600 1,800 Jan-2003 Jan-2004 Jan-2005 Jan-2006 Jan-2007 Jan-2008 Jan-2009 Jan-2010 Jan-2011 Jan-2012 Jan-2013 Historical Closed Sales Activity Single-Family Condominium -4.0%+20.3%+21.4% Single-Family Condominium +5.1%+18.6%+19.2%-2.8% +2.7%
  • 5. Median Sales Price Median price point for all closed sales, not accounting for seller concessions, in a given month. Single-Family YoY Change Condominium YoY Change Jul-2012 $510,000 + 2.0% $387,000 + 6.3% Aug-2012 $490,000 - 1.8% $380,000 + 3.0% Sep-2012 $430,475 - 4.3% $375,000 + 2.0% Oct-2012 $430,250 + 10.3% $368,133 + 5.6% Nov-2012 $447,500 + 5.9% $380,000 + 8.2% Dec-2012 $470,000 + 6.8% $381,000 + 10.4% Jan-2013 $430,000 + 6.2% $375,000 + 5.6% Feb-2013 $429,900 + 8.8% $350,375 - 5.3% Mar-2013 $430,000 + 3.7% $405,500 + 19.3% Apr-2013 $476,500 + 13.9% $389,000 + 4.7% May-2013 $499,900 + 7.5% $410,000 + 7.6% Jun-2013 $541,500 + 7.8% $422,000 + 5.5% $505,000 $375,000 $502,500 $400,000 $541,500 $422,000 June 20132012 20132012 $450,000 $359,000 $450,000 $375,000 $484,000 $399,900 Year to Date 20132012 201320122011 2011 2011 2011 Median $475,000 + 5.3% $389,000 + 5.6% All data from MLS Property Information Network, Inc. Provided by the Greater Boston Association of REALTORS® and the Massachusetts Association of REALTORS®. Powered by 10K Research and Marketing. | Click for Cover Page | 5 Single-Family Condominium $250,000 $300,000 $350,000 $400,000 $450,000 $500,000 $550,000 Jan-2003 Jan-2004 Jan-2005 Jan-2006 Jan-2007 Jan-2008 Jan-2009 Jan-2010 Jan-2011 Jan-2012 Jan-2013 Historical Median Sales Price Single-Family Condominium +5.5%+6.7%-0.5% Single-Family Condominium +6.6%+4.5%0.0%+7.8% +7.6%
  • 6. Housing Affordability Index Single-Family YoY Change Condominium YoY Change Jul-2012 102 + 13.9% 131 + 9.5% Aug-2012 105 + 14.0% 133 + 9.0% Sep-2012 121 + 17.2% 137 + 10.4% Oct-2012 120 + 3.2% 139 + 7.3% Nov-2012 117 + 6.7% 135 + 4.6% Dec-2012 113 + 6.8% 136 + 3.6% Jan-2013 125 + 3.7% 141 + 4.2% Feb-2013 122 - 2.0% 146 + 11.1% Mar-2013 121 + 3.4% 128 - 8.9% Apr-2013 112 - 5.0% 135 + 2.6% May-2013 104 - 5.0% 124 - 5.0% Jun-2013 90 - 11.5% 114 - 9.6% This index measures housing affordability for the region. An index of 120 means the median household income was 120% of what is necessary to qualify for the median-priced home under prevailing interest rates. A higher number means greater affordability. 89 117 102 126 90 114 June 98 122 112 133 100 119 Year to Date 20132012 20132012 20132012 201320122011 2011 2011 2011 Average 113 +3.8% 133 +3.2% All data from MLS Property Information Network, Inc. Provided by the Greater Boston Association of REALTORS® and the Massachusetts Association of REALTORS®. Powered by 10K Research and Marketing. | Click for Cover Page | 6 Single-Family Condominium 60 70 80 90 100 110 120 130 140 150 160 Jan-2004 Jan-2005 Jan-2006 Jan-2007 Jan-2008 Jan-2009 Jan-2010 Jan-2011 Jan-2012 Jan-2013 Historical Housing Affordability Index Single-Family Condominium -9.6%+7.4%+14.6% Single-Family Condominium -10.3%+9.2%+13.9%-11.5% -11.2%
  • 7. Inventory of Homes for Sale The number of properties available for sale in active status at the end of a given month. Single-Family YoY Change Condominium YoY Change Jul-2012 3,985 - 23.6% 2,846 - 37.2% Aug-2012 3,747 - 25.8% 2,534 - 38.1% Sep-2012 3,920 - 26.2% 2,632 - 37.0% Oct-2012 3,637 - 28.3% 2,428 - 38.6% Nov-2012 3,120 - 27.9% 2,095 - 39.5% Dec-2012 2,396 - 31.4% 1,605 - 41.4% Jan-2013 2,381 - 31.3% 1,656 - 41.5% Feb-2013 2,490 - 33.4% 1,766 - 41.2% Mar-2013 2,428 - 42.1% 1,782 - 47.3% Apr-2013 2,769 - 37.7% 2,005 - 41.2% May-2013 2,955 - 35.3% 2,008 - 39.3% Jun-2013 2,786 - 35.4% 1,847 - 40.1% 5,289 4,862 4,316 3,086 2,786 1,847 June 20132012 201320122011 2011 Average 3,051 - 31.2% 2,100 - 40.0% All data from MLS Property Information Network, Inc. Provided by the Greater Boston Association of REALTORS® and the Massachusetts Association of REALTORS®. Powered by 10K Research and Marketing. | Click for Cover Page | 7 Single-Family Condominium 1,000 2,000 3,000 4,000 5,000 6,000 7,000 8,000 9,000 Jan-2003 Jan-2004 Jan-2005 Jan-2006 Jan-2007 Jan-2008 Jan-2009 Jan-2010 Jan-2011 Jan-2012 Jan-2013 Historical Inventory of Homes for Sale Single-Family Condominium -40.1%-36.5%-18.4% -35.4%
  • 8. Months Supply of Inventory The inventory of homes for sale at the end of a given month, divided by the average monthly pending sales from the last 12 months. Single-Family YoY Change Condominium YoY Change Jul-2012 3.1 - 39.0% 2.7 - 48.5% Aug-2012 2.9 - 41.2% 2.1 - 50.6% Sep-2012 5.1 - 25.3% 3.5 - 45.9% Oct-2012 4.6 - 44.3% 3.4 - 55.8% Nov-2012 3.4 - 45.6% 2.8 - 55.2% Dec-2012 2.9 - 38.7% 2.1 - 51.0% Jan-2013 3.9 - 40.6% 3.2 - 53.1% Feb-2013 5.8 - 28.2% 4.1 - 48.0% Mar-2013 3.8 - 40.5% 2.8 - 49.1% Apr-2013 3.6 - 40.5% 2.5 - 44.7% May-2013 2.7 - 41.7% 1.9 - 42.4% Jun-2013 1.9 - 33.6% 1.5 - 37.7% 4.2 4.6 2.9 2.4 1.9 1.5 June 20132012 201320122011 2011 Average 3.5 - 41.0% 2.7 - 49.5% All data from MLS Property Information Network, Inc. Provided by the Greater Boston Association of REALTORS® and the Massachusetts Association of REALTORS®. Powered by 10K Research and Marketing. | Click for Cover Page | 8 Single-Family Condominium 0 2 4 6 8 10 12 14 16 Jan-2004 Jan-2005 Jan-2006 Jan-2007 Jan-2008 Jan-2009 Jan-2010 Jan-2011 Jan-2012 Jan-2013 Historical Months Supply of Inventory Single-Family Condominium -37.7%-47.2%-32.8% -33.6%
  • 9. Days on Market Until Sale Average number of days between when a property is listed and when an offer is accepted in a given month. Single-Family YoY Change Condominium YoY Change Jul-2012 80 - 3.9% 71 - 20.6% Aug-2012 87 - 5.7% 76 - 18.2% Sep-2012 89 - 12.0% 85 - 18.1% Oct-2012 90 - 17.4% 84 - 11.5% Nov-2012 89 - 17.9% 77 - 29.9% Dec-2012 97 - 12.4% 84 - 30.1% Jan-2013 109 - 16.5% 88 - 29.6% Feb-2013 111 - 17.2% 95 - 22.6% Mar-2013 108 - 17.5% 72 - 39.0% Apr-2013 94 - 22.1% 63 - 35.1% May-2013 75 - 22.0% 51 - 40.4% Jun-2013 56 - 37.2% 42 - 43.6% 90 94 90 75 56 42 June 110 111110 96 84 62 Year to Date 20132012 20132012 20132012 201320122011 2011 2011 2011 Total 86 - 17.6% 66 - 26.7% All data from MLS Property Information Network, Inc. Provided by the Greater Boston Association of REALTORS® and the Massachusetts Association of REALTORS®. Powered by 10K Research and Marketing. | Click for Cover Page | 9 Single-Family Condominium 40 60 80 100 120 140 160 Jan-2003 Jan-2004 Jan-2005 Jan-2006 Jan-2007 Jan-2008 Jan-2009 Jan-2010 Jan-2011 Jan-2012 Jan-2013 Historical Days on Market Until Sale Single-Family Condominium -43.6%-20.4%-0.1% Single-Family Condominium -35.5%-13.4%-0.0%-37.2% -23.6%
  • 10. Percent of Original List Price Received Single-Family YoY Change Condominium YoY Change Jul-2012 95.8% + 1.6% 96.6% + 1.7% Aug-2012 94.8% + 1.5% 96.3% + 2.2% Sep-2012 94.6% + 1.5% 96.4% + 2.3% Oct-2012 94.3% + 2.8% 95.9% + 2.4% Nov-2012 94.6% + 2.4% 96.2% + 2.5% Dec-2012 94.2% + 2.2% 96.2% + 3.4% Jan-2013 93.8% + 3.6% 95.9% + 3.2% Feb-2013 94.1% + 3.2% 96.7% + 3.5% Mar-2013 95.2% + 2.4% 97.6% + 3.8% Apr-2013 96.7% + 3.4% 98.8% + 3.3% May-2013 97.8% + 2.6% 99.4% + 3.5% Jun-2013 98.3% + 3.2% 99.7% + 3.5% Percentage found when dividing a property’s sales price by its original list price, then taking the average for all properties sold in a given month, not accounting for seller concessions. 94.6% 94.7%95.3% 96.3%98.3% 99.7% June 93.2% 93.9%93.8% 95.3%96.7% 98.5% Year to Date 20132012 20132012 20132012 201320122011 2011 2011 2011 Average 95.7% + 2.4% 97.3% + 2.8% All data from MLS Property Information Network, Inc. Provided by the Greater Boston Association of REALTORS® and the Massachusetts Association of REALTORS®. Powered by 10K Research and Marketing. | Click for Cover Page | 10 Single-Family Condominium 89% 91% 93% 95% 97% 99% 101% Jan-2003 Jan-2004 Jan-2005 Jan-2006 Jan-2007 Jan-2008 Jan-2009 Jan-2010 Jan-2011 Jan-2012 Jan-2013 Historical Percent of Original List Price Received Single-Family Condominium +3.5%+1.8%+0.8% Single-Family Condominium +3.4%+1.5%+0.7%+3.2% +3.0%
  • 11. Pending Sales A count of the properties in UAG status between the first and last day in a given month, regardless of current status (based on Off Market Date). Single-Family YoY Change Condominium YoY Change Jul-2012 952 + 25.6% 810 + 14.6% Aug-2012 790 + 11.6% 734 + 19.9% Sep-2012 874 + 28.7% 743 + 38.1% Oct-2012 885 + 19.3% 795 + 34.5% Nov-2012 697 + 13.5% 608 + 10.3% Dec-2012 517 + 9.3% 463 + 11.6% Jan-2013 639 + 4.4% 666 + 20.4% Feb-2013 720 - 5.3% 722 - 3.5% Mar-2013 1,206 + 4.5% 1,184 + 10.9% Apr-2013 1,433 + 15.5% 1,294 + 10.6% May-2013 1,556 + 19.9% 1,314 + 11.3% Jun-2013 1,377 + 15.5% 1,158 + 15.7% 1,040 840 1,192 1,001 1,377 1,158 June 5,131 4,546 6,257 5,721 6,931 6,338 Year to Date 20132012 20132012 20132012 201320122011 2011 2011 2011 Total 11,646 + 13.8% 10,491 + 14.8% All data from MLS Property Information Network, Inc. Provided by the Greater Boston Association of REALTORS® and the Massachusetts Association of REALTORS®. Powered by 10K Research and Marketing. | Click for Cover Page | 11 Single-Family Condominium 200 400 600 800 1,000 1,200 1,400 1,600 1,800 2,000 2,200 Jan-2003 Jan-2004 Jan-2005 Jan-2006 Jan-2007 Jan-2008 Jan-2009 Jan-2010 Jan-2011 Jan-2012 Jan-2013 Historical Pending Sales Activity Single-Family Condominium +15.7%+19.2%+14.6% Single-Family Condominium +10.8%+25.8%+21.9%+15.5% +10.8%
  • 12. New Listings A count of the properties that have been newly listed on the market in a given month. Single-Family YoY Change Condominium YoY Change Jul-2012 1,022 - 12.5% 903 - 7.5% Aug-2012 1,001 - 8.7% 790 - 7.5% Sep-2012 1,419 - 10.2% 1,153 - 9.6% Oct-2012 1,079 - 4.5% 881 - 2.1% Nov-2012 649 - 3.3% 561 - 10.4% Dec-2012 366 - 19.0% 319 - 17.8% Jan-2013 903 - 6.2% 916 - 4.0% Feb-2013 1,029 - 22.0% 966 - 15.3% Mar-2013 1,395 - 30.5% 1,367 - 21.5% Apr-2013 2,052 + 14.1% 1,696 + 13.1% May-2013 2,043 + 14.6% 1,546 + 11.5% Jun-2013 1,544 + 14.2% 1,250 + 8.5% 1,596 1,3421,352 1,152 1,544 1,250 June 9,096 8,592 9,223 7,874 8,966 7,741 Year to Date 20132012 20132012 20132012 201320122011 2011 2011 2011 Total 14,502 - 5.3% 12,348 - 4.2% All data from MLS Property Information Network, Inc. Provided by the Greater Boston Association of REALTORS® and the Massachusetts Association of REALTORS®. Powered by 10K Research and Marketing. | Click for Cover Page | 12 Single-Family Condominium 0 250 500 750 1,000 1,250 1,500 1,750 2,000 2,250 2,500 2,750 Jan-2003 Jan-2004 Jan-2005 Jan-2006 Jan-2007 Jan-2008 Jan-2009 Jan-2010 Jan-2011 Jan-2012 Jan-2013 Historical New Listing Activity Single-Family Condominium +8.5%-14.2%-15.3% Single-Family Condominium -1.7%-8.4%+1.4%+14.2% -2.8%
  • 13. City of Boston – Market Overview Key market metrics for the current month and year-to-date figures for the City of Boston. Key Metrics Historical Sparklines Jun-2012 Jun-2013 + / – YTD 2012 YTD 2013 + / – - 1.6% Median Sales Price $428,000 $447,000 + 4.4% $400,500 $430,000 + 7.4% Closed Sales 706 643 - 8.9% 2,533 2,493 - 11.2% Inventory of Homes for Sale 1,623 981 - 39.6% -- -- -- Housing Affordability Index 102 90 - 11.5% 112 100 6-2010 6-2011 6-2012 6-2013 6-2010 6-2011 6-2012 6-2013 6-2010 6-2011 6-2012 6-2013 6-2010 6-2011 6-2012 6-2013 -- Days on Market Until Sale 75 36 - 52.5% 94 53 - 43.4% Months Supply of Inventory 2.3 1.5 - 33.6% -- -- + 3.4% Pending Sales 586 648 + 10.6% 3,247 3,474 + 7.0% Percent of Original List Price Received 96.1% 99.4% + 3.5% 95.1% 98.4% - 3.6% All data from MLS Property Information Network, Inc. Provided by the Greater Boston Association of REALTORS® and the Massachusetts Association of REALTORS®. Powered by 10K Research and Marketing. | Click for Cover Page | 13 New Listings 644 701 + 8.9% 4,496 4,336 6 2010 6 2011 6 2012 6 2013 6-2010 6-2011 6-2012 6-2013 6-2010 6-2011 6-2012 6-2013 6-2010 6-2011 6-2012 6-2013 6-2010 6-2011 6-2012 6-2013 6-2010 6-2011 6-2012 6-2013