The Christmas rally is on & Bitcoin
•Download as DOCX, PDF•
0 likes•383 views

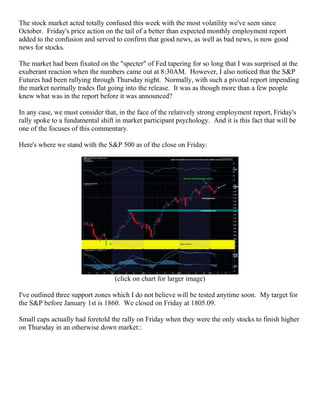
The stock market acted with high volatility this week, reacting positively to a stronger-than-expected jobs report on Friday. This confirmed that the market views both good and bad news as positive for stocks. Interest rates rose throughout the week on positive economic data from Europe and the US. The author expects the stock market rally to continue until the new year, reaching a target of 1860 for the S&P 500, but remains concerned about deflation in Europe and weak economic indicators in the US that conflict with the market's optimism.

Recommended
More Related Content
What's hot
What's hot (20)
Viewers also liked
Viewers also liked (20)
Similar to The Christmas rally is on & Bitcoin
Similar to The Christmas rally is on & Bitcoin (20)
Recently uploaded
Recently uploaded (20)
The Christmas rally is on & Bitcoin
- 1. The stock market acted totally confused this week with the most volatility we've seen since October. Friday's price action on the tail of a better than expected monthly employment report added to the confusion and served to confirm that good news, as well as bad news, is now good news for stocks. The market had been fixated on the "specter" of Fed tapering for so long that I was surprised at the exuberant reaction when the numbers came out at 8:30AM. However, I also noticed that the S&P Futures had been rallying through Thursday night. Normally, with such a pivotal report impending the market normally trades flat going into the release. It was as though more than a few people knew what was in the report before it was announced? In any case, we must consider that, in the face of the relatively strong employment report, Friday's rally spoke to a fundamental shift in market participant psychology. And it is this fact that will be one of the focuses of this commentary. Here's where we stand with the S&P 500 as of the close on Friday: (click on chart for larger image) I've outlined three support zones which I do not believe will be tested anytime soon. My target for the S&P before January 1st is 1860. We closed on Friday at 1805.09. Small caps actually had foretold the rally on Friday when they were the only stocks to finish higher on Thursday in an otherwise down market::
- 2. (click on chart for larger image) The Russell 2000 gave back some of the rally going into the close on Friday (see the long wick on the candlestick above). Small caps have been leading the general market higher for over a year and are a bit tired at this point so I'm not too concerned that they did not rally into the close. However, I will be monitoring this index closely as sustained weakness relative to the S&P could be a harbinger of a weaker general market going forward. Treasury yields had been surging since Wednesday when a spate of improving manufacturing reports out of Europe and a better than expected ADP employment report sparked methodical selling of Uncle Sam's debt. Here's a daily chart of the Ten Year Treasury Note yield: (click on chart for larger image) I've marked on the chart the all time intra-day low yield of 1.394% set on 7/24/2012. That mark may prove to be the bottom in yields in the great bull market in bonds that started in 1982. Some of the pundits on CNBC are getting pretty confident in stating that a new bear market in bonds has started. And although I'm not suggesting anyone invest in bonds at this point I think it might be a
- 3. bit premature to call an end to this historic bull market. I have a few reasons for my position and the monthly chart of the Ten Year Treasury yield I have posted below is one of those reasons: (click on chart for larger image) A careful study of this chart which shows the great bull market in bonds that started in 1982 reveals we are barely penetrating a downtrend line set from the June, 2007 highs in yield. And we are nowhere near violating the down trend line set from the highs in yield in 1982! I'll be addressing the other points relating to why I believe interest rates will remain in this vicinity (50 basis points on either side of Friday's close) for some time to come. The immediate question for the market is how much higher can interest rates go before money leaves the market for the safer environment of US Treasuries. In this super low inflation environment we find ourselves, even the low interest rates that are being earned on US debt may entice those investors who were never comfortable with risk to pull their money out of stocks. My hunch is that as long as stock market momentum is intact higher interest rates will not be a catalyst for a serious correction in equities. Gold had a volatile week, taking a $33.00 nose dive on Monday and then seesawing through the week, twice bouncing off the $1,210.00 level:
- 4. (click on chart for larger image) With global disinflationary and deflationary forces rampant, it's difficult to get excited about gold's prospects. Additionally, interest rates creeping higher will serve to put additional selling pressure on the precious metal. The sentiment toward the yellow metal is so low that one wonders if there's no one else left to sell! A look at the weekly chart may hold a glimmer of hope for Gold: (click on chart for larger image) I am mildly encouraged that gold bounced off the $1.200.00 level with a candlestick formation that cannot be described exactly as a "hammer" but the long tail on the candlestick tells me that sellers were decisively turned away at the $1,200.00 level this week. But I want to emphasize that this is only a glimmer and fundamentally the prospects for the yellow metal do not look good. I am watching Gold closely as I believe that if the recovery that the stock market told us by Friday's price action is real, we should start to see some firming in the precious metal's price with all the fiat currency the world is awash in. Commodities, in the low inflation, tepid growth global economy we find ourselves, are still in the doldrums. However, I must admit they seem to be stirring. We had some notable price action on the daily charts of copper and steel in recent weeks though most of the weekly charts still have these industrial commodities under long term resistance lines. The weekly chart of the Dow Jones UBS Industrial Metals Index ($DJAIN) is representative of the commodity complex:
- 5. (click on chart for larger image) Let's take a look at China and Emerging Markets. Here's a weekly chart of the Shanghai Composite Index: (click on chart for larger image) The Shanghai has penetrated a downtrend line established from May, 2011 but is still significantly below a downtrend line established in May, 2008. Always remember when you here anyone talking about China as a "stand alone" economy: It is still the tail the dog wags! And that dog is the consumer based economies in the West. Admittedly, that may be changing but we are nowhere near China being a consumer based economy. Here's a weekly chart of the iShares MSCI Emerging Markets ETF:
- 6. (click on chart for larger image) The chart speaks for itself. It's been an extremely volatile year for Emerging Markets and if you want to invest in these markets you need to do your homework. Investing blindly in an ETF like the one above is liable to put you on a roller coaster ride to nowhere. The unanswered question for all emerging markets will be the effect of Fed tapering on their currencies and economies once it starts. We saw a bloodbath in June when Bernanke suggested that the time was near for the Fed to take away the punch bowl and we will quickly know whether the market believes that the mildly positive economic reports emanating from this country and Europe will be enough to spur the export growth these countries will need to depend on when Fed largesse ends. Finally, here's a chart of our latest currency: Bitcoin:
- 7. (click on chart for larger image) I couldn't resist! :-) When Bitcoin emerged as an alternative currency I first ignored it. When it hit $850.00 I looked into it a bit deeply. I originally considered that any currency, fiat or digital, with a finite circulation, can do well in a world where central banks are printing a theoretical infinite amount of currency. However, Bitcoin's problem will inevitably be one of competition. In a free market economy who's to stop anyone else from starting their own virtual currency? Here's a growing list of other "alternative" currencies: https://en.bitcoin.it/wiki/List_of_alternative_cryptocurrencies In such a market environment, an alternative currency's value will depend as much on SEO (search engine optimization) and advertising as anything else. I'm not saying Bitcoin can't survive. I'm saying that it will be engaged with others in a "survival of the fittest" competition of which admittedly Bitcoin has an edge. But the chart above of the 17th Century Tulip mania is appropriate for this phenomena for now. Analysis It seems all is well. The market seemed to speak in an unequivocal way on Friday about what it sees as a recovering global economy. The low inflation readings in this country are being touted as a blessing to the economy (which they are so long as they don't slip much lower) and everyone is ignoring the outright deflation going on in vast sectors of the European economy, choosing to focus instead on incrementally improving manufacturing statistics based on human surveys. I can't ignore the message of the market as it is the sum total of all the knowledge, wisdom, greed and fear of it's participants. We do have some correlating data which suggests things are getting better:
- 8. (click on chart for larger image) The Baltic Dry Index is a shipping and trade index that measures changes in the cost to transport raw materials such as metals, grains and fossil fuels by sea. The Baltic Exchange directly contacts shipping brokers to assess price levels for a given route, product to transport and time to delivery (speed). The Baltic Dry Index is often considered a leading indicator of future economic growth because it measures the costs of raw, pre-production material, which is an area associated with very low levels of speculation (free of market distortions). We saw a surge in rates earlier in the year but in the last week the index shot up once more and is now threatening the levels back in October, 2011. I'll be more confident with what the Baltic seems to be telling us when we break above the immediate level we are at. Meanwhile, the Eurozone PPI (Producer Price index) for October came in at -0.5% versus -0.2% expected. Year over Year it is -1.4% versus -1.0% expected. Folks, this is outright ugly deflation! And no one gave it barely a notice! I ask this question in sincerity: What am I missing? Can someone provide any feedback on why these numbers are being ignored? Most importantly, ECB President Mario Draghi signaled a continuation of monetary policy this week after the Bank's monthly meeting. That's great for the Euro currency but doesn't help European exports at all. So, liquidity is drying up in Europe, deflation reins and the market is hanging it's hat on manufacturing surveys?! And in this country I'll be eagerly awaiting PPI numbers that will be coming out next Friday the 13th, but here's the latest read on Velocity of M2 Money Supply, courtesy of the St. Louis Fed. The first chart shows the Velocity since the Fed started tracking it in late 1958:
- 9. (click on chart for larger image) Here's the same chart highlighting the last five years: (click on chart for larger image) From the St. Louis Fed: The velocity of money is the frequency at which one unit of currency is used to purchase domestically- produced goods and services within a given time period. In other words, it is the number of times one dollar is spent to buy goods and services per unit of time. If the velocity of money is increasing, then more transactions are occurring between individuals in an economy. So, I keep asking the question: If the economy is recovering why are these readings still deteriorating? Am I missing something? I ask this question in sincerity. I don't have all the answers. Will someone show me how we can have a sustainable global economic growth in a world where the other consumer based economic zone (Europe) is in the throes of deflation and and in our consumer based economy where less economic transactions are occurring between individuals? There's much more that can be said about this situation, from the consumer psychology that is prevalent in all consumer based economies to the specter that deflation is an exportable phenomena. Yes, I do believe it is exportable. It doesn't have to happen but the notion that it can never happen is erroneous. If Japan's example hasn't taught us that, shame on us. I submit to my
- 10. readers that Japan's (at that time the world's second largest economy) deflation commencing in 1990 was a significant driver behind the severe disinflation we experienced in the 1990's. In any case, it's all for naught as Mr. Market is saying "all is well". The green light is now on. Expect a Christmas rally regardless of the FOMC meeting results on 12/17 - 12/18. With only 55 S&P points between Friday's close and my target (1860) we may exceed that level by the New Year. Have a great week!