Gold's message & the comatose patient
•Download as DOCX, PDF•
1 like•371 views

This week's commentary on the financial markets and events surrounding their price action.

Recommended
Recommended
More Related Content
What's hot
What's hot (20)
Similar to Gold's message & the comatose patient
Similar to Gold's message & the comatose patient (20)
Recently uploaded
Recently uploaded (20)
Gold's message & the comatose patient
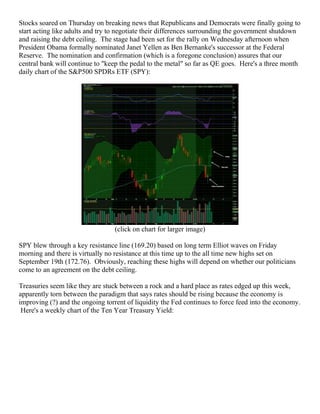
- 1. Stocks soared on Thursday on breaking news that Republicans and Democrats were finally going to start acting like adults and try to negotiate their differences surrounding the government shutdown and raising the debt ceiling. The stage had been set for the rally on Wednesday afternoon when President Obama formally nominated Janet Yellen as Ben Bernanke's successor at the Federal Reserve. The nomination and confirmation (which is a foregone conclusion) assures that our central bank will continue to "keep the pedal to the metal" so far as QE goes. Here's a three month daily chart of the S&P500 SPDRs ETF (SPY): (click on chart for larger image) SPY blew through a key resistance line (169.20) based on long term Elliot waves on Friday morning and there is virtually no resistance at this time up to the all time new highs set on September 19th (172.76). Obviously, reaching these highs will depend on whether our politicians come to an agreement on the debt ceiling. Treasuries seem like they are stuck between a rock and a hard place as rates edged up this week, apparently torn between the paradigm that says rates should be rising because the economy is improving (?) and the ongoing torrent of liquidity the Fed continues to force feed into the economy. Here's a weekly chart of the Ten Year Treasury Yield:
- 2. (click on chart for larger image) But the real story in interest rates is occurring on the short end of the yield curve where short term rates are spiking, courtesy of the present fighting in Washington. Here's a daily chart of the Three Month T-Bill Discount Rate going back to the Great Financial Crisis: (click on chart for larger image) With the threat of a US debt default, many institutions and investors are shedding short term debt (T-Bills) that are maturing in late October and November. Fidelity Investments made headlines earlier in the week when it announced that they were liquidating all their short term Treasuries in order to protect the 400 billion in money market assets they manage. But, in fact, many institutions did the same thing in 2011 when we were going thru the same issues in Washington but rates stayed low because, at that time, Europe appeared to be imploding, forcing an international "flight to safety" trade in short term debt. For money market funds, such a liquidation in these circumstances is a prudent move because, in the event of a default, the inability to redeem maturing T-Bills would threaten their ability to maintain the $1.00 NAV (Net Asset Value). No doubt, the chart above reflects a temporary phenomenon predicated on a solution to the present wrangling in Washington. And the clear message of the two charts is that the potential of a debt default is not based on the US inability to pay but on its refusal to pay. Otherwise, we'd be seeing rates spike across the entire yield curve. But these are the things that cause more stress on the financial system and contributing to slowing down our economy.
- 3. Gold was the real loser on the week. Caught in a crossfire between a seemingly dwindling political crisis in Washington and continuing disinflationary to deflationary pressures around the world, the yellow metal started its decline on Tuesday with a break away gap to the downside that was repeated on Friday. Even Yellen's nomination, which should have been a catalyst for higher prices, was met with increased selling pressure which is a very bearish indication for the precious metal. Here's a weekly chart of the of Gold's spot price with key support areas delineated: (click on chart for a larger image) It is essential that Gold hold the $1200.00 level. If it were to maintain that level there would be hope for a bounce to the $1525 - $1550 level. For some very good reasons however, I'm targeting an eventual price as low as $900.00. I'll have more on Gold in my analysis. Commodities continue to tread water, a result of flat global economic growth and a reflection of central bank inability to reflate global economic growth. Here's a daily chart of "Dr. Copper":
- 4. (click on chart for larger image) Here's a daily chart of the S&P GSCI Industrial Metals Index (spot price) comprised of spot prices of aluminum, copper, lead, nickel and zinc: (click on chart for larger image) And here's a weekly chart of the Dow Jones World Basic Materials index: (click on chart for larger image) The common thread in all three charts posted above is that they continue to flirt with long term down trend lines, seemingly wanting to breakout but without sufficient momentum to do so. I take this indication as a signal that we're at an inflection point in the global economic recovery. While no one can predict how long we can muddle along without deflationary psychology gaining a form footing in the minds of the general population, the longer we tarry at these levels the more bearish I become.
- 5. Lastly, here's a weekly chart of the US Dollar which continues to suffer as a result of the Fed's unlimited "QE" policy: (click on chart for larger image) The Dollar has suffered at the expense of the Euro as marginally better economic news has emanated from the EU since July. This, along with the Fed's decision not to taper in September and the political wrangling in Washington has negatively impacted the Dollar. The point I want my readers to take away from the chart above is that the Dollar has dropped out of a "rising wedge" pattern (purple dotted lines) which is a bearish indication. However, I'm not sounding an alarm yet. Anyone involved in the FOREX (foreign exchange) market knows these types of signals can change on a dime. In the short term, I actually expect the dollar to strengthen based on inverse head and shoulders patterns on the Dollar/British Pound cross & the Dollar:Swiss Franc cross. But the chart bears watching in the months ahead because sustained weakness in USD could be sending the message that the almost 4 trillion in Treasury and MBS holdings the Fed has on its books may be a permanent liability. The implications of the prior sentence are to vast and complicated to dissect here. I will attempt to parse these issues in future commentaries if events start to play out in this very precarious direction. Analysis As stated in previous commentaries, my short term thesis is for stocks to rally to all time new highs against a larger backdrop of tepid global economic growth and continued deflationary pressures. These deflationary pressures refuse to dissipate which has been my main concern. In any other environment, all time highs in stocks and continued deflationary pressures could never coexist but for massive central bank monetary accommodation. In the street's view, one of the biggest challenges stocks seem to have is growing earnings and the "top line" (revenues) in this muted economic environment in which we find ourselves. There are
- 6. some on the street concerned that the projected inability for corporations to grow their "top line" will eventually impact earnings. And to this I would not disagree but only to respond that so long as the Fed continues to maintain their asset purchases and Wall Street continues to play the game of lowering earnings expectations enough so that companies can beat them, when, since 2008, have earnings ever been the key factor as to when stocks as a group move up or down? Or far that matter, can anyone honestly identify where we are in the business cycle with all the distortions that the Fed has created? As I write this I can visualize a comatose patient on life support. And I would not want my readers to believe this is exactly where we're at in the financial markets and economy but, in my heart of hearts, I do believe the vision is not far from the mark! Gold's demise should not be dismissed as an isolated event. As a predictor of future inflationary pressures its continued beating since it's all time high of September, 2011, in the face of multiple central banks attempting to reflate the global economy speaks to the failure of that experiment. The present weakness is telling us that the risk of the economy sinking into deflation is greater than anyone on Wall Street, the Fed or Washington is willing to admit to. Here's an update of a chart I've posted in previous commentaries that serves to illustrate the ineffectiveness of the Fed's reflation policy up to this point: (click on chart for larger image) This is a ratio chart of the iShares Barclays TIPS (Treasury Inflation Protected Securities) ETF and the iShares Barclays Seven to Ten Year Treasury ETF. Simply, the idea behind the ratio is that when investors perceive the threat of inflation, TIPs will outperform regular yielding debt instruments and when there is no threat of inflation, non-protected Treasuries will outperform TIPs. As you can see, the ratio has been trading in a pretty defined channel since 2009. Notice the black arrow to the right of the chart when the ratio dropped precipitously earlier this year. We're now in the midst of a mild bounce. Until we start seeing upside pressure on this chart the lack of inflationary pressures in this "recovery" is a danger signal that must be heeded by investors. Ditto the chart below: This is a chart of the Dow Jones UBS Industrial Metals Index ($DJAIN) with the S&P 500 superimposed upon it (white line). I've mapped out the entire history of QE and its diminishing effects on commodities as paper assets continue to rise:
- 7. (click on chart for larger image) I'm not trying to paint a bleak picture. But it is what it is! The chart reflects a very minor uptick in industrial commodity prices since August. At the same time, we must remember that commodities are the "Johnny come lately" to the business cycle (where ever we may be in that cycle) and I still hold out hope that central banks can manage to maintain the equilibrium of the past few years until the global economy can gain traction. In the meantime, Yellen's nomination gives the markets assurance that the Fed will continue to "float all boats". If/when we get this noise in Washington out of the way, this market is going higher; maybe a lot higher. I'm starting to consider that my target of 1800 on the S&P may be exceeded by Christmas. Certainly, without any other headwinds in the global economy, it will be exceeded in 2014. However, we need to be cognizant of the continued inability of the planet to shake the deflationary stranglehold it finds itself in. Weak to negative real wage growth in developed countries will continue to feed the deflationary juggernaut and the psychology behind that feeble wage growth is already impacting consumer attitudes by forcing choices between products and industries that, in the past, did not have to be made. Retail stocks took a beating earlier this week before rebounding with the general market on negative news out of a few retailers and dismal forward guidance from the industry generally. If you have to pay $100/month to maintain your iPhone, you pass on the cashmere sweater. And this is the result of real incomes being squeezed as part time work becomes the norm. Another negative impact is Obamacare. I had the opportunity to speak to an insurance professional this morning who markets health insurance plans to small and medium size businesses. Health care premiums to his customers have jumped 20 to 30% since the passing of Obamacare and some of his clients are facing huge fines if they do not insure their staffs. The problem is they can't afford to insure their staffs. So, the logical effect is a contraction in these businesses. As I ponder Obamacare, my mind goes back to 1936 when the Roosevelt administration raised taxes on corporate profits and 1937 when that administration introduced payroll taxes to fund the Social Security program. The resulting contraction in subsequent years deeper than the initial depression of the early 1930's. It eventually took a world war to get us out of the economic morass of the 1930's. In the short term, I believe the market got a bit ahead of itself with the monster rally we had on Thursday. There is still no deal in Washington and the perceived notion that the two sides must come together after the dismal approval ratings that some polls reflected this week may prove to be
- 8. a mistaken assumption. I remember the same optimism in July, 2011 which quickly disappeared. As I write this on Saturday morning a breaking news report just hit the wires that Obama and Boehner have reached an impasse. I'll be quite surprised if anything substantive comes out of negotiations this weekend. Expect considerable volatility next week. And we may well be setting up for a "buy the rumor; sell the fact" event if/when a deal is reached; being that the deal will most probably be too temporary and lack any real substance for the street's liking. Another "kick the can ..." announcement may not placate investors this time. We shall see ... Have a great week!