Download as PDF, PPTX
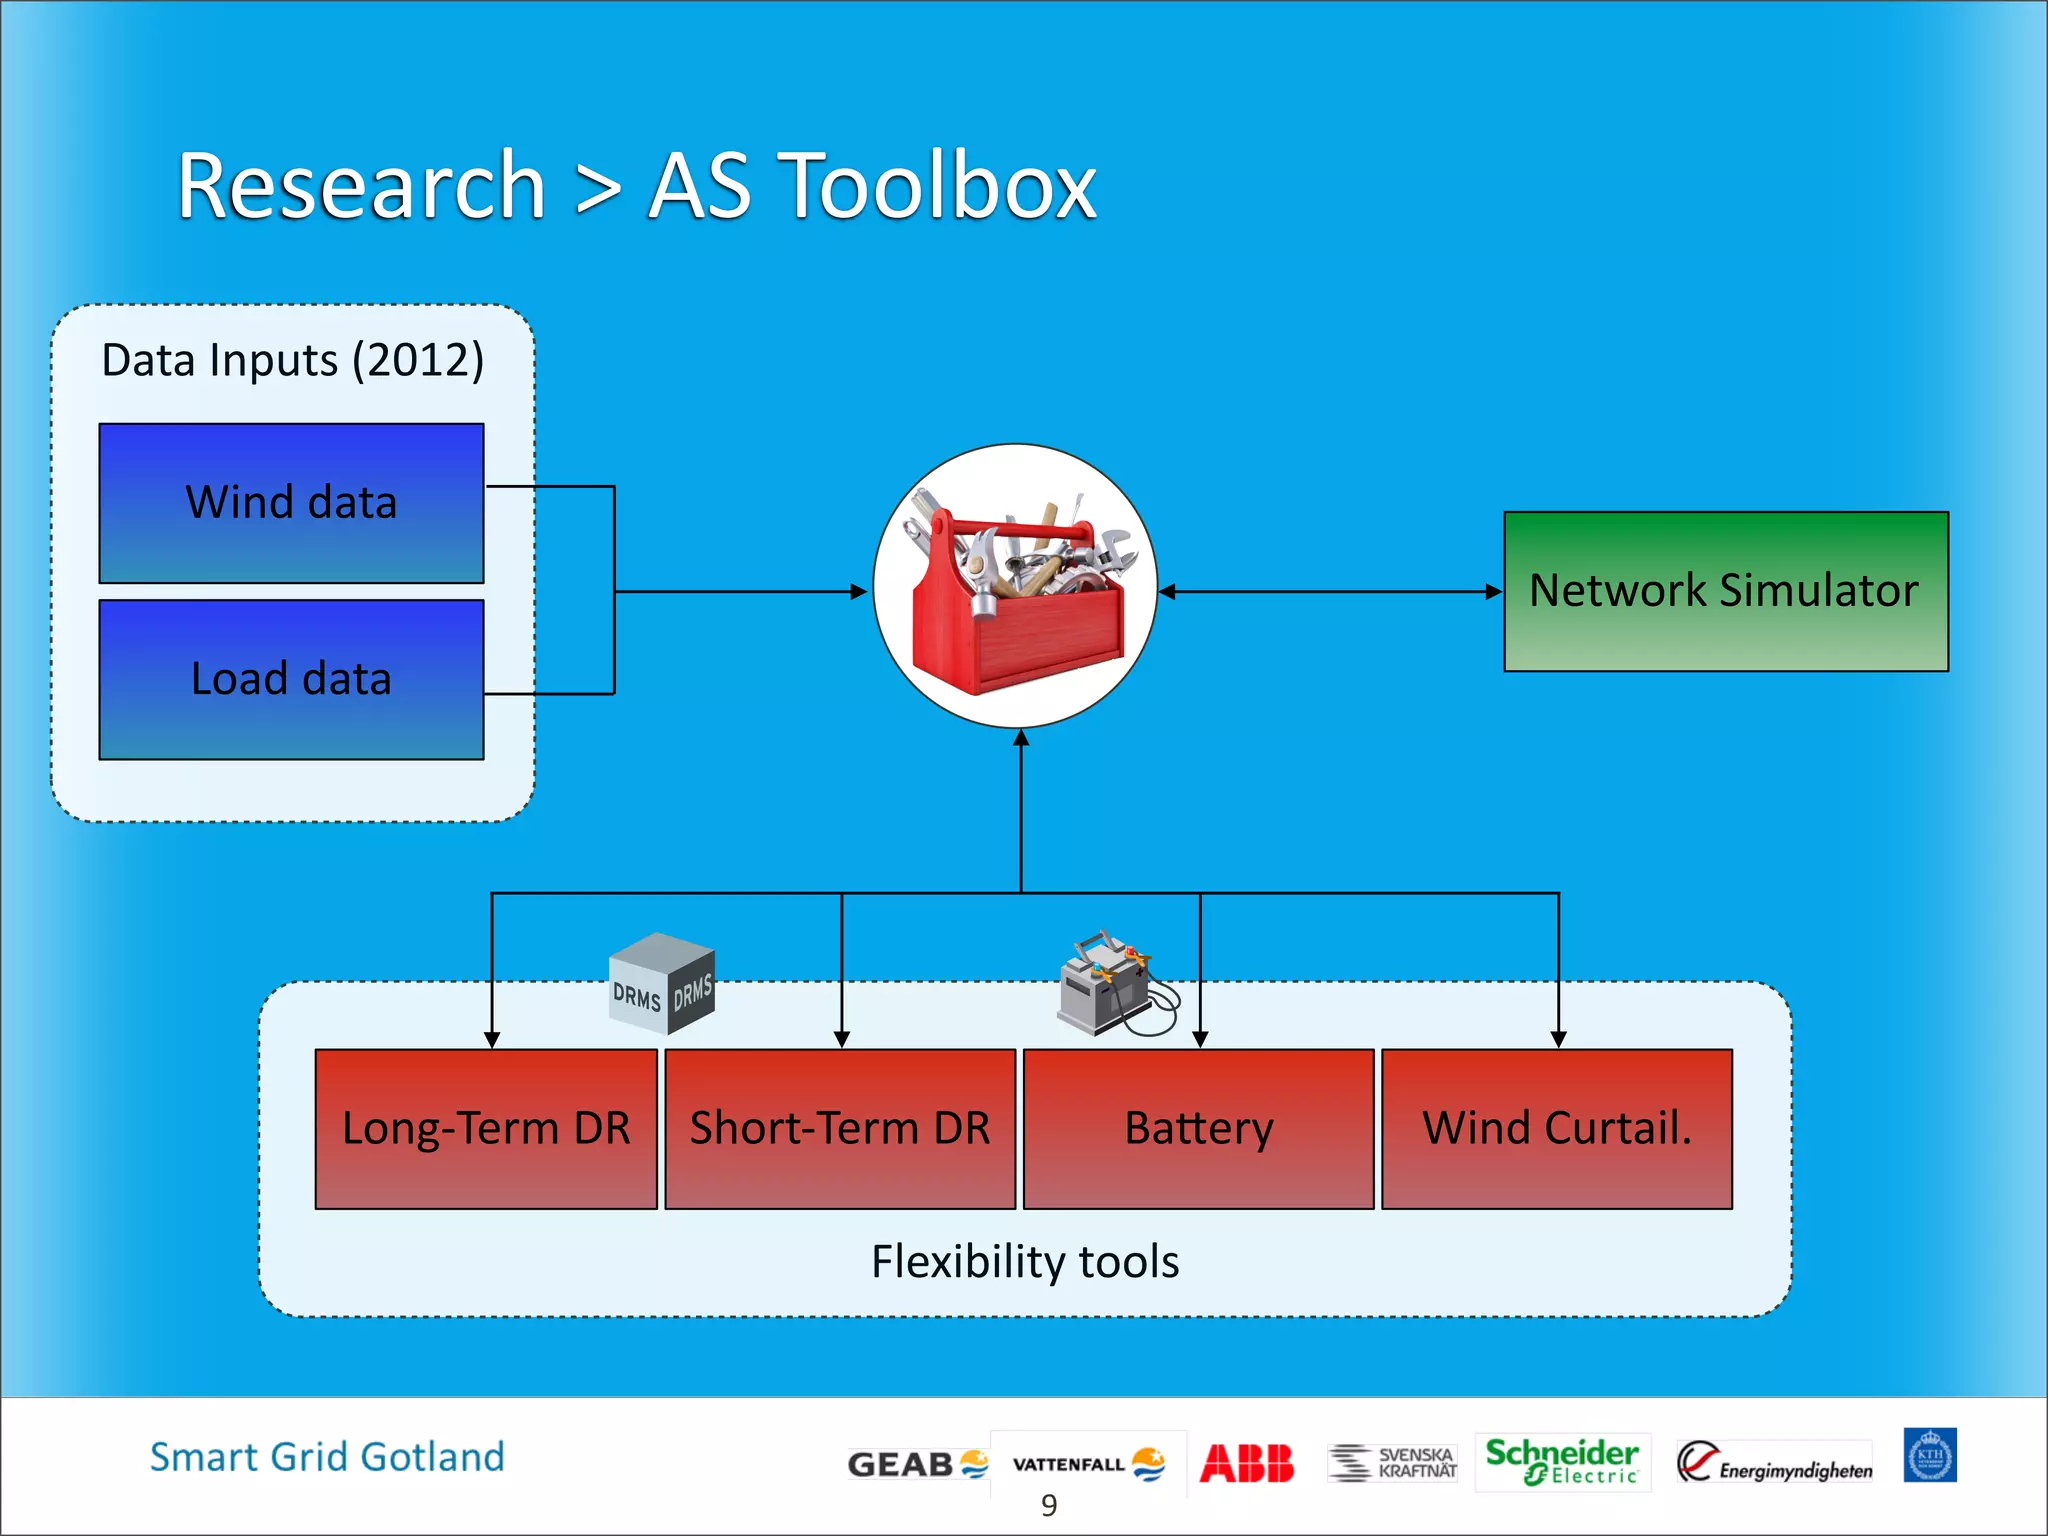
![Required cluster
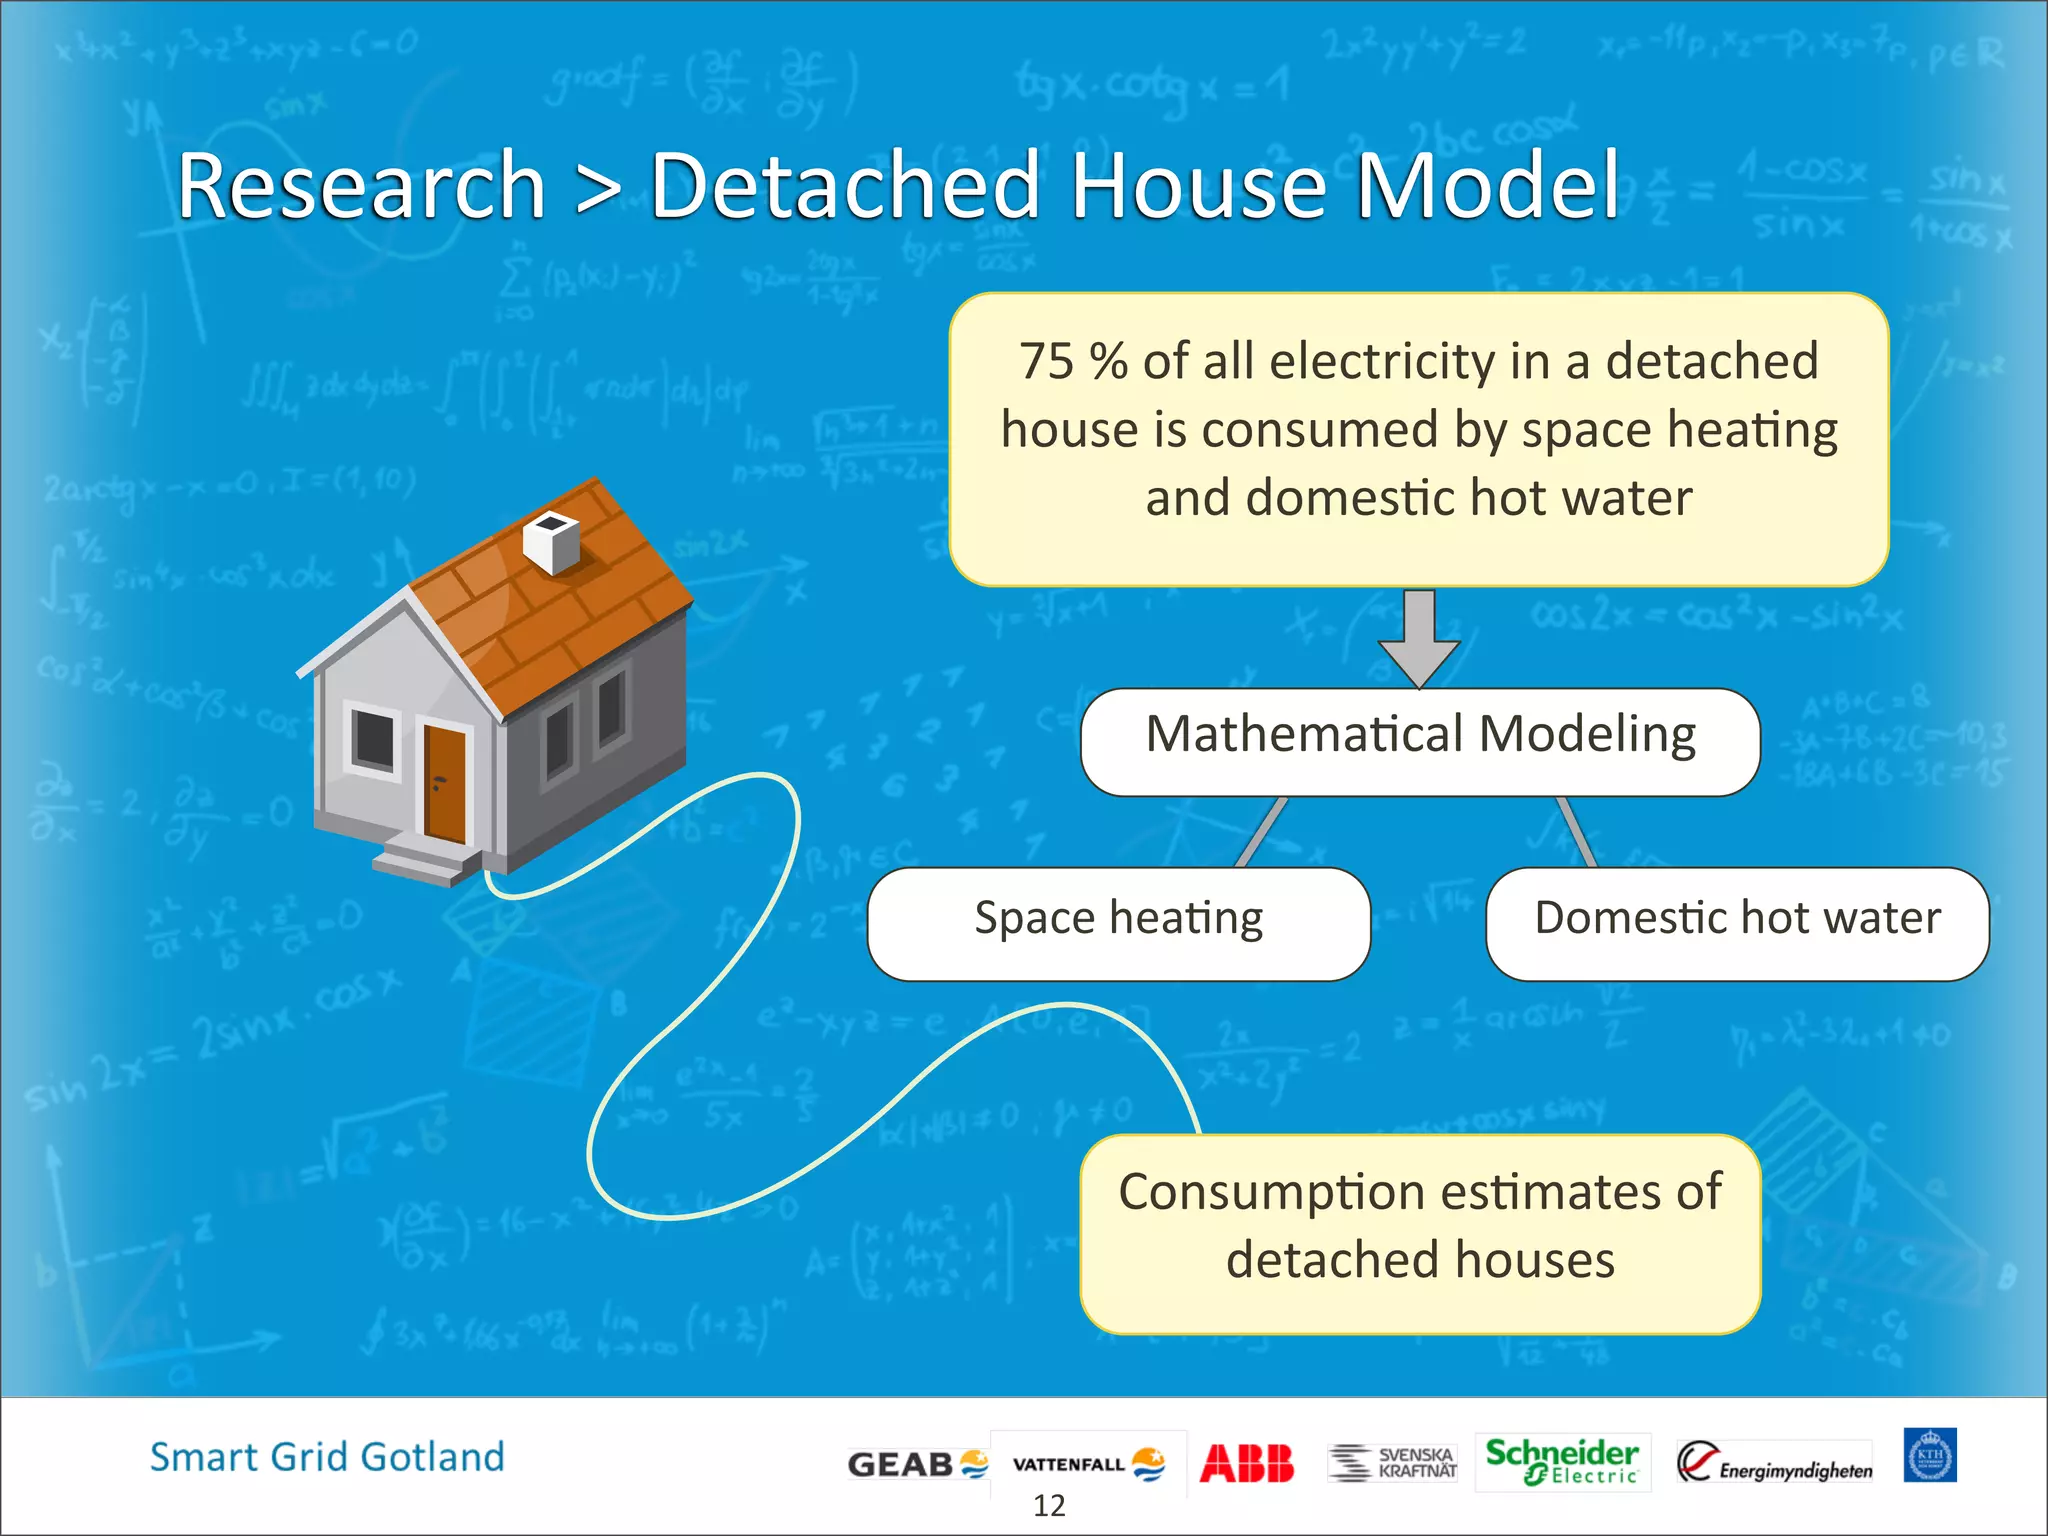
size (w/o Cementa)
x 1900
x 1600 (LT)
x 300 (ST)
Research > Results & Findings
Total power to balance per day and scenario
0,00
5,00
10,00
15,00
20,00
25,00
30,00
35,00
40,00
Scenario 1: Winter days Scenario 2:Spring days Scenario 3: Summer days Scenario 4: Autumn days
Scenarios
Power[MW]
day 1
day 2
day 3
Total number of hourly export problems per day and scenario
6
7
8
Scenario 1: Winter
Scenario 2: Spring
Scenario 3: Summer
Scenario 4: Autumn
17%
20%
23%
16
The minimum number of par4cipants required to
solve all export problems for all scenarios
1300
1500
1700
1100
1000
900
900
1000
1500
1000
900
1700
Minimum
cluster size/day
h](https://image.slidesharecdn.com/danielbrodensggwpipresentation050314-160421084835/75/Smart-Grid-Gotland-Wind-Power-Integration-16-2048.jpg)
![0 12 24 36 48 60 72
16
Time [hours]
Indoor temperature
Less than +/-‐ 1°C
varia4on for all
seasonal scenarios.
Comfort level is kept!
Research > Results & Findings
17%
20%
23%
17
0 12 24 36 48 60 72
16
17
18
19
20
21
22
23
24
25
Time [hours]
Temperature[degeesC]
Indoor temperature change for a LT household participant
Winter
Spring
Summer
Autumn](https://image.slidesharecdn.com/danielbrodensggwpipresentation050314-160421084835/75/Smart-Grid-Gotland-Wind-Power-Integration-17-2048.jpg)
![0 12 24 36 48 60 72
16
Time [hours]
Tank temperature
Varia4ons are
within the
boundaries
for all scenarios.
Comfort level is kept!
Research > Results & Findings
18
Autumn
Summer
Spring
Winter
Tank temperature change for LT household participant
Tanktemperature[degeesC]
Time [hours]
0 12 24 36 48 60 72
40
50
60
70
80
90
100
110
120
130
Figure 12:
17%
20%
23%](https://image.slidesharecdn.com/danielbrodensggwpipresentation050314-160421084835/75/Smart-Grid-Gotland-Wind-Power-Integration-18-2048.jpg)
![BESS opera4on
(winter scenario)
No wind curtailment
needed in this
scenario
Research > Results & Findings
17%
20%
23%
19
Max BESS capacity
Wind curtailment
BESS level
Power[kW]
Time [hours]
0 12 24 36 48 60 72
0
50
100
150
200
250
300
h
BESS charges to account for prognosis errors not
accounted by the DR par4cipants](https://image.slidesharecdn.com/danielbrodensggwpipresentation050314-160421084835/75/Smart-Grid-Gotland-Wind-Power-Integration-19-2048.jpg)
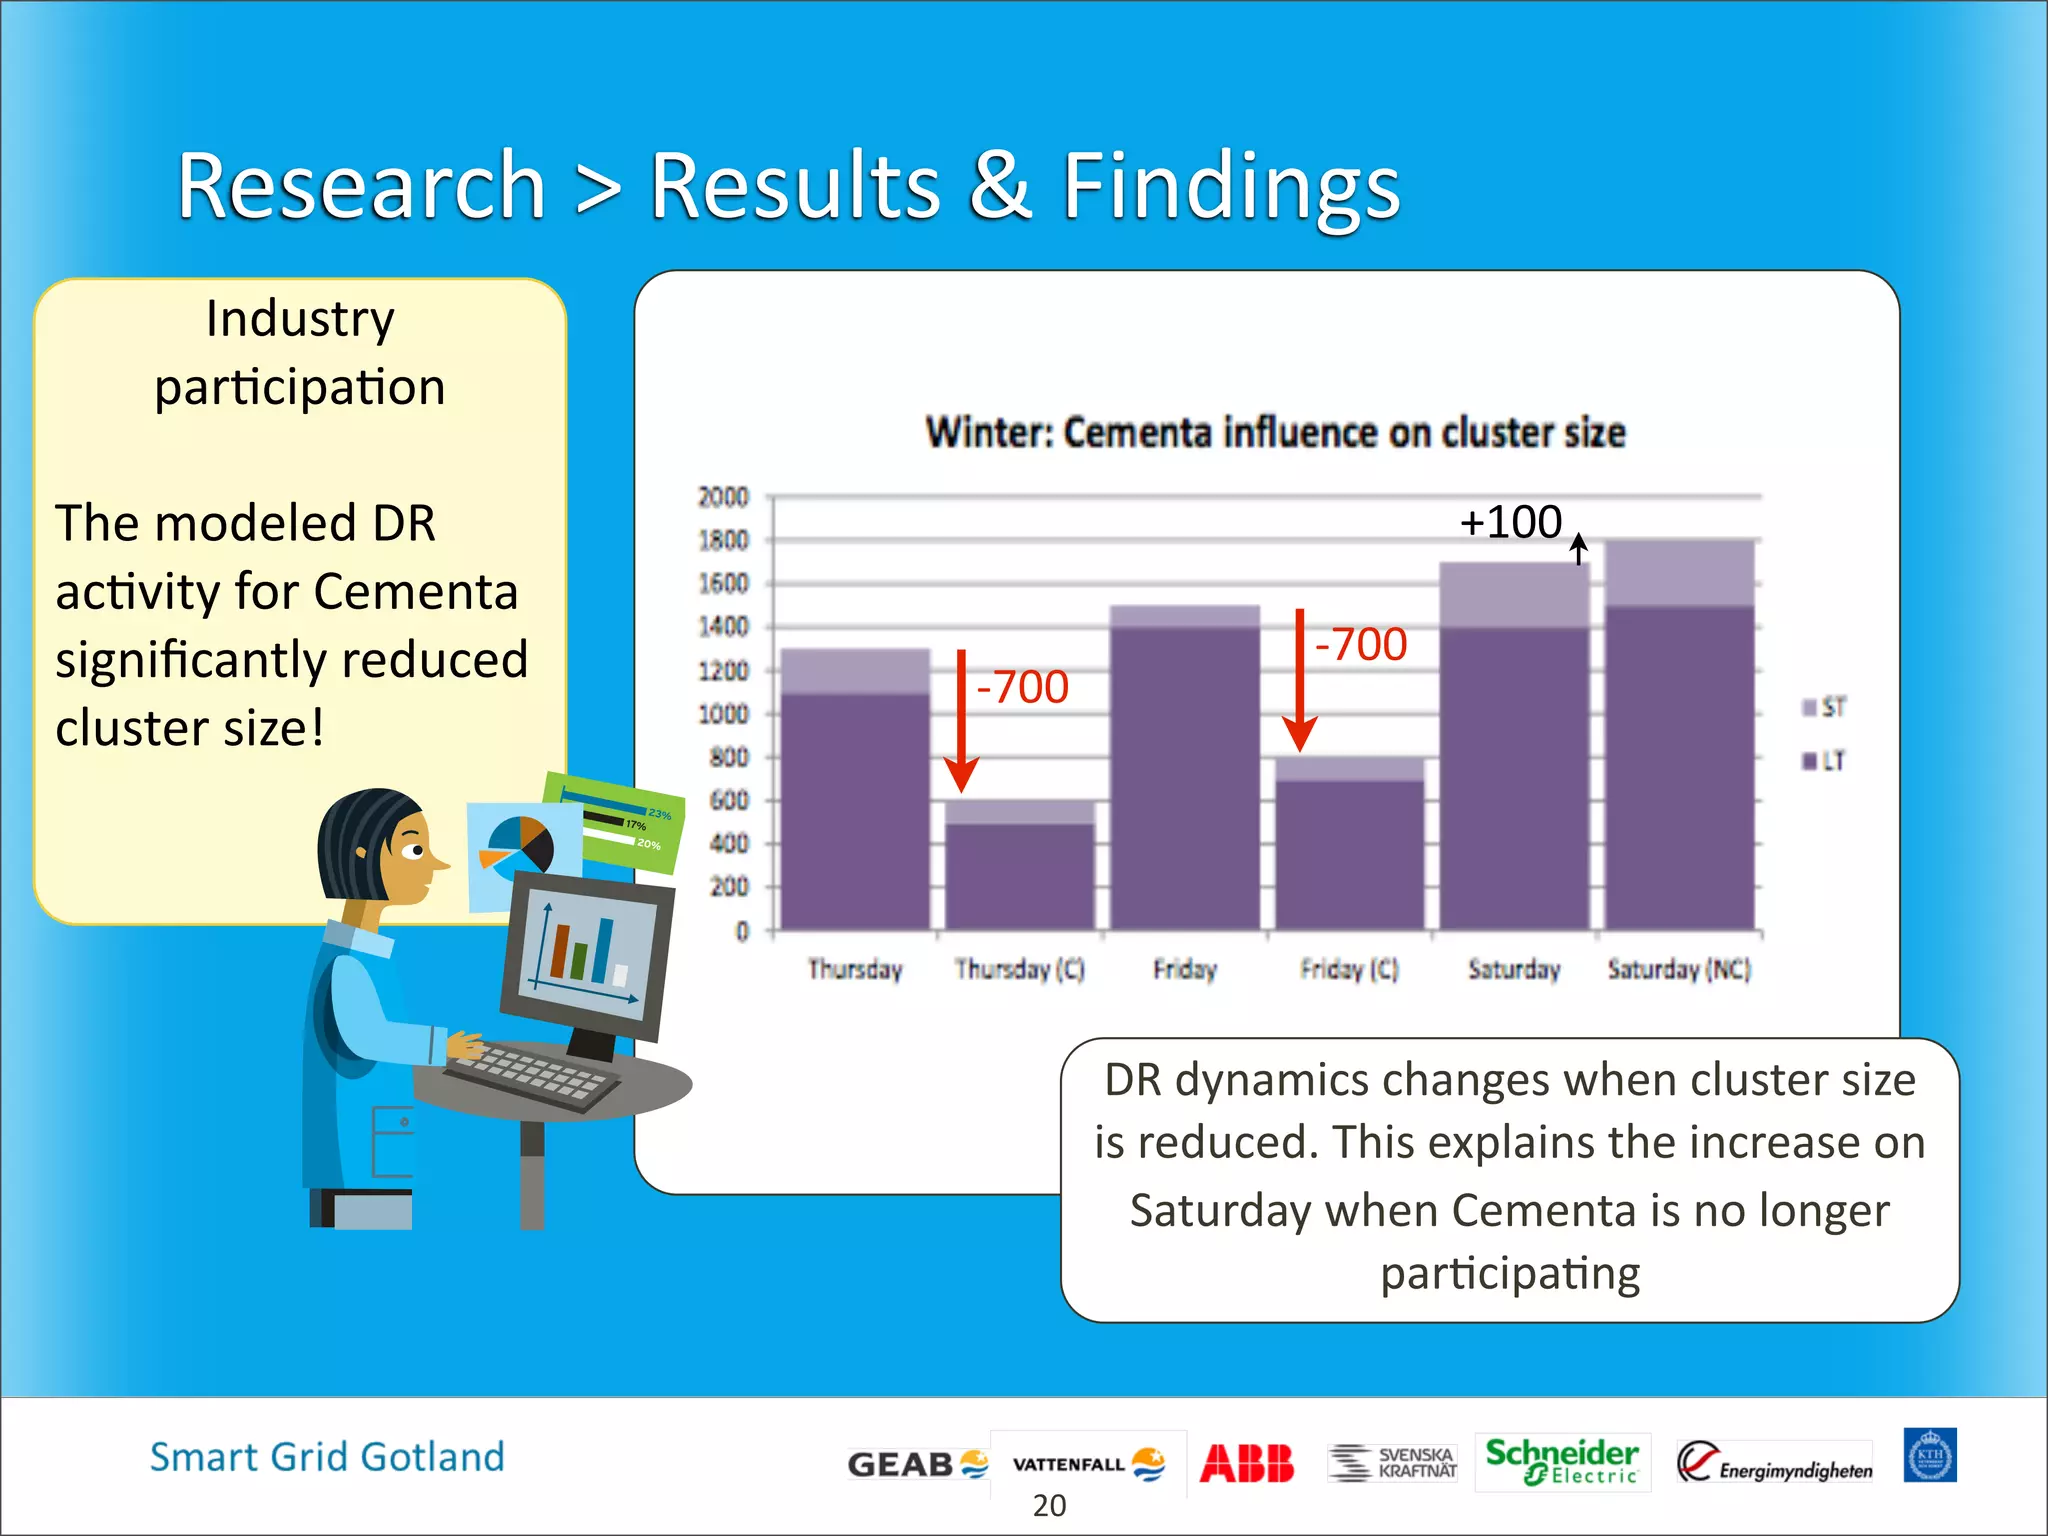

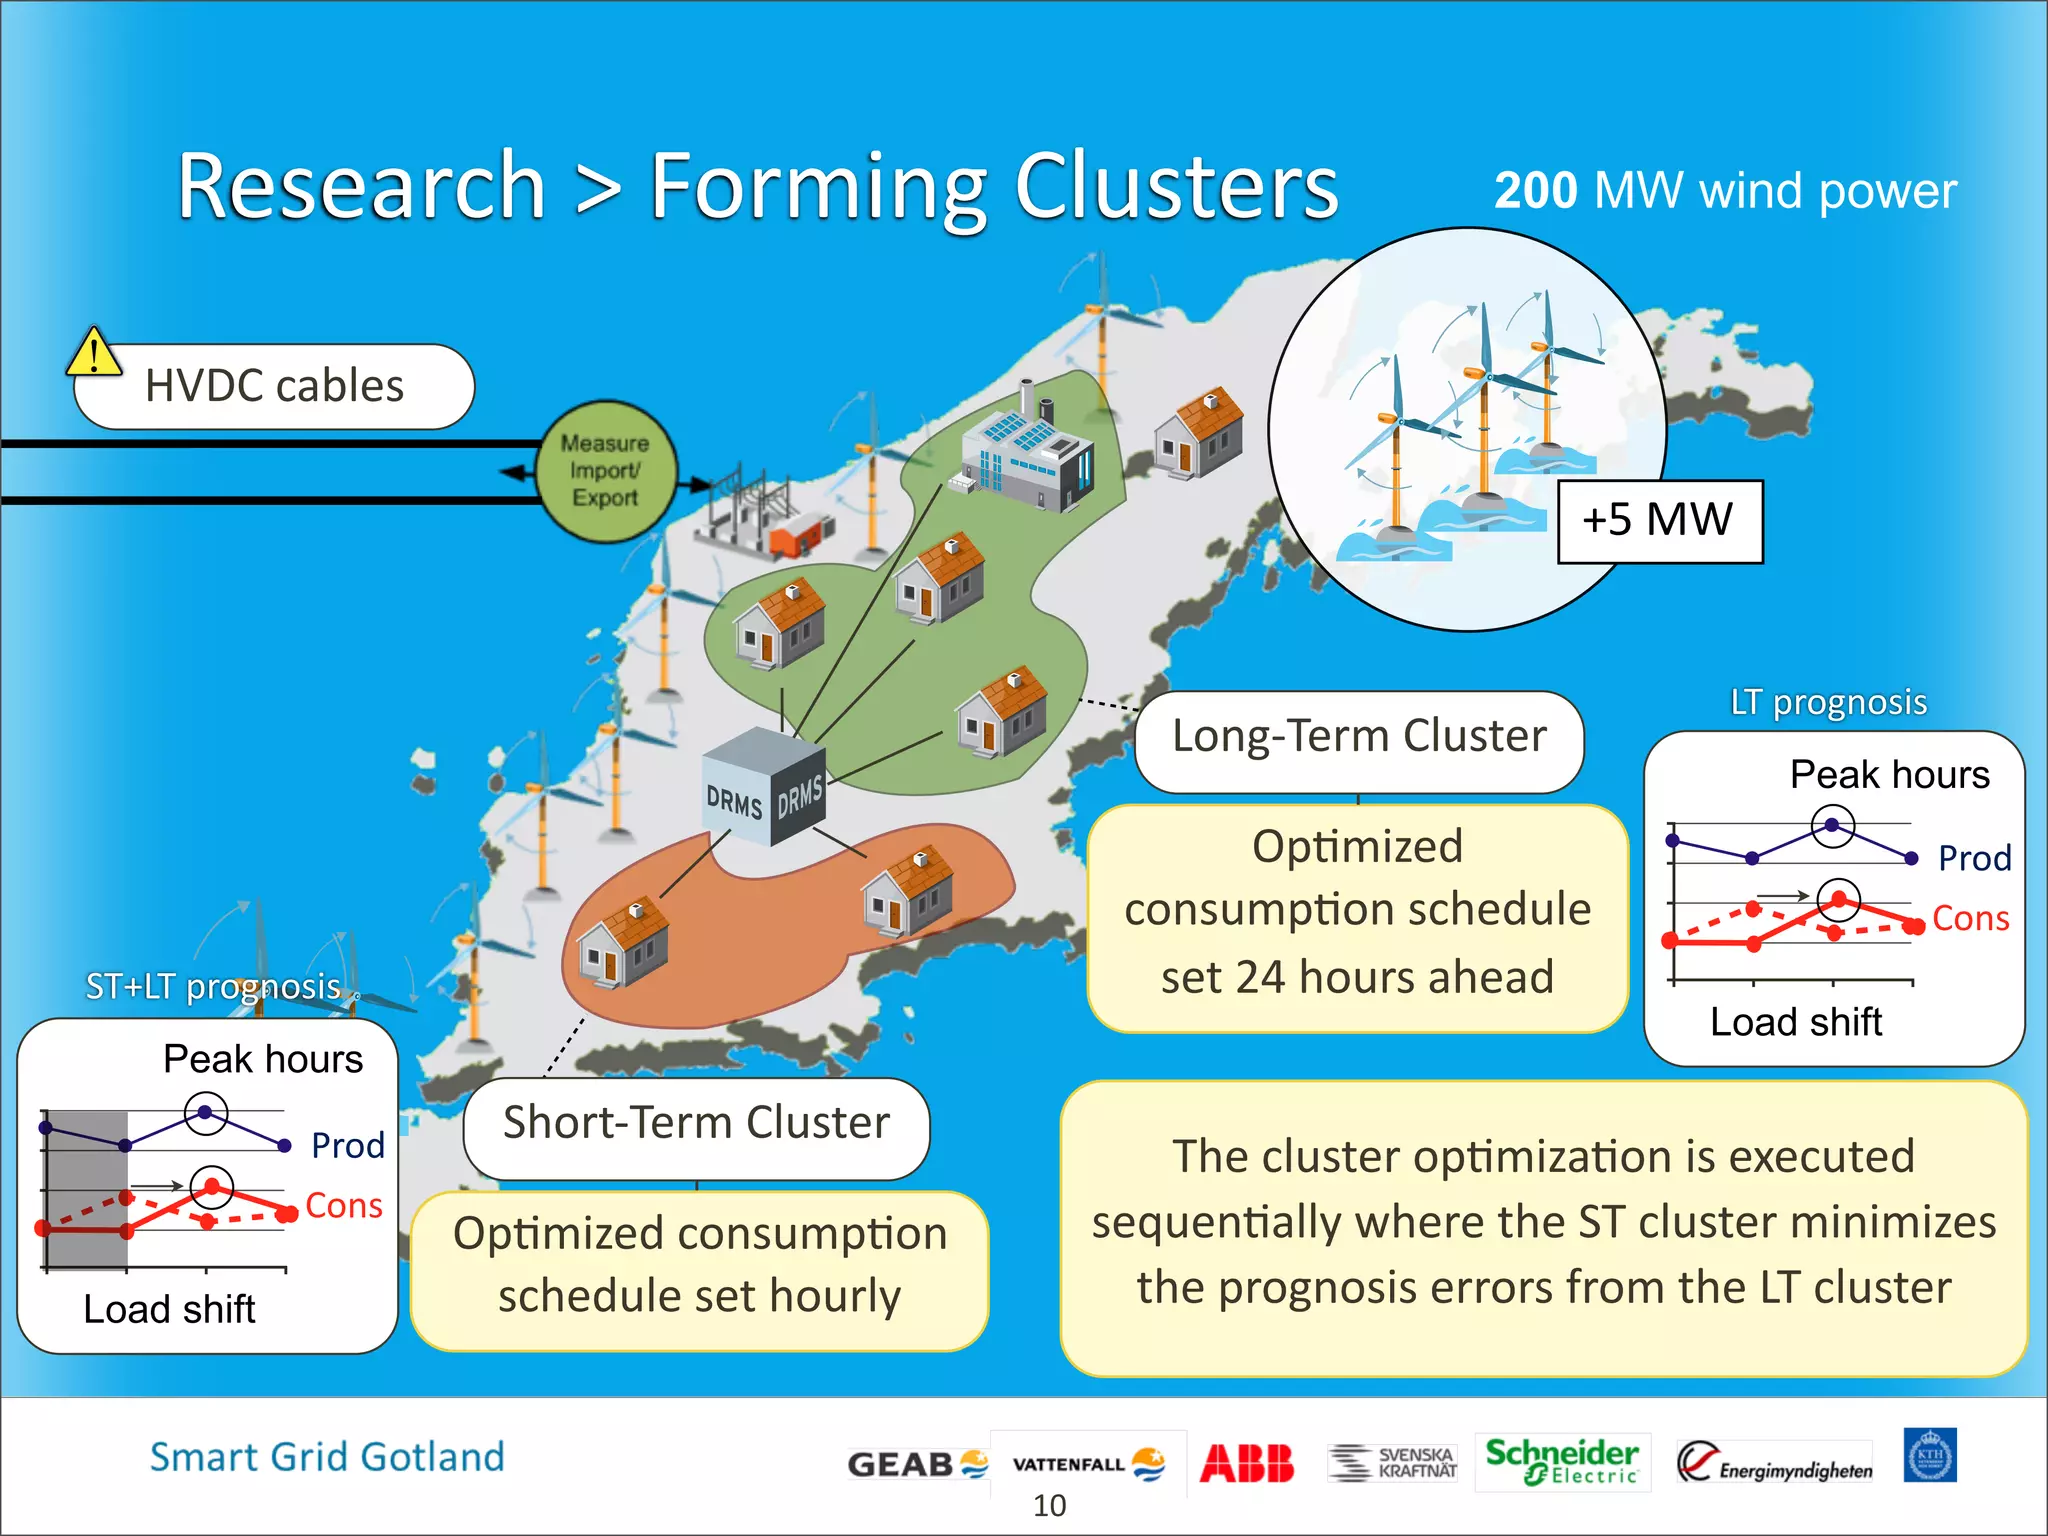
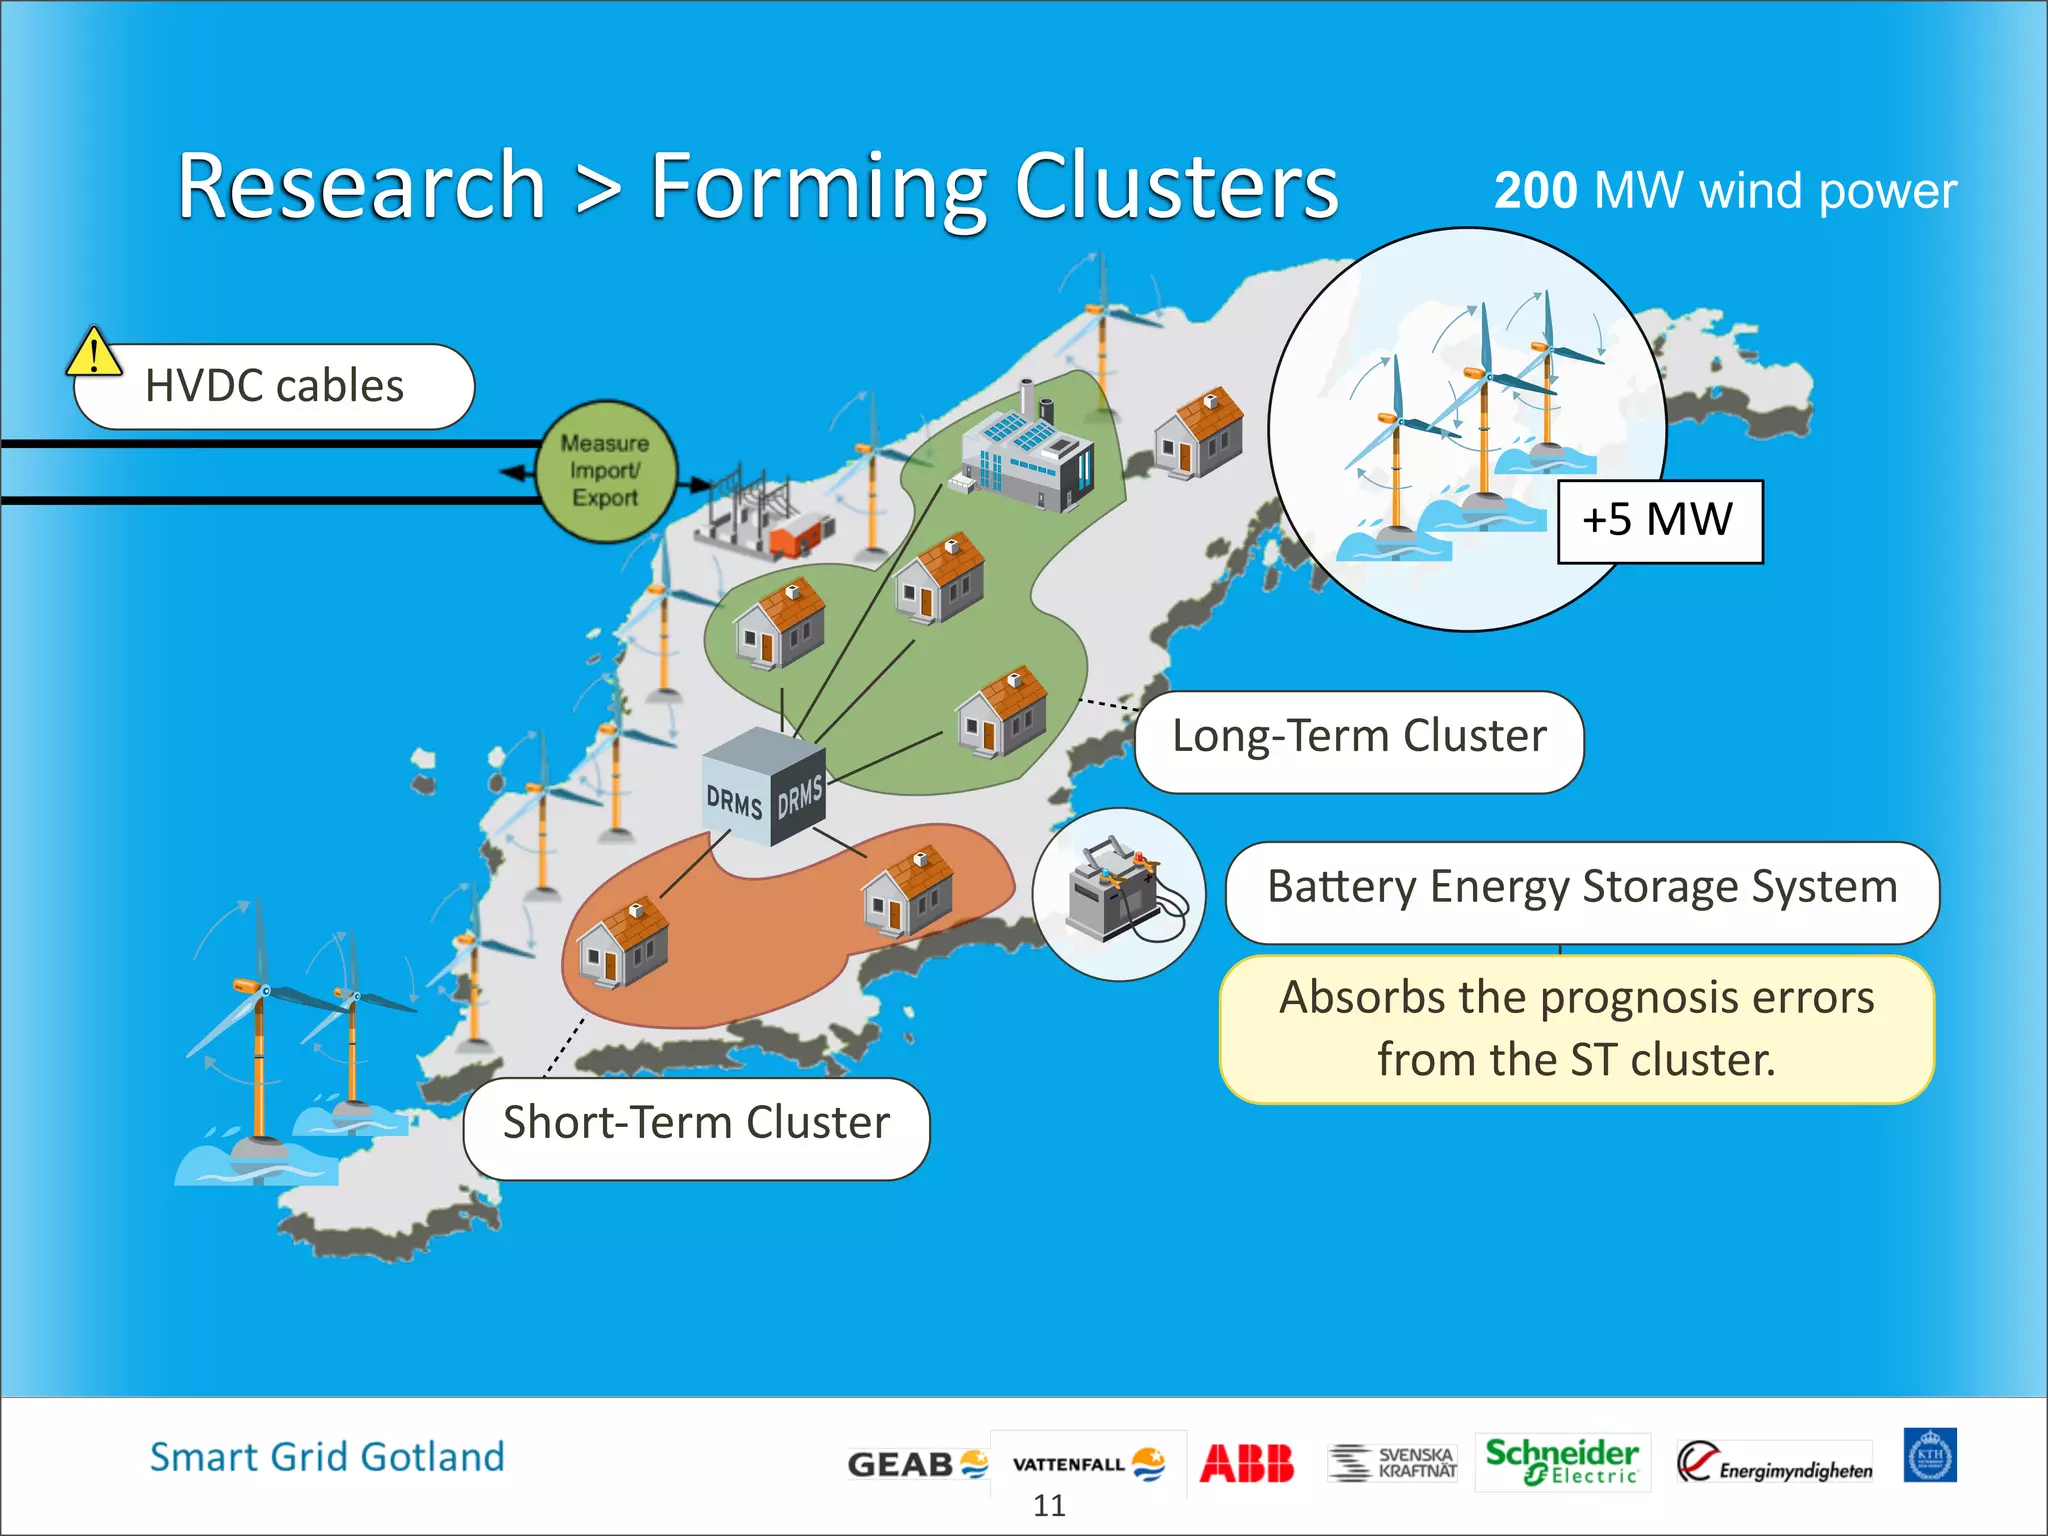
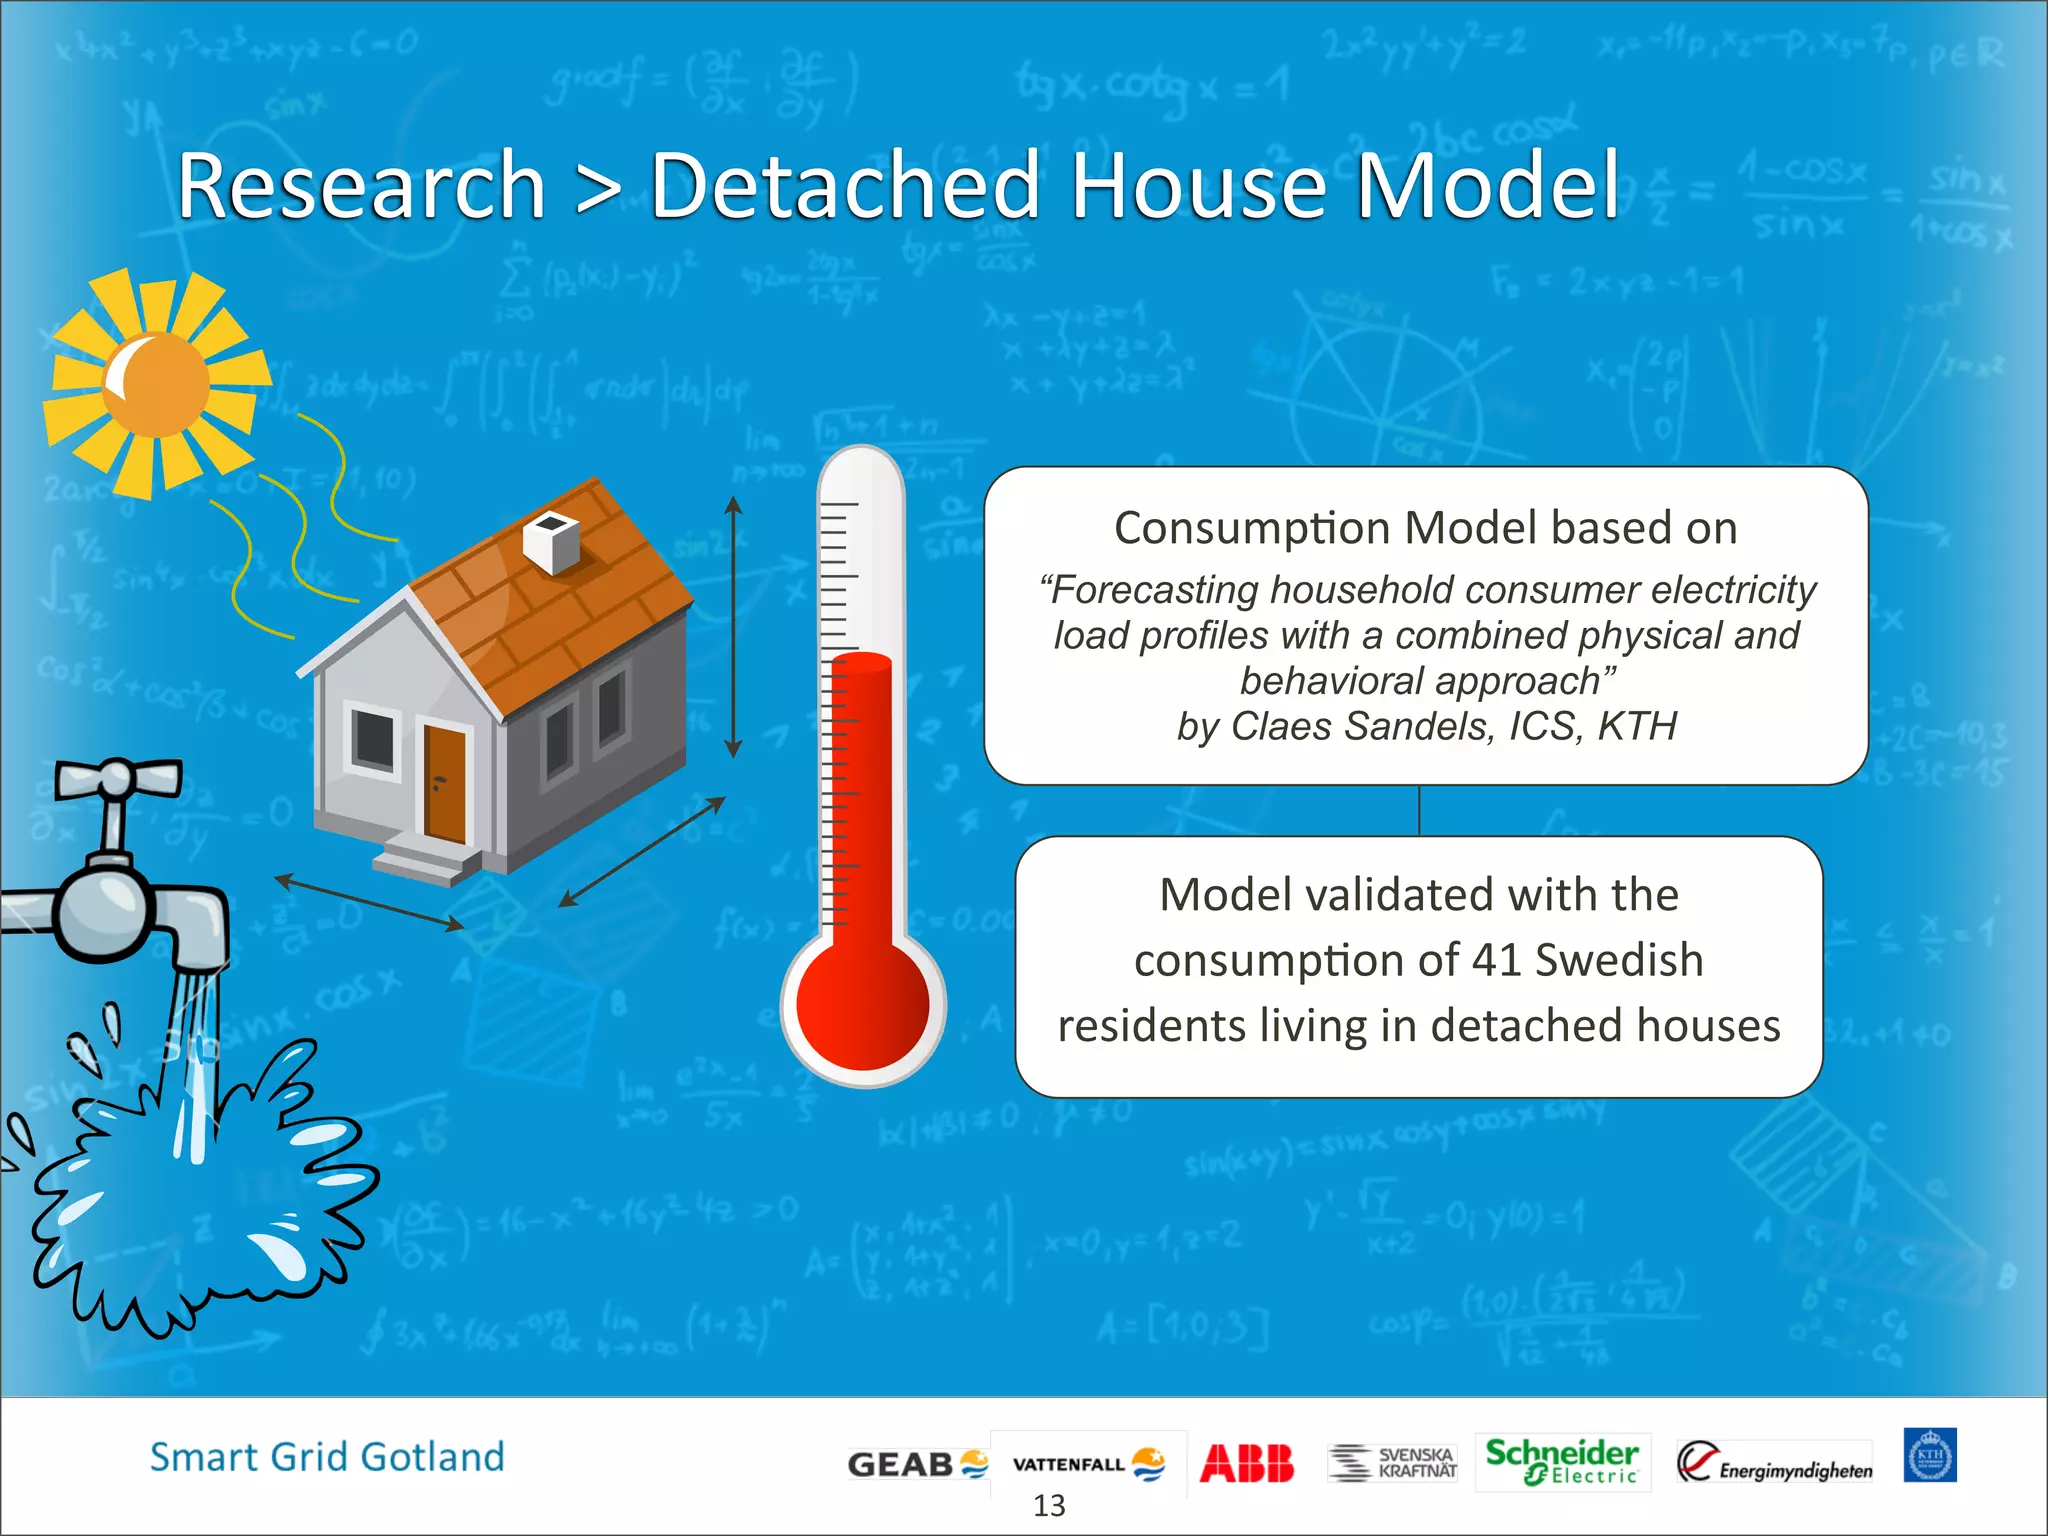
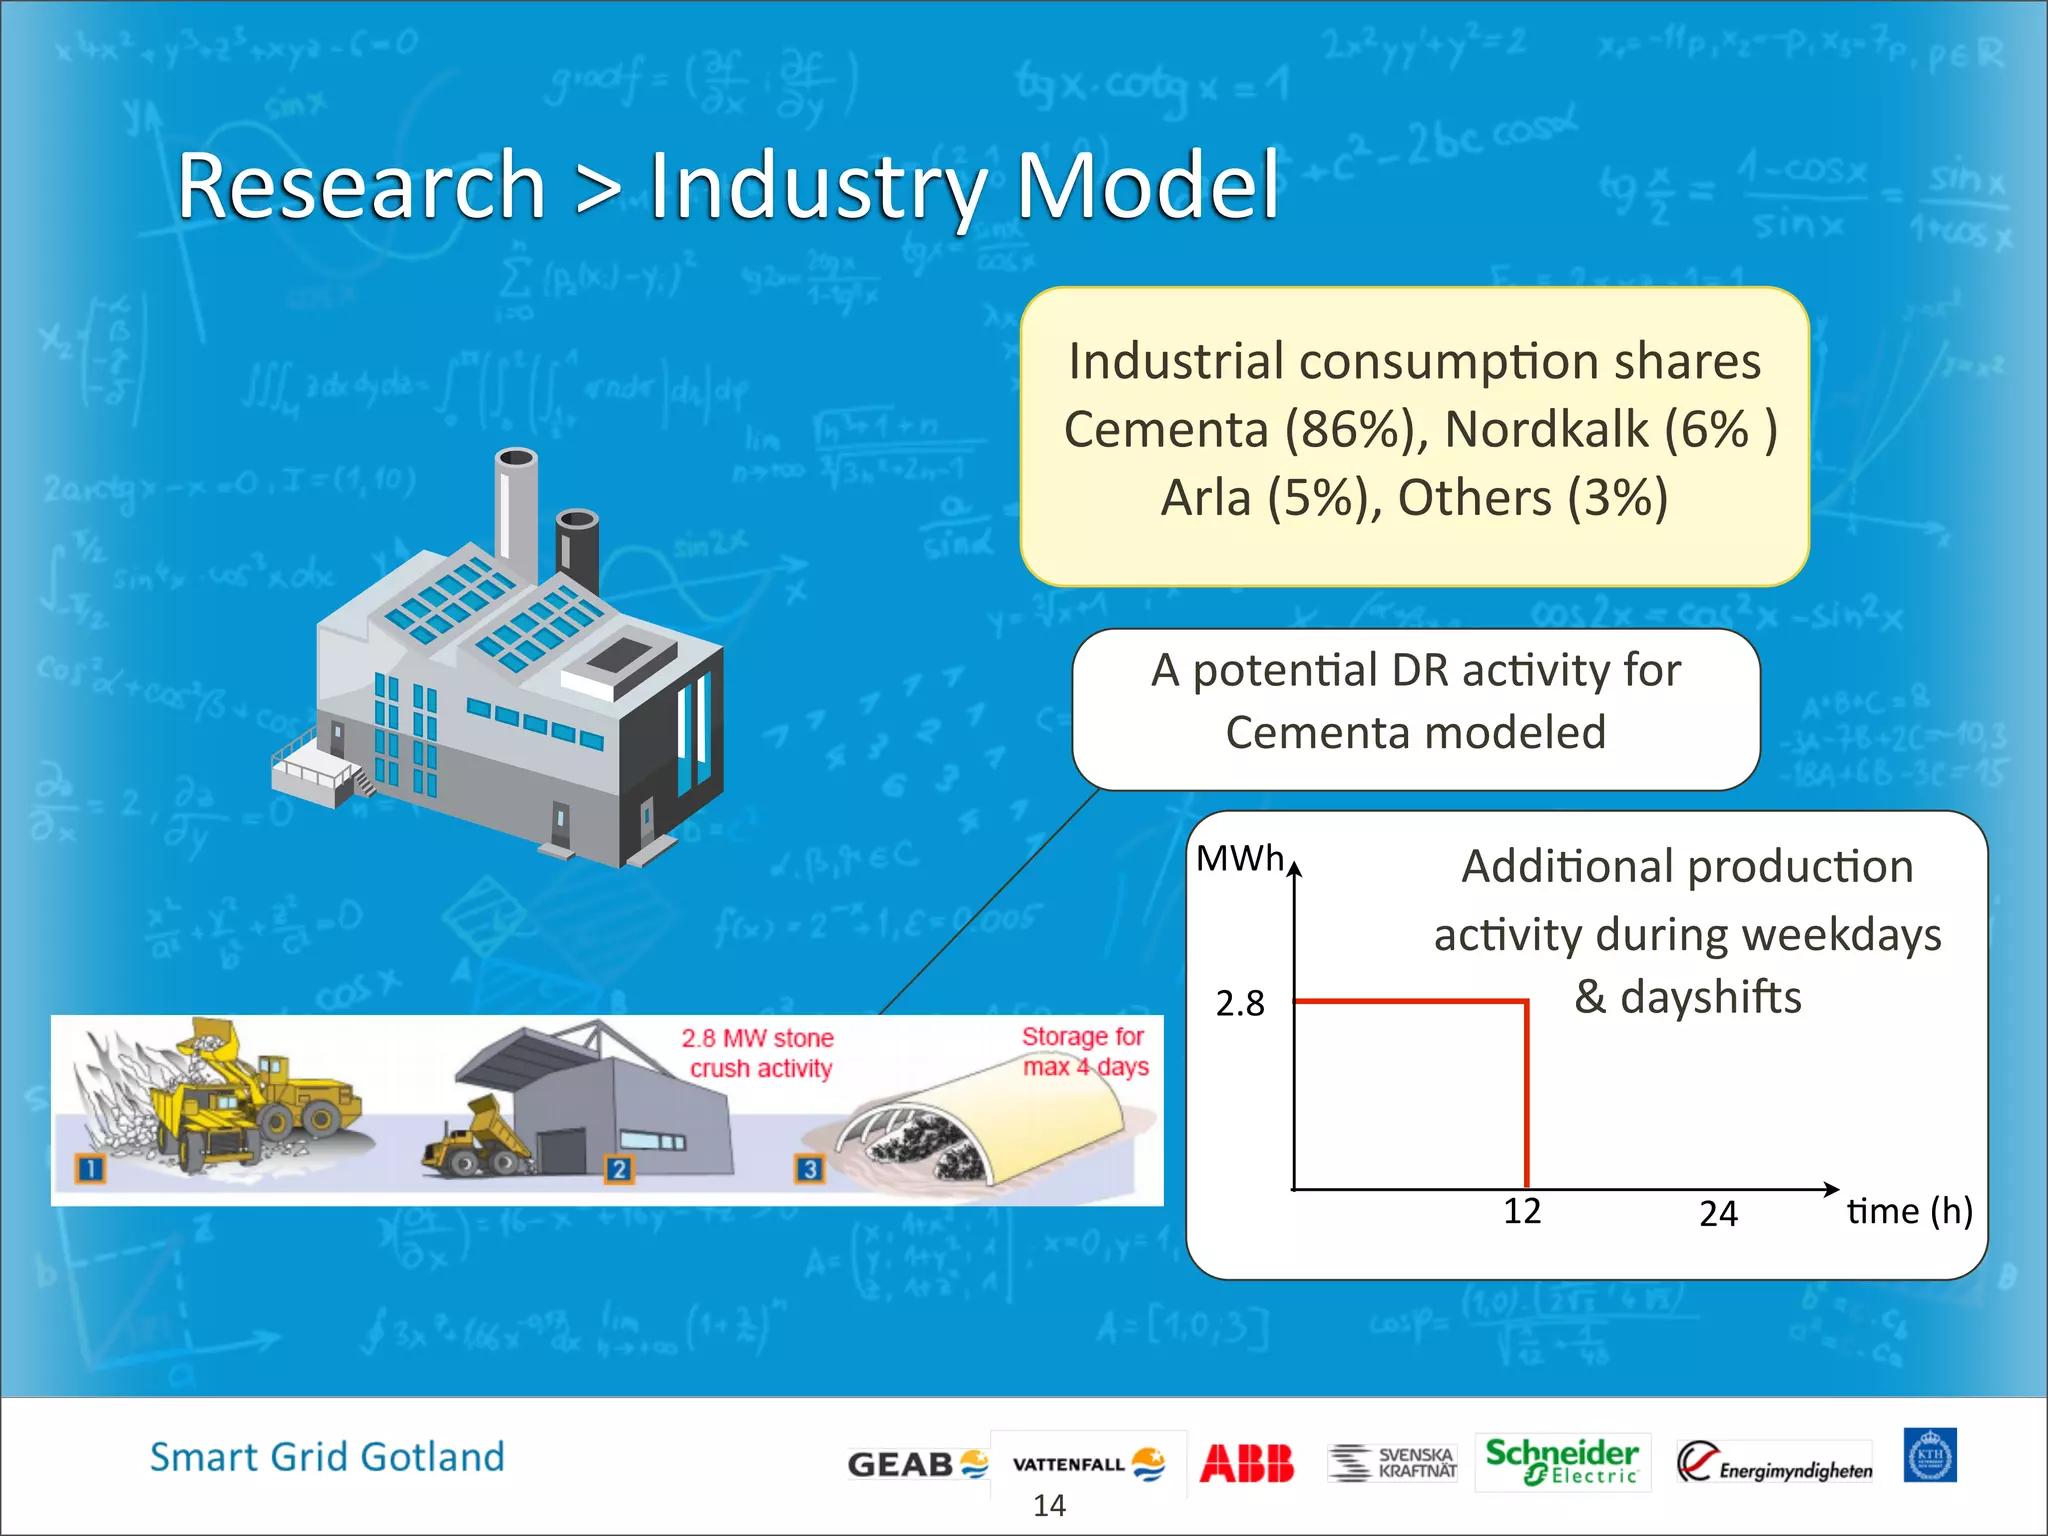
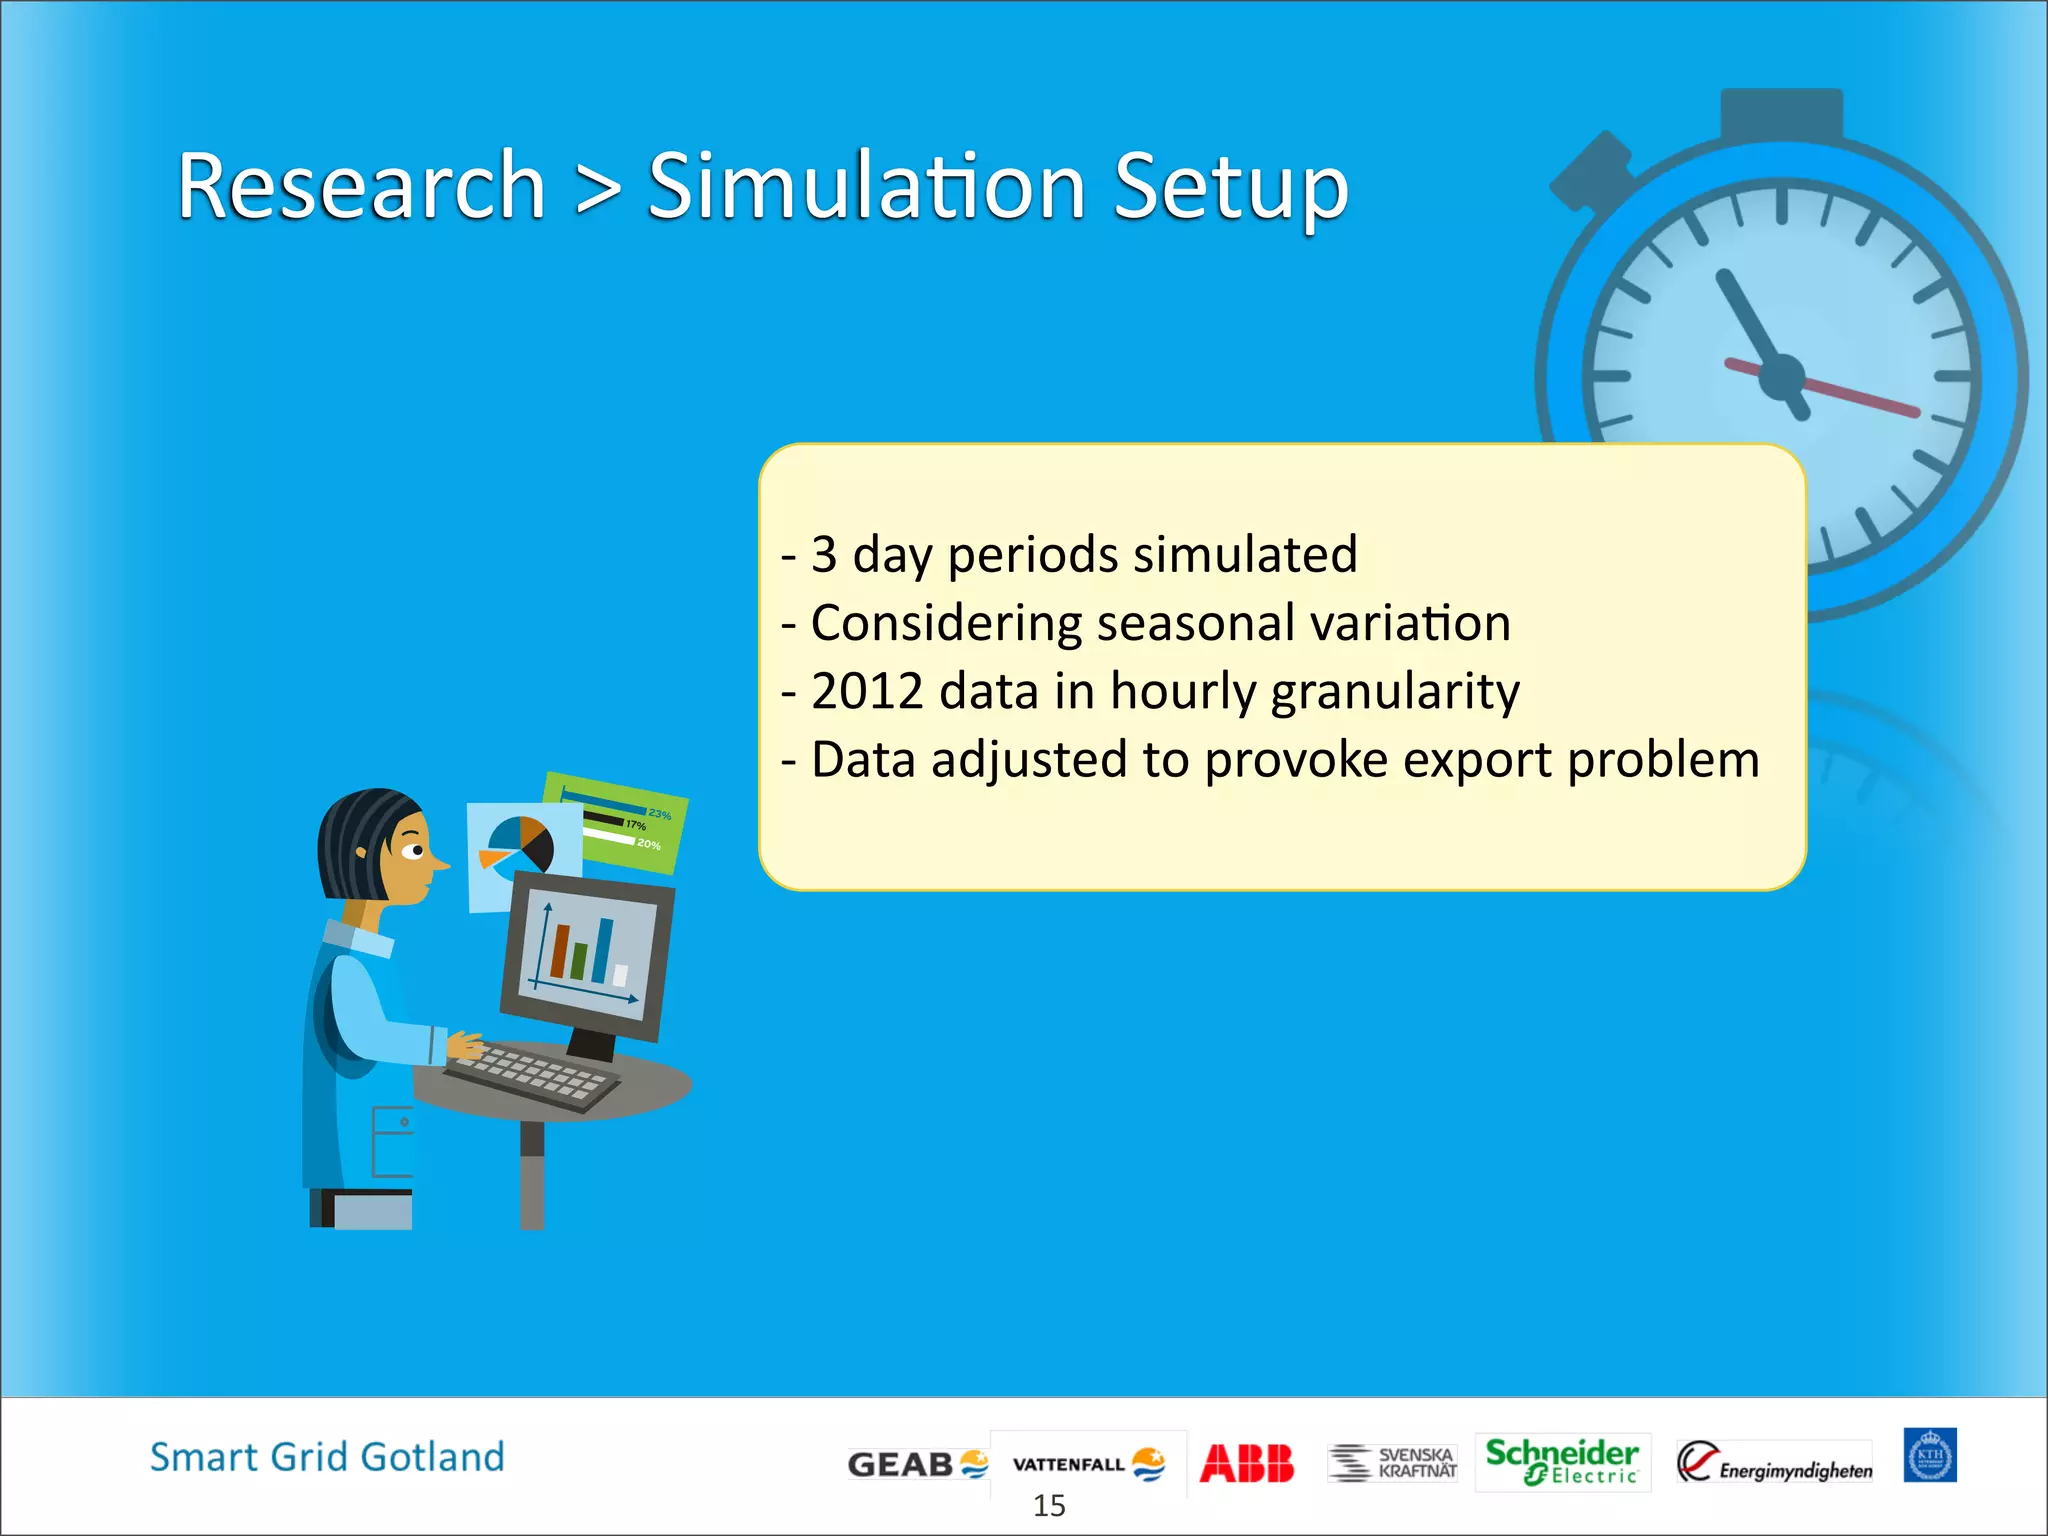
1) The document discusses a research project analyzing how distributed demand response (DR) resources on the island of Gotland could help integrate additional wind power capacity into the local distribution network. 2) The research used real wind power and load data from 2012 to model different DR clusters and scenarios, including detached houses, industries and an energy storage system. 3) The results found that a minimum of 1300-1700 DR participants could help balance up to 5 MW of additional wind power across different seasons and scenarios while maintaining customer comfort levels. Participation from large industries further reduced the required cluster size. 4) While the study had some limitations, it demonstrated the potential benefits of DR for the Smart Grid Gotland project's objectives


