Download as PDF, PPTX
![Swedish DH systems
Source: Statistics Sweden & Swedish Energy Agency
0
10
20
30
40
50
60
70
1970
1975
1980
1985
1990
1995
2000
2005
2010
Fueluse[TWh]
Excess heat
Heat pumps
Electric boilers
Biofuels, Municipal solid
waste, peat
Energy coal including coke
oven and blast furnace gas
Natural gas including LPG
Oil
0
10
20
30
40
50
1980 1985 1990 1995 2000 2005 2010
Fuelsupply[TWh]
Peat
Tall oil pitch
Forest residues
Municipal solid waste
(MSW)
0
10
20
30
40
50
60
70
1970
1975
1980
1985
1990
1995
2000
2005
2010
Fueluse[TWh]
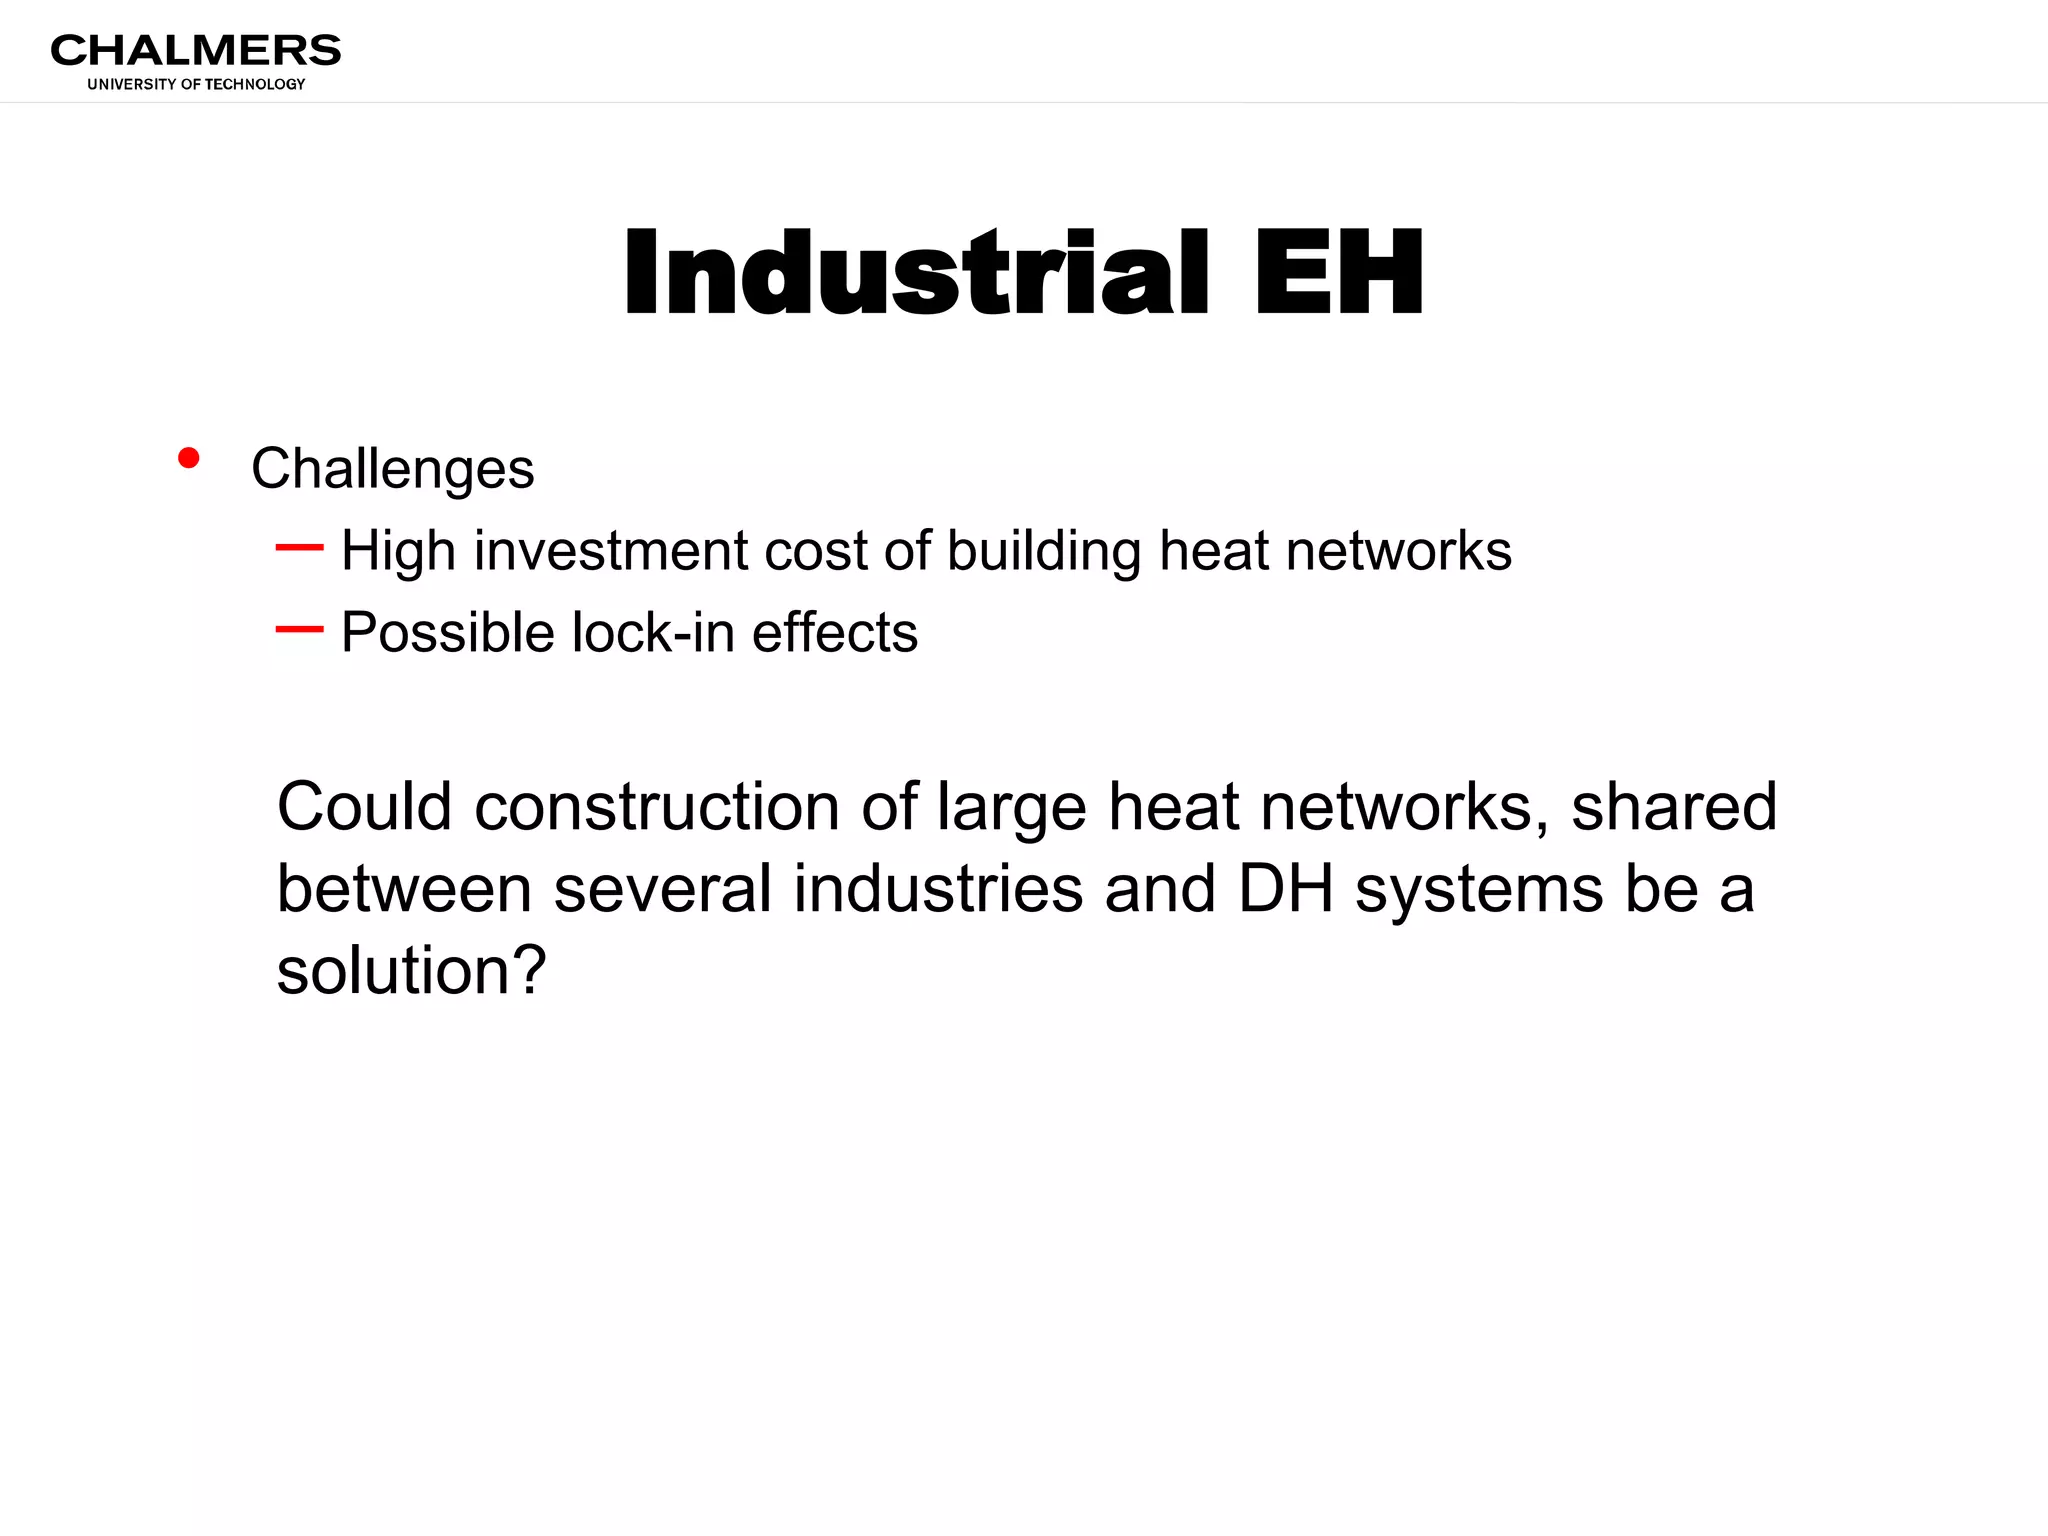
Industrial EH
Heat pumps
Electric boilers
Biofuels, Municipal solid
waste, peat
Energy coal including coke
oven and blast furnace gas
Natural gas including LPG
Oil](https://image.slidesharecdn.com/7presentationincopenhagen-20141117as-150530090824-lva1-app6892/75/Economic-impact-of-large-scale-utilisation-of-excess-heat-assessment-through-regional-modelling-3-2048.jpg)

![SKG pipeline
Cap≤ 50 MW 1800/ 0.25 Cap≤ 50 MW 1100/ 0.25
50˂Cap≤ 100 MW 2200/ 0.12 50˂Cap≤ 100 MW 1200/0.12
100˂Cap≤ 150 MW 2600/ 0.08 100˂Cap≤ 150 MW 1300/ 0.08
Length km
SK pipeline
Investment/ Variable
O&M Cost
[EUR/m]/
[EUR/MWh
heat]
Cap≤ 50 MW 1800/ 0.16 Cap≤ 50 MW 1100/ 0.16
Length km
EH-CCIS extraction
Cap ≤ 20 MW 4.4 Cap ≤ 20 MW 4.4
20˂Cap ≤ 40 MW 6.7 20˂Cap ≤ 40 MW 6.7
40˂Cap ≤ 60 MW 12.8 40˂Cap ≤ 60 MW 12.8
60˂Cap ≤ 80 MW 20.6 60˂Cap ≤ 80 MW 20.6
80˂Cap ≤ 100 MW 26.7 80˂Cap ≤ 100 MW 26.7
100˂Cap ≤ 120 MW 37.8 100˂Cap ≤ 120 MW 37.8
120˂Cap ≤ 140 MW 51.1 120˂Cap ≤ 140 MW 51.1
140˂Cap ≤ 150 MW 61.1 140˂Cap ≤ 150 MW 61.1
450PPM and NEWPOL LIC
55
Investment/ Variable
O&M Cost
[EUR/m]/
[EUR/MWh
heat]
55
Investment cost
(80/50 hot water)
MEUR
35 35](https://image.slidesharecdn.com/7presentationincopenhagen-20141117as-150530090824-lva1-app6892/75/Economic-impact-of-large-scale-utilisation-of-excess-heat-assessment-through-regional-modelling-27-2048.jpg)
![DH technologies
Gas CC CHP 45-49 90 0.8-1.2 1 2.5
Gas Engine CHP 38 86 0.75 4.3
Biomass ST CHP 25-34 110 2.3-7.2 1.5 2.7
Waste ST CHP 22 91 5.9-8.2 3 -12
Gas HOB 0.05-1.0 2.5 0.7
Biomass HOB 0.34-0.56 1.5 2.0
Oil HOB 0.09-0.17 2.5 0.7
Waste HOB 1.0-1.1 3 -16
Heat pump 0.70 0.5 0.7
[MEUR/year] [EUR/MWh fuel]
Bio-refinery plants
SNG (iii) 2 3
[EUR/MWh fuel]
Heat plants
Fixed O&M cost Variable O&M cost
Electricity [%] Total [%] [kEUR/kW electricity] [% of inv. cost/year] [EUR/MWh fuel]
Heat [%] [kEUR/kW heat]
Specific investment
cost (ii)
Combined heat and power plants
91
SNG [%]
70
300 (COP)
[% of inv. cost/year]
90
Technology Conversion efficiency (i)
110
90](https://image.slidesharecdn.com/7presentationincopenhagen-20141117as-150530090824-lva1-app6892/75/Economic-impact-of-large-scale-utilisation-of-excess-heat-assessment-through-regional-modelling-28-2048.jpg)


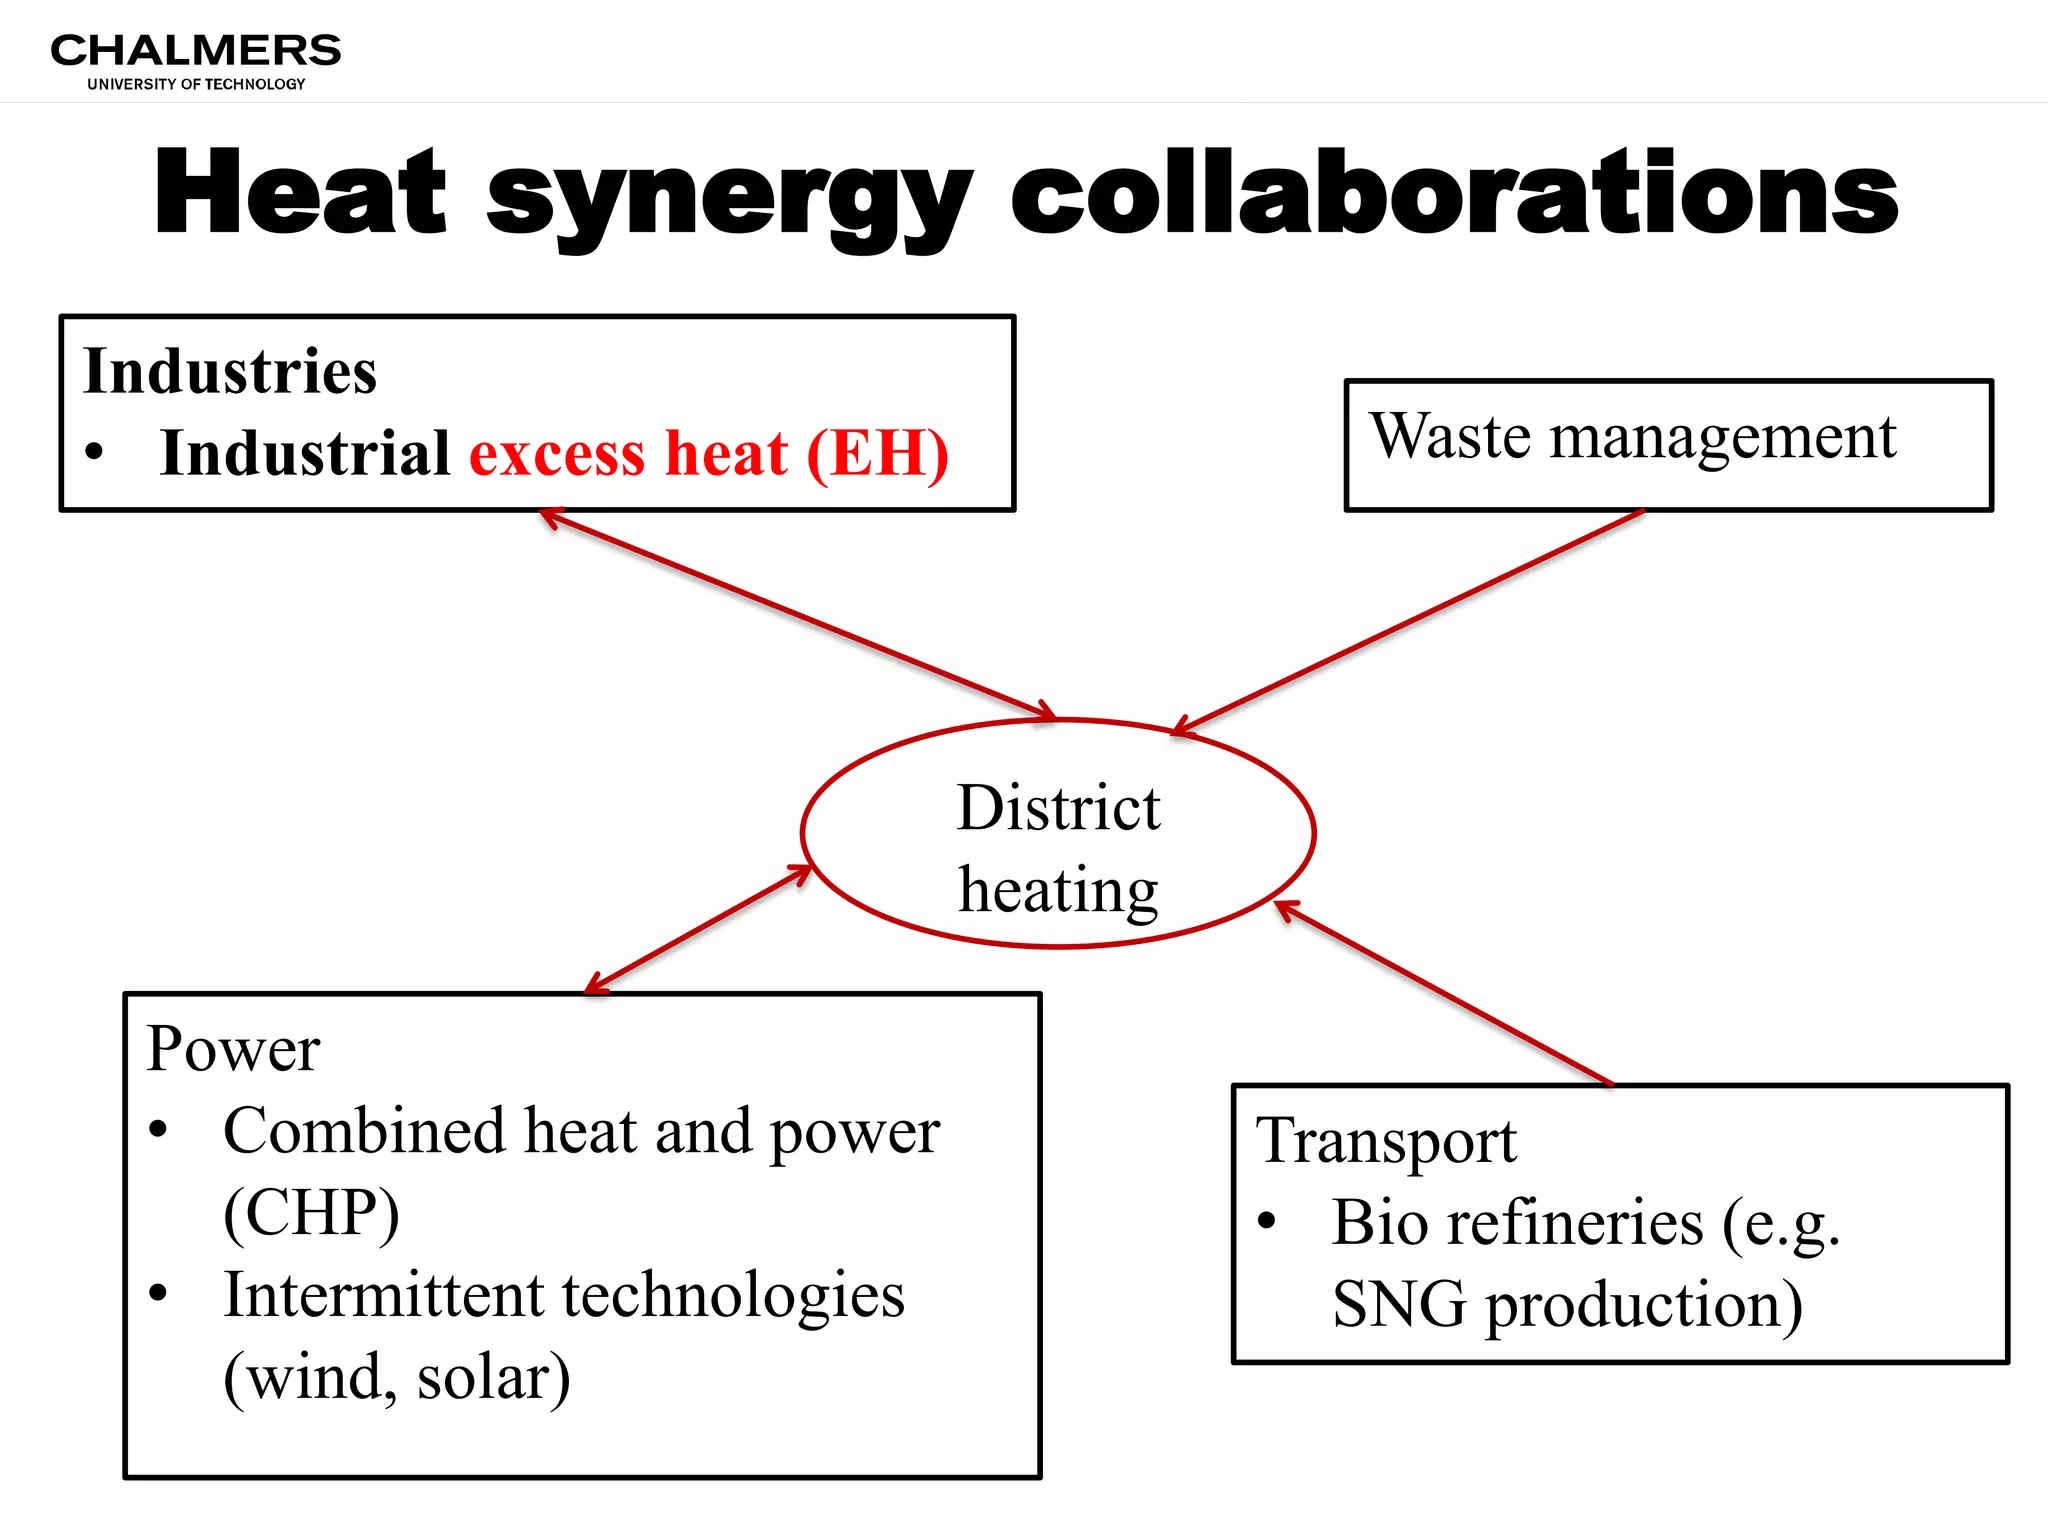
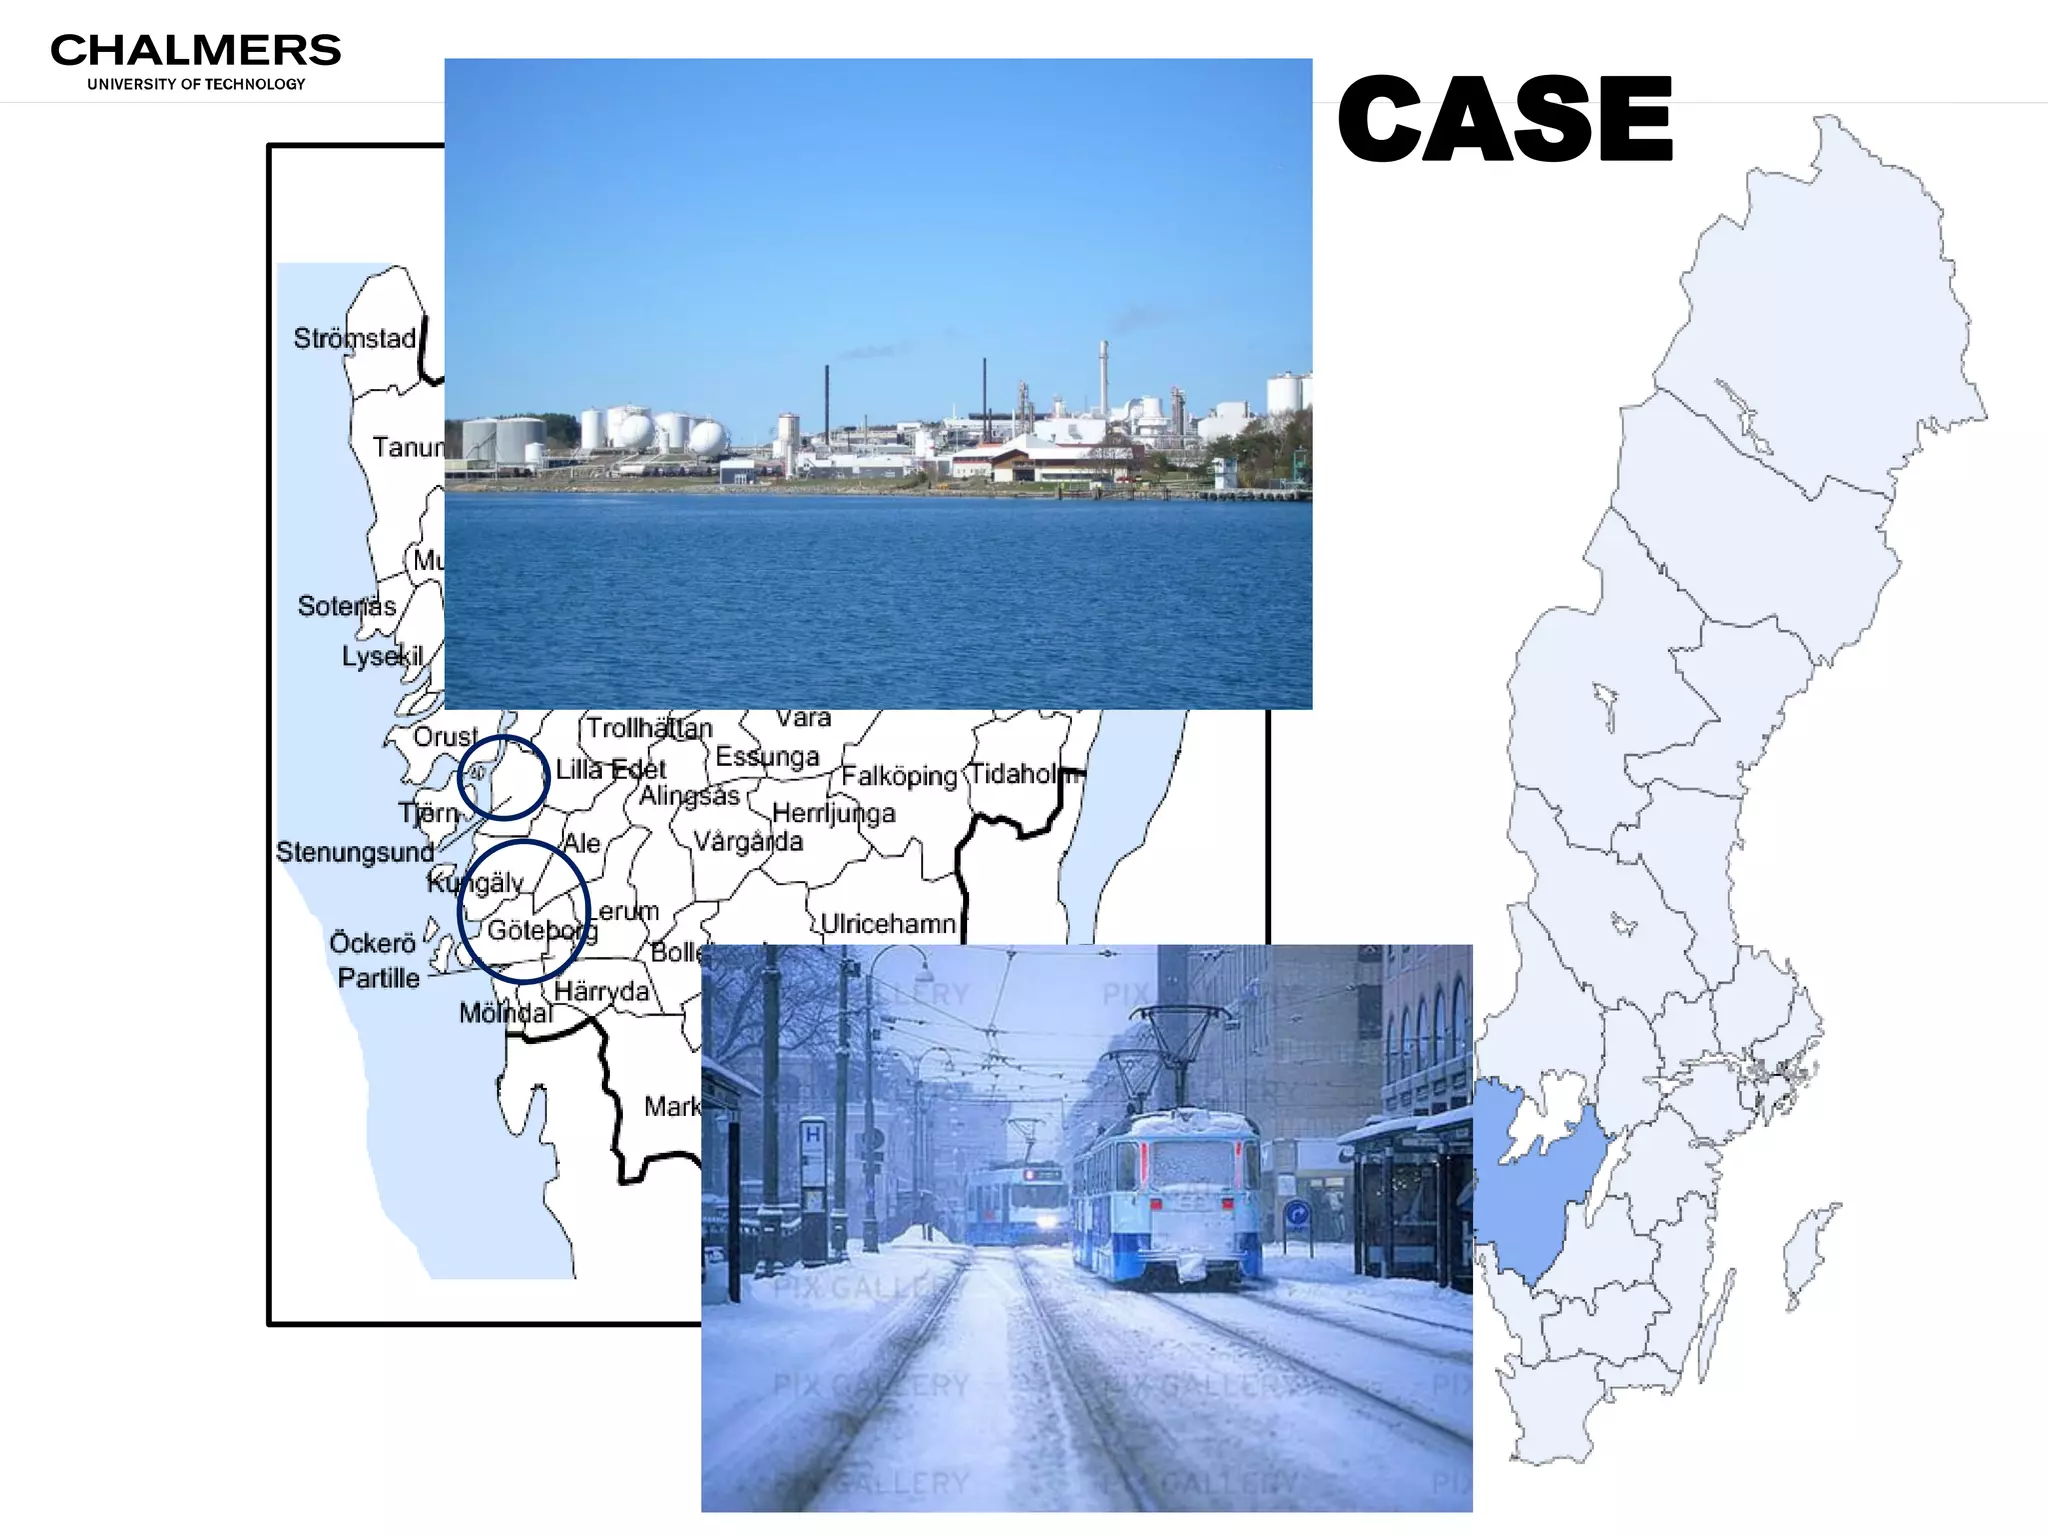
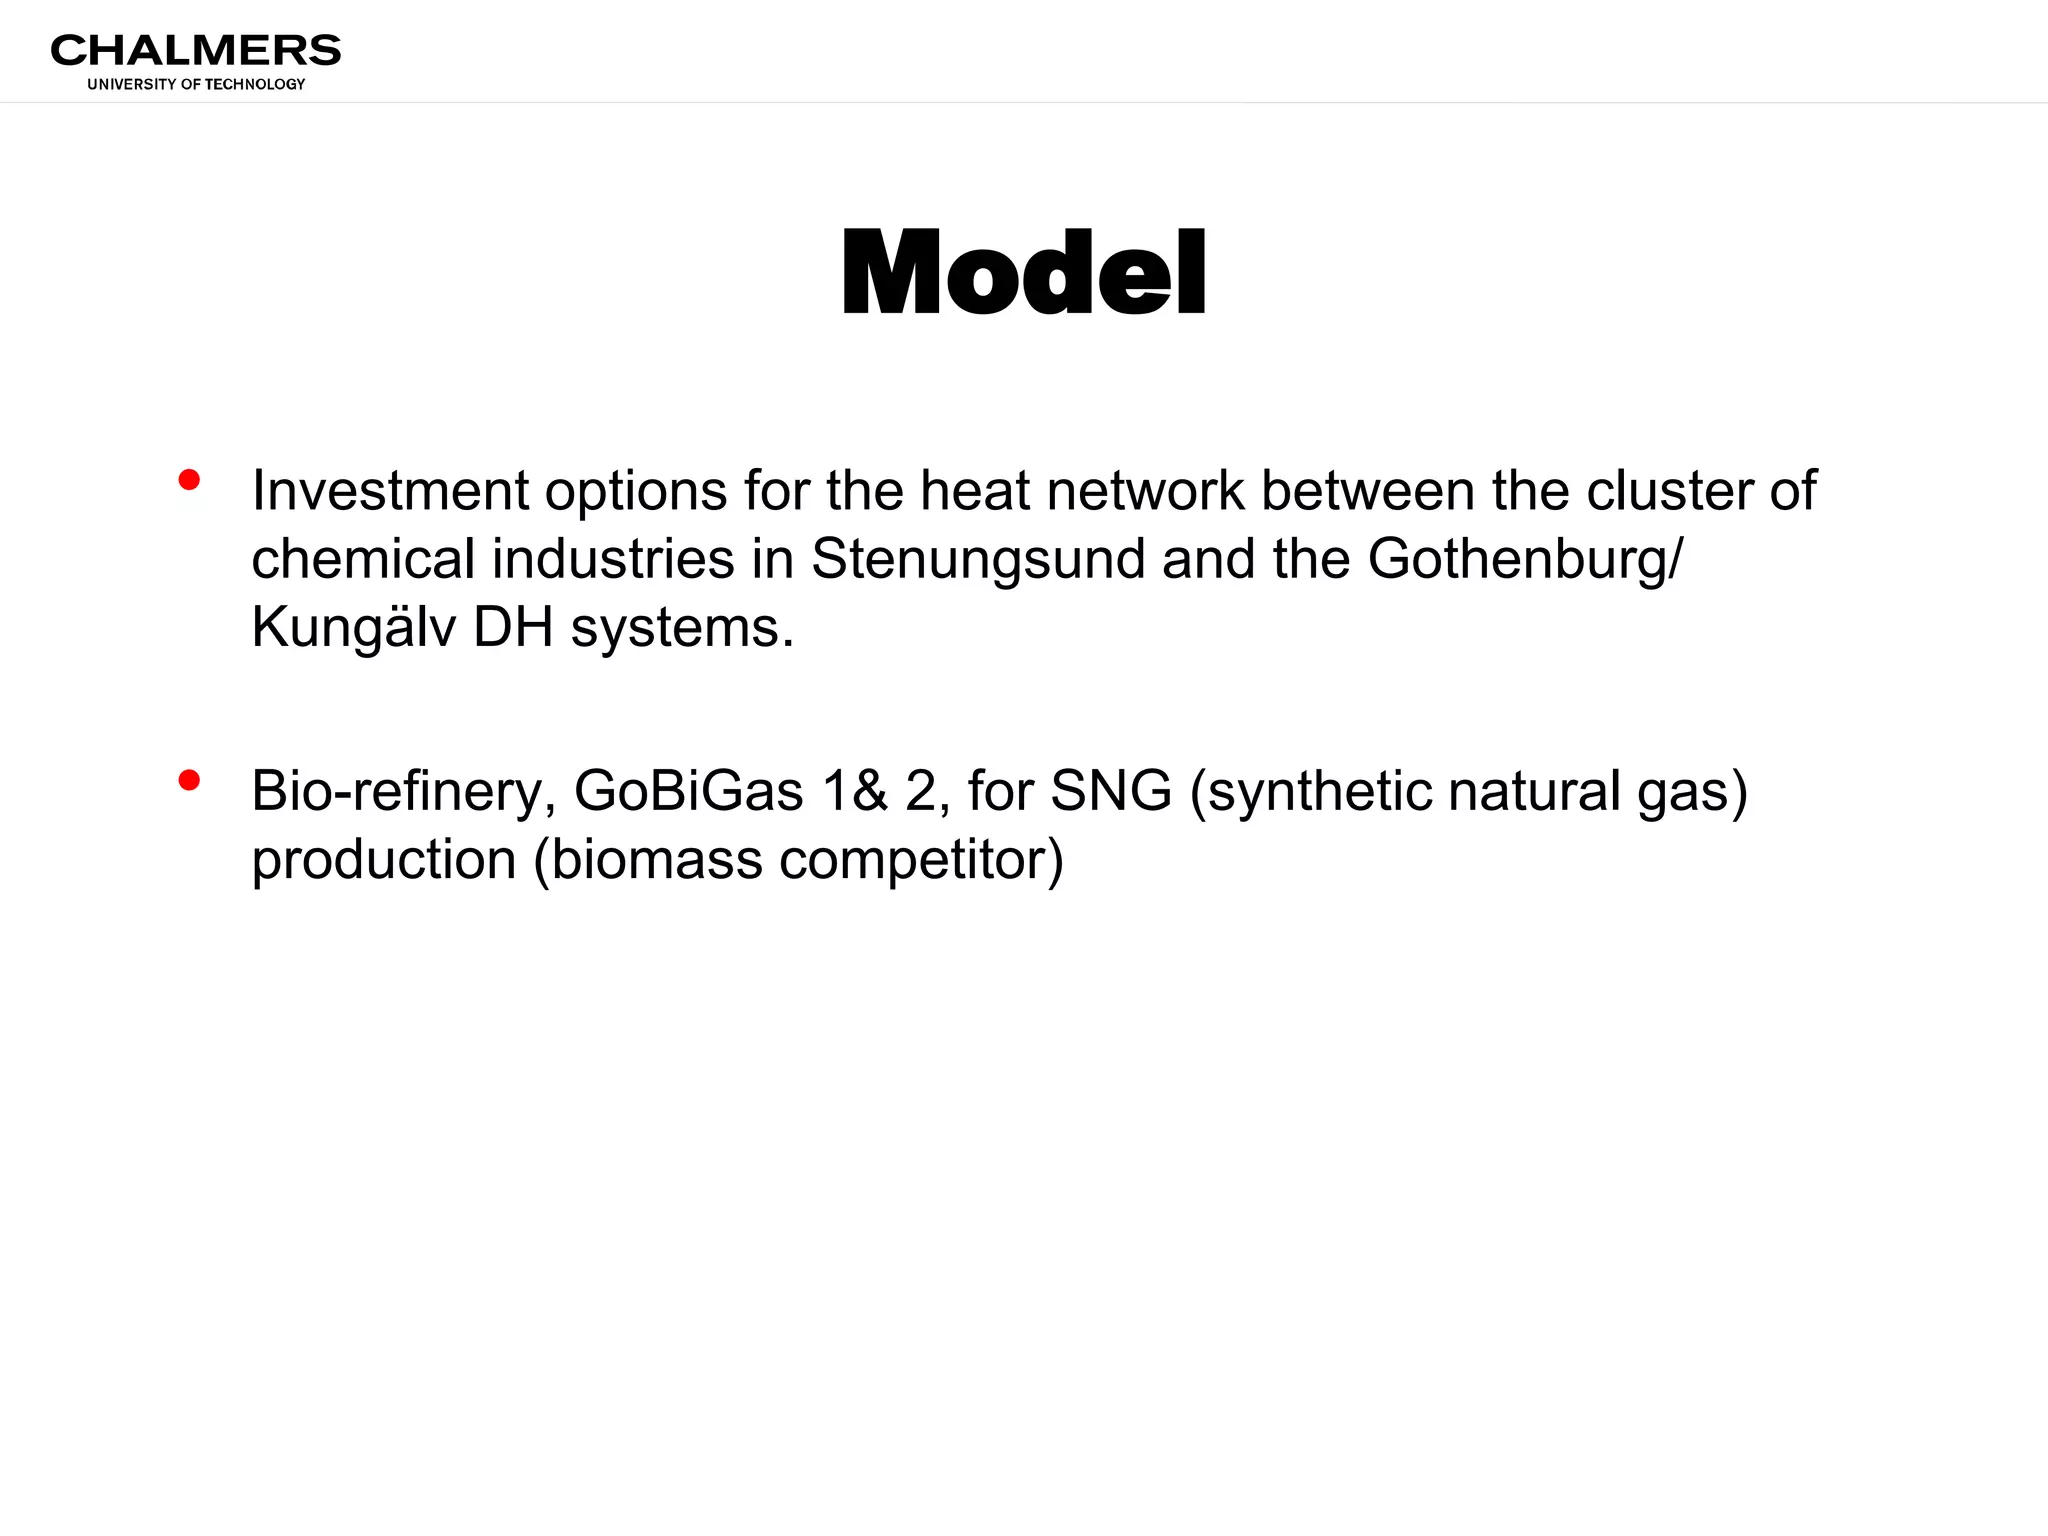
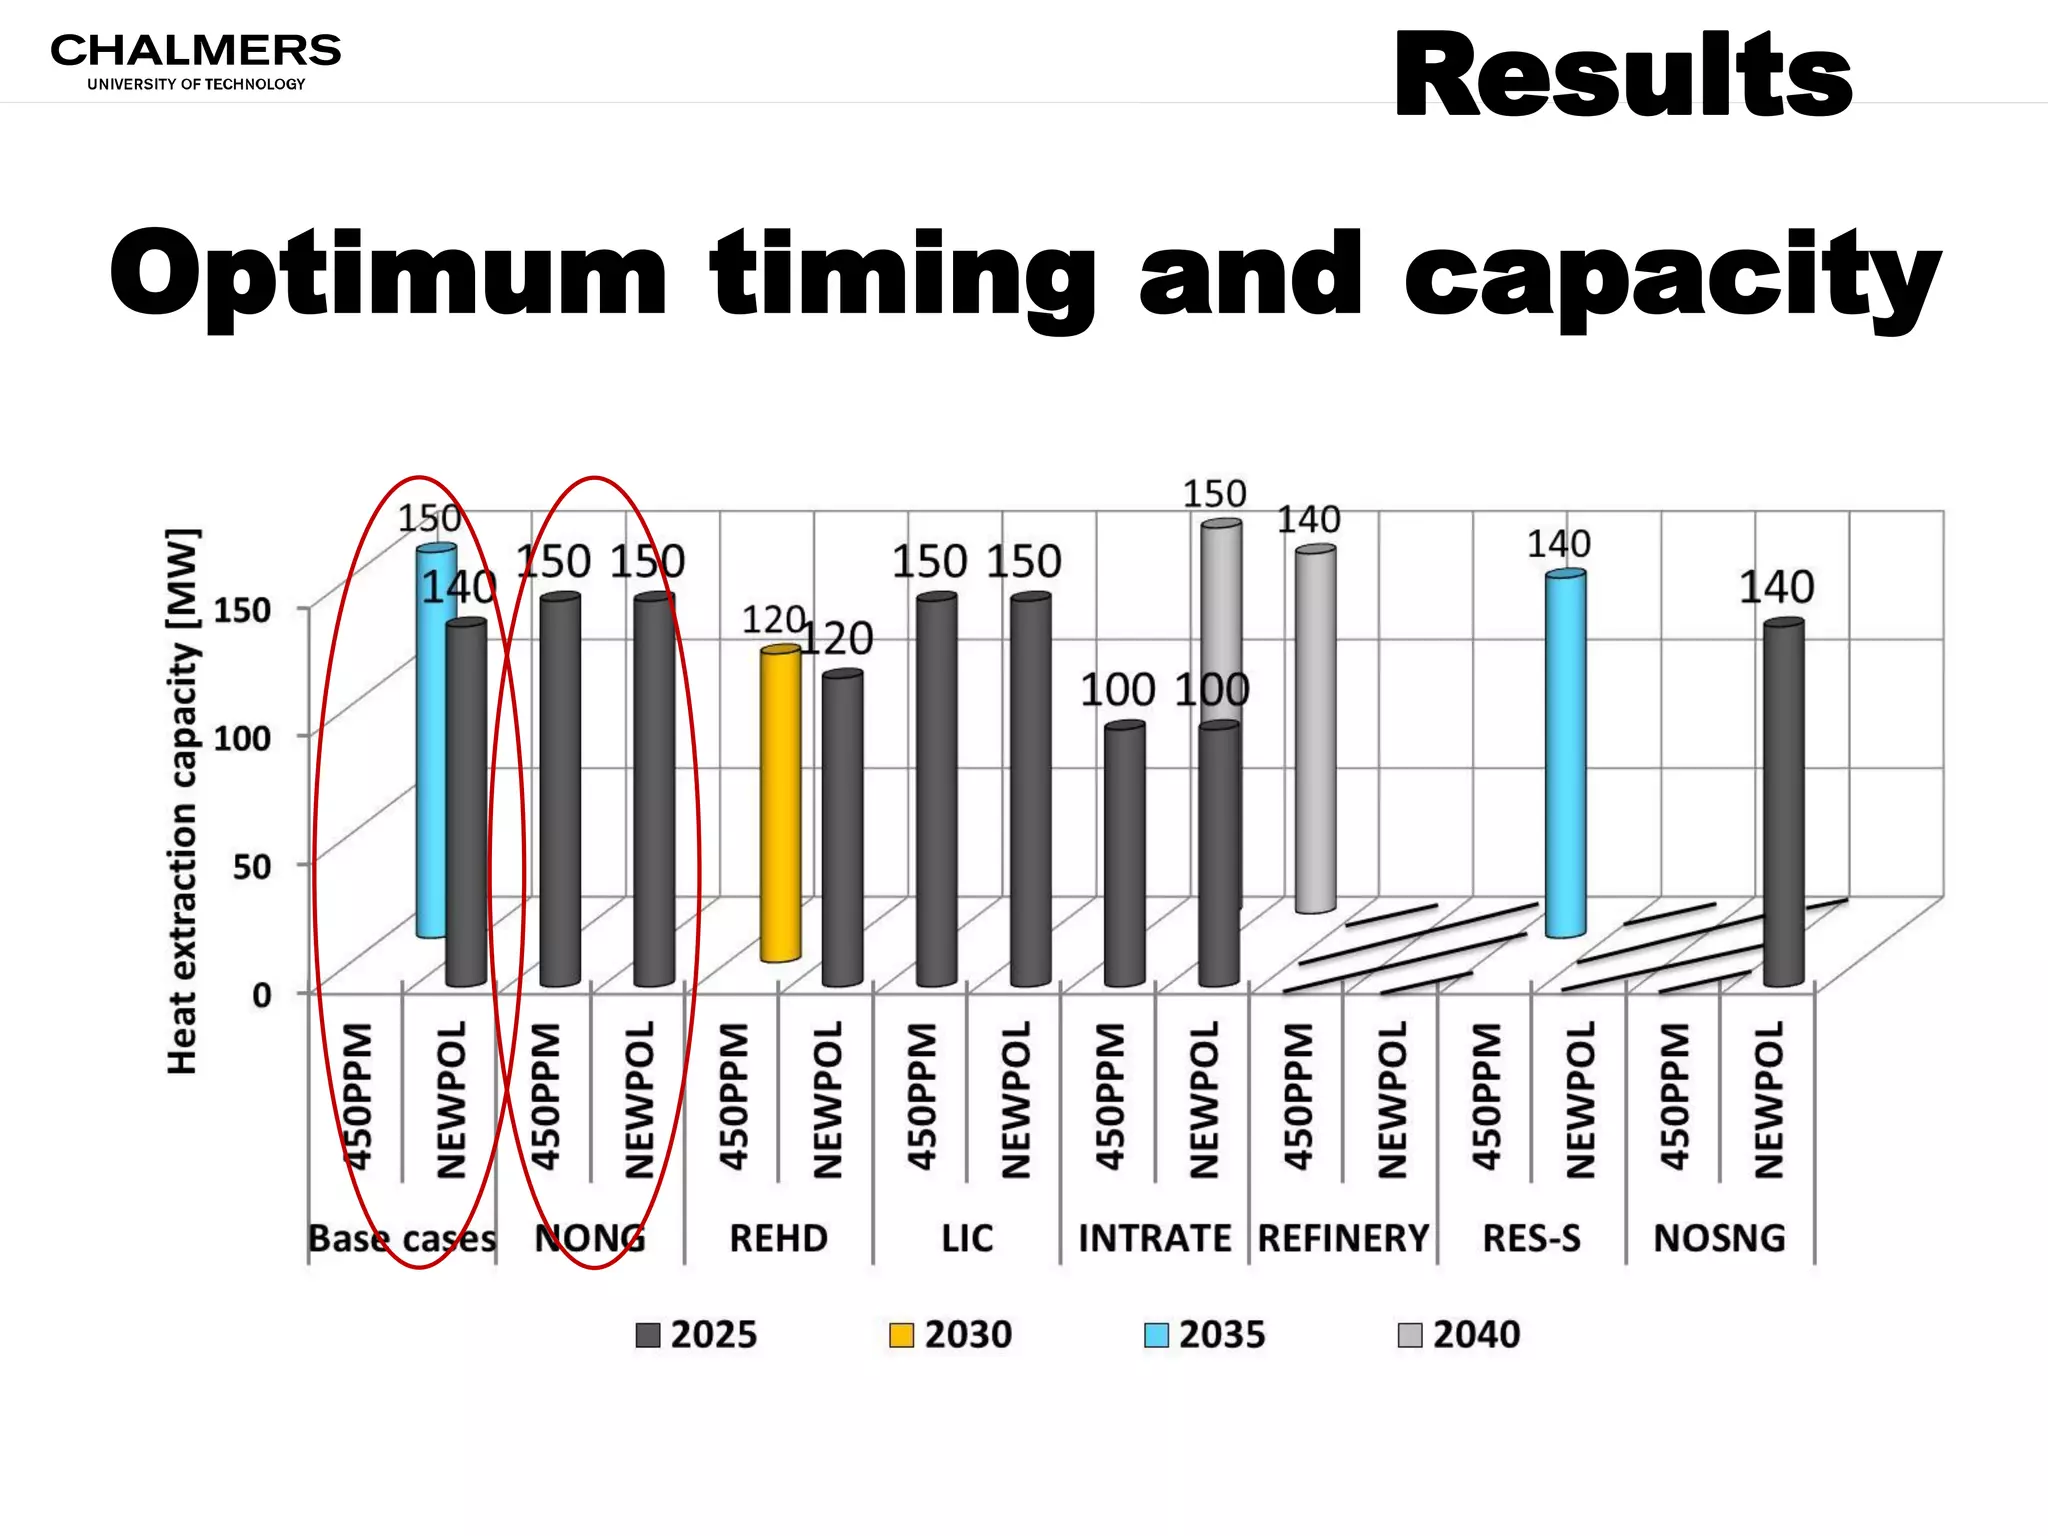
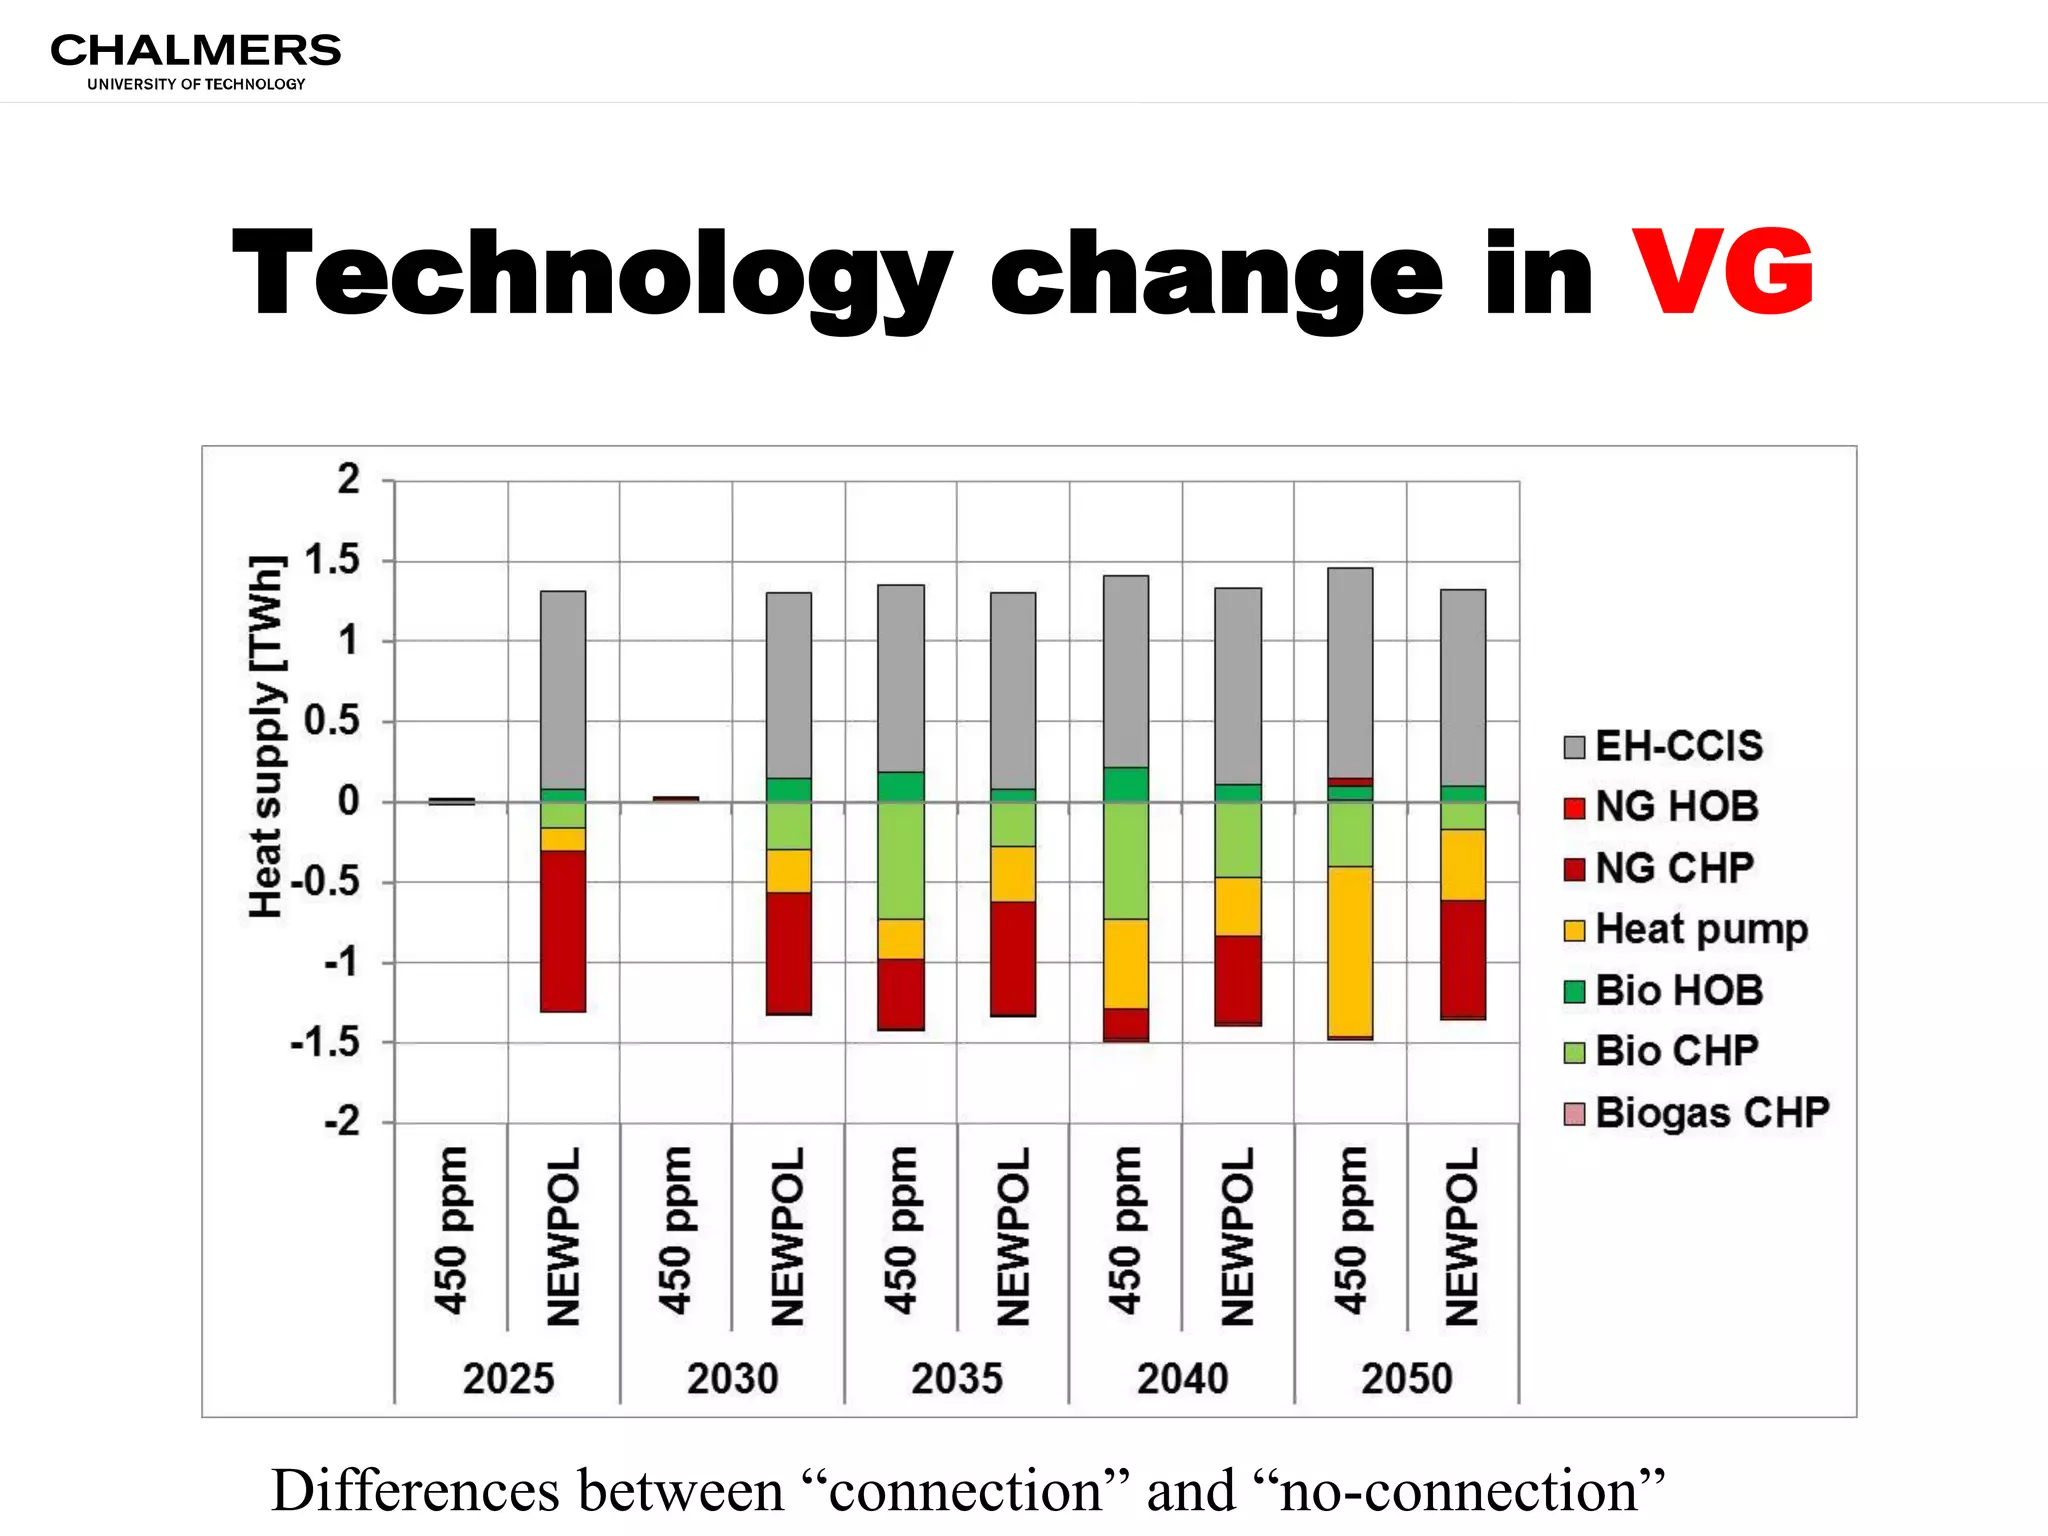
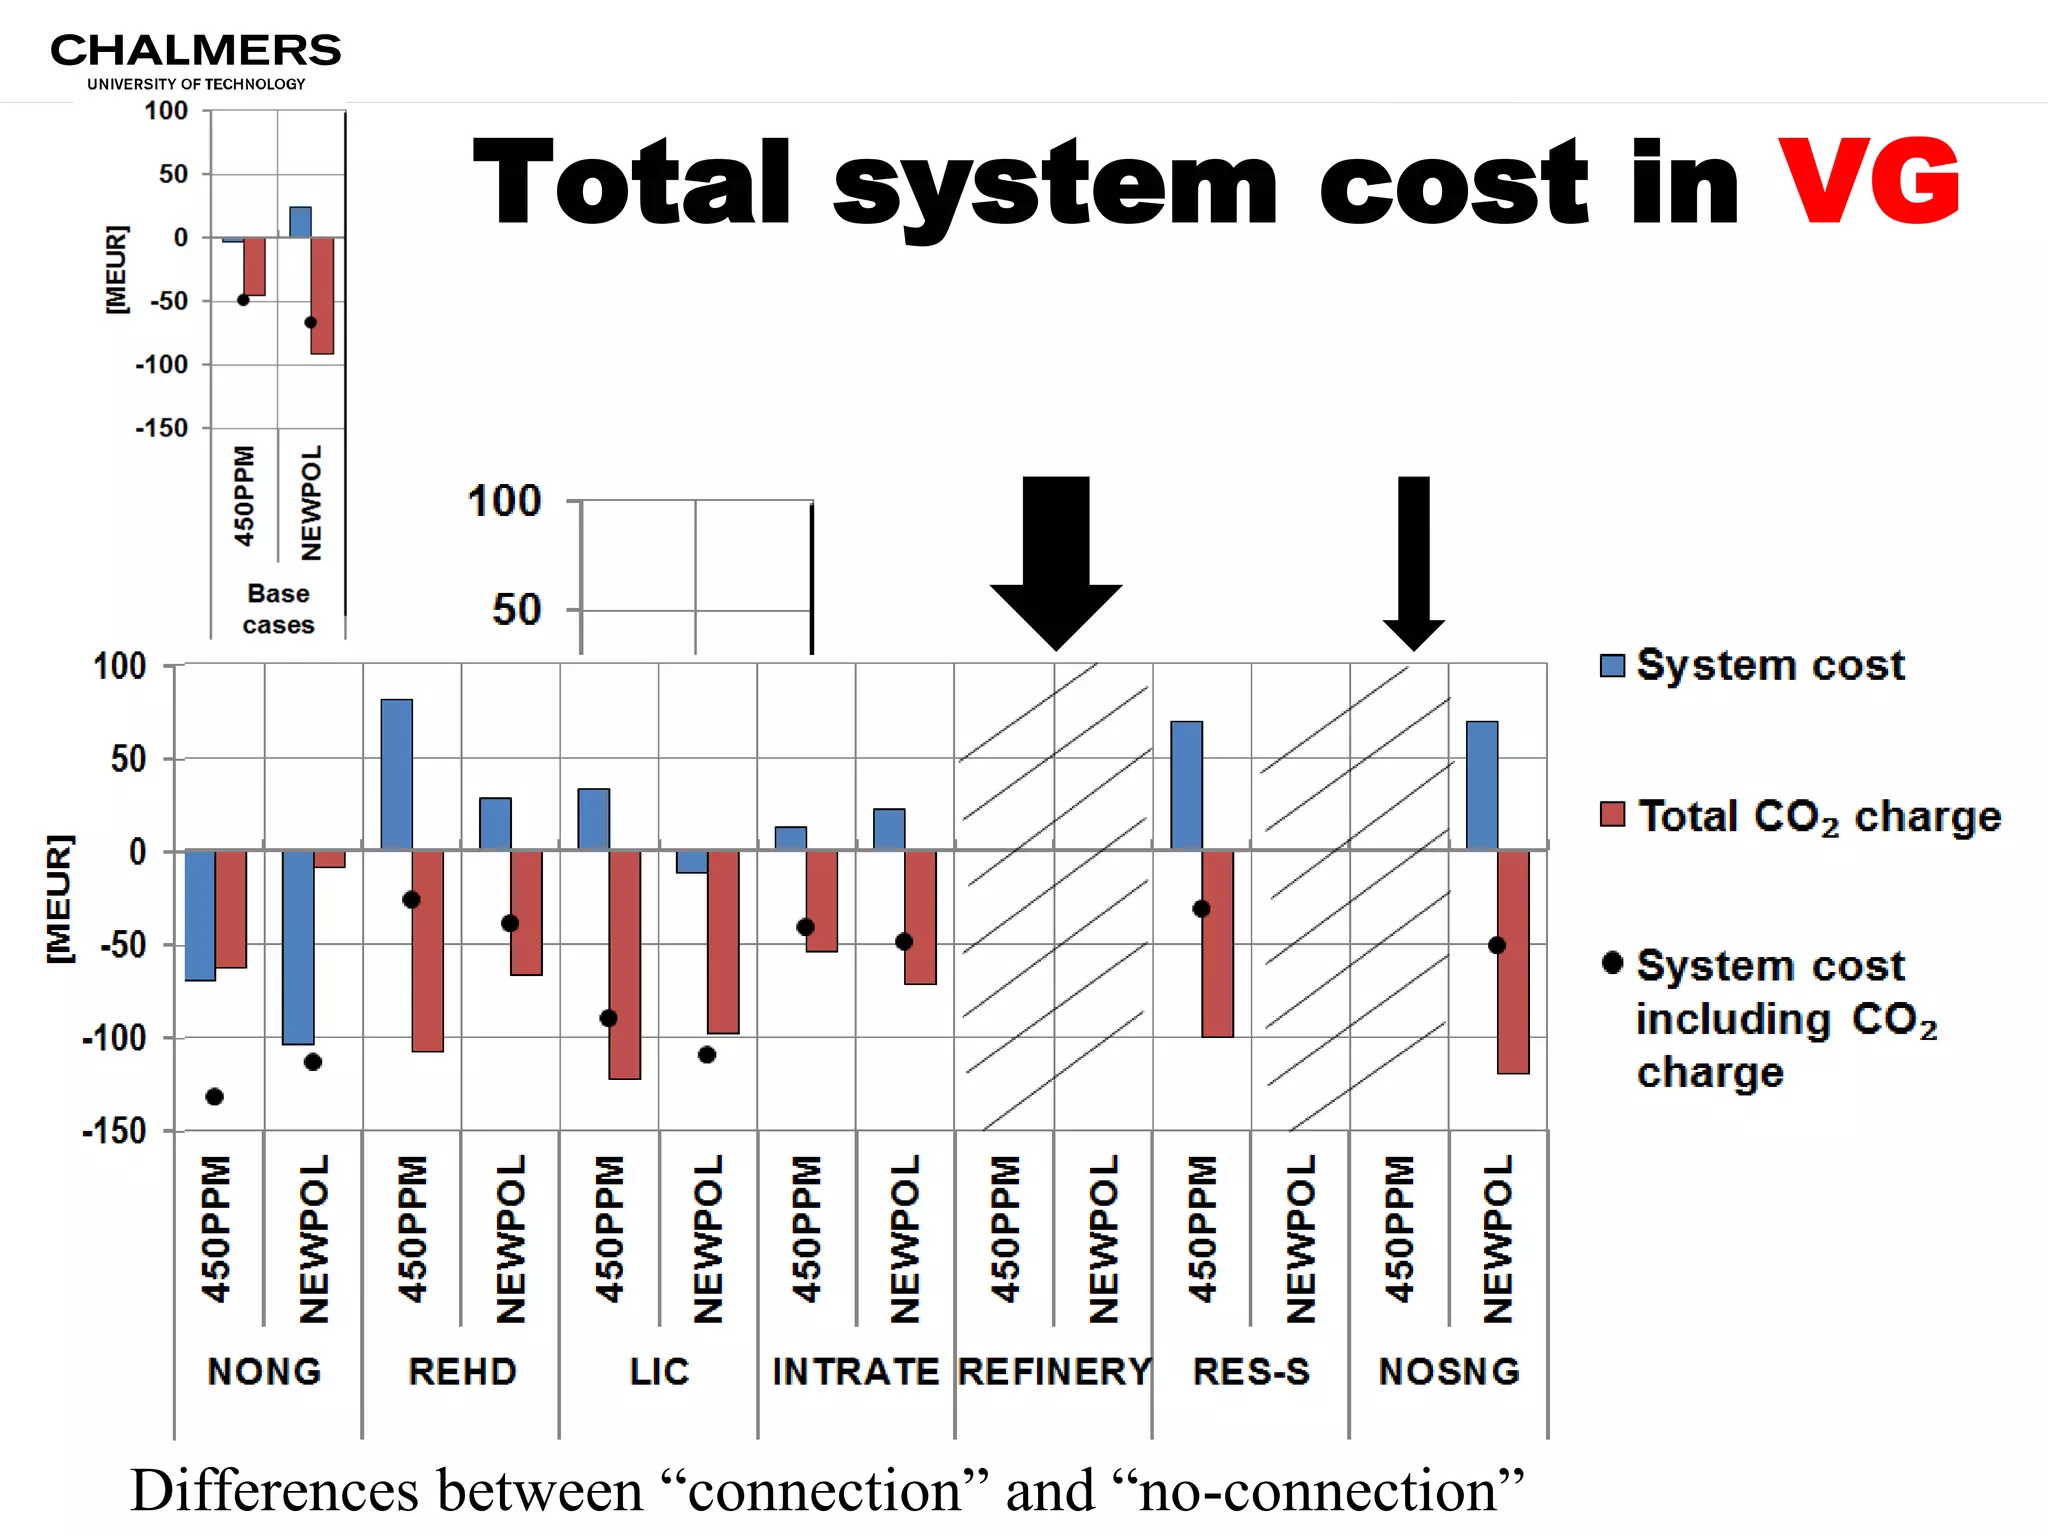
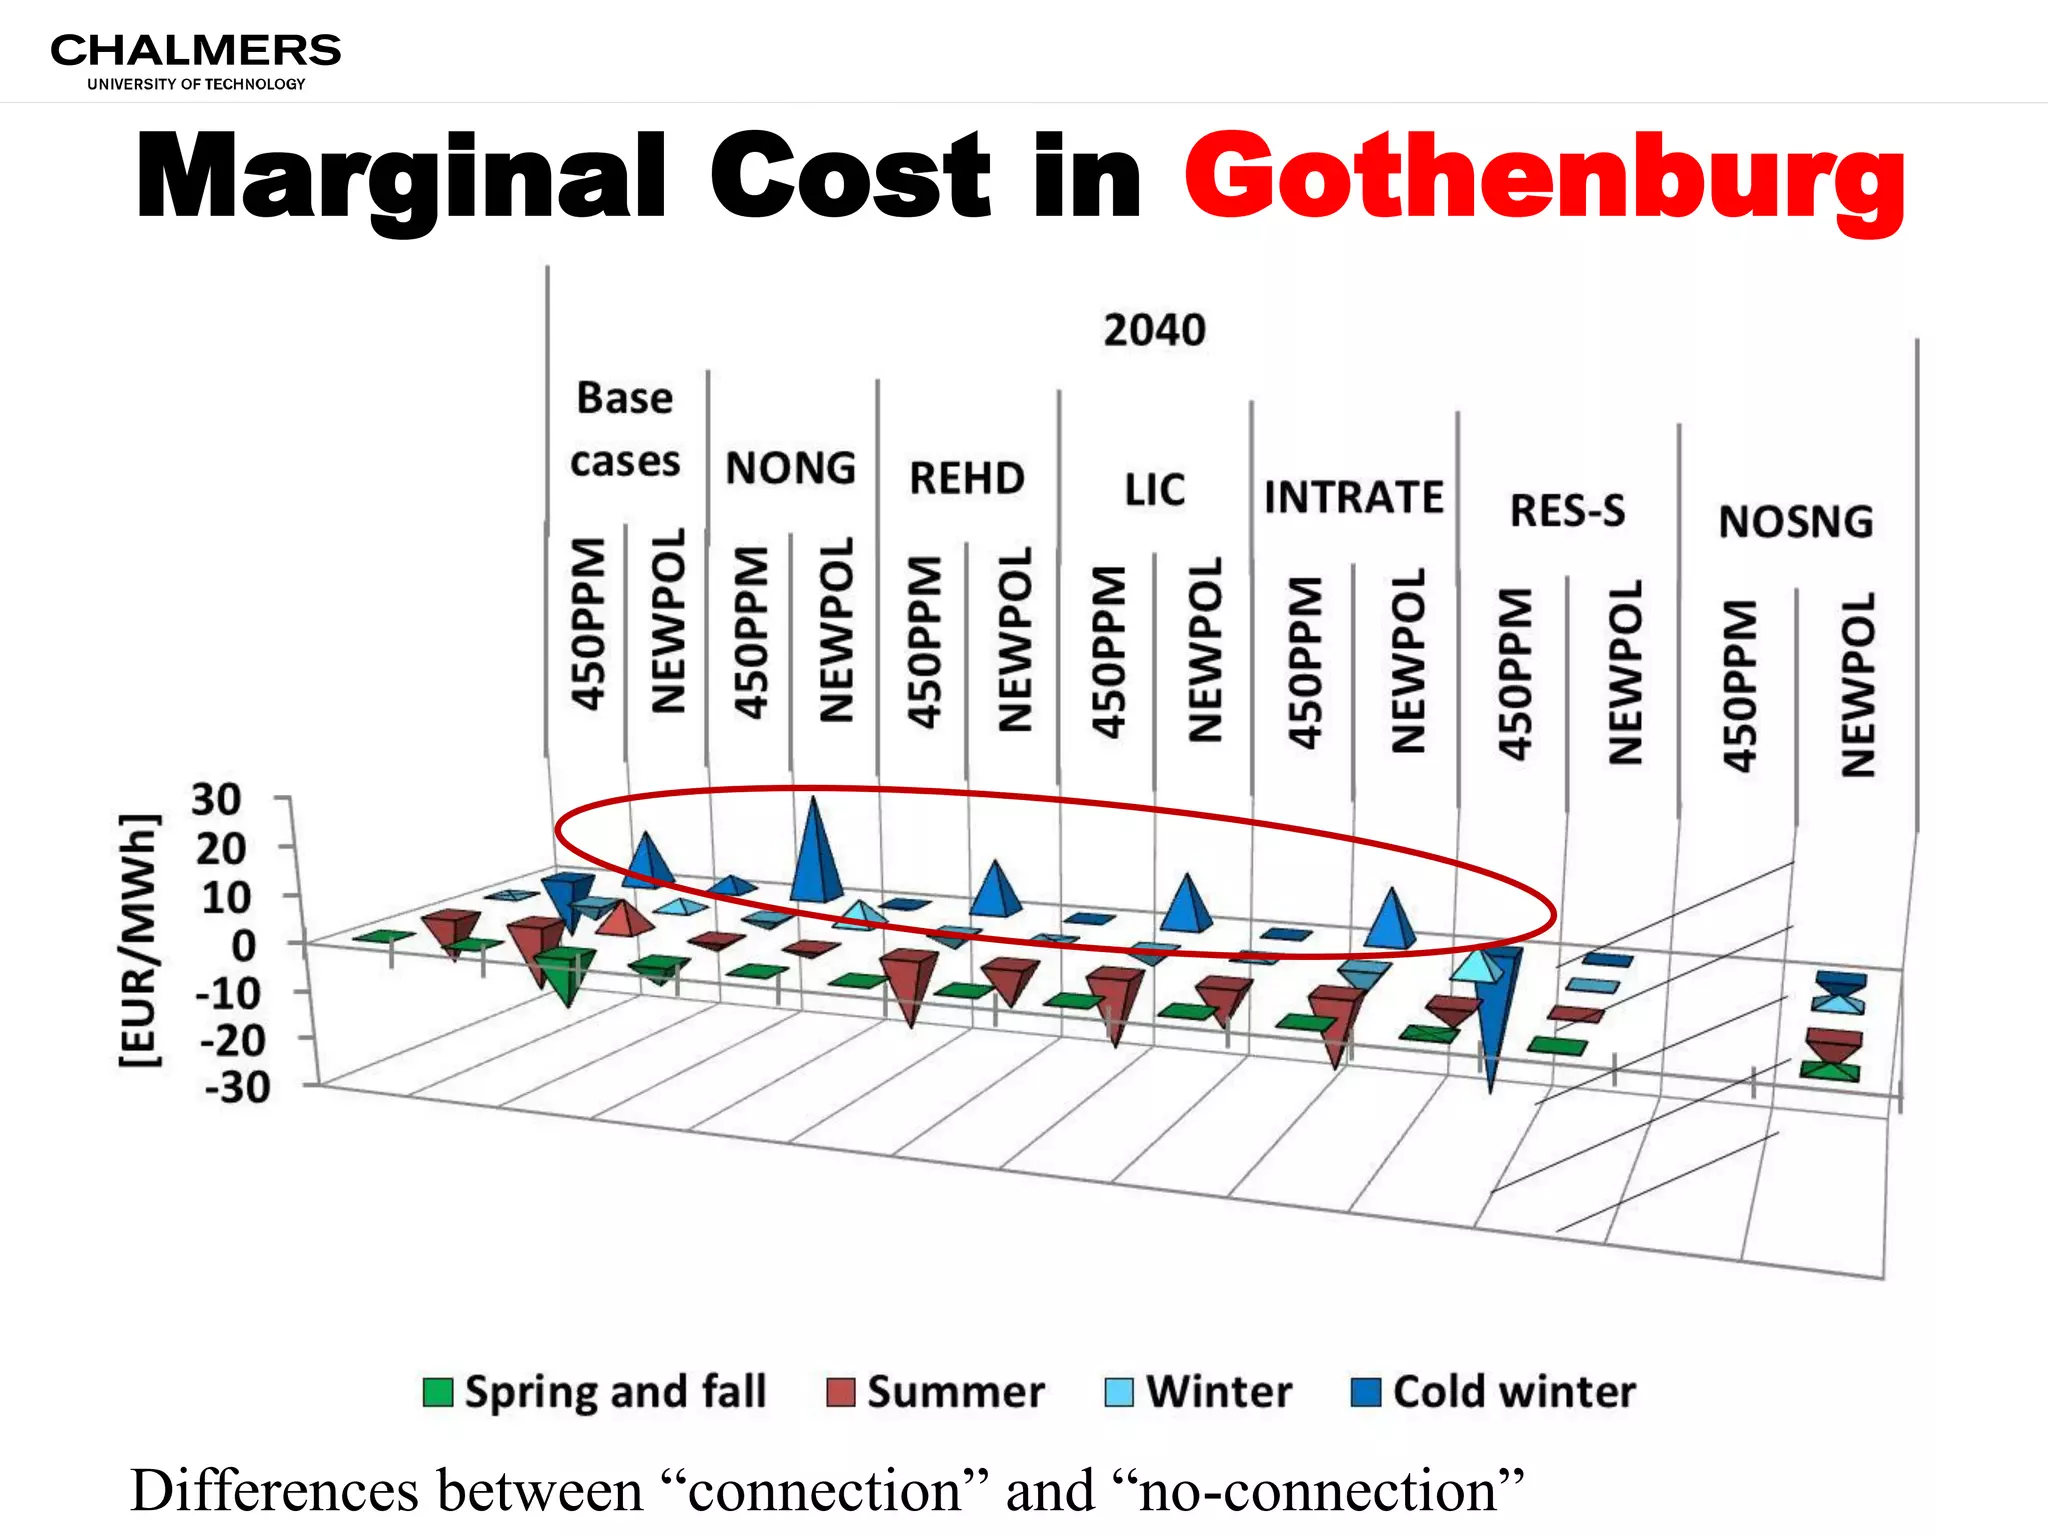
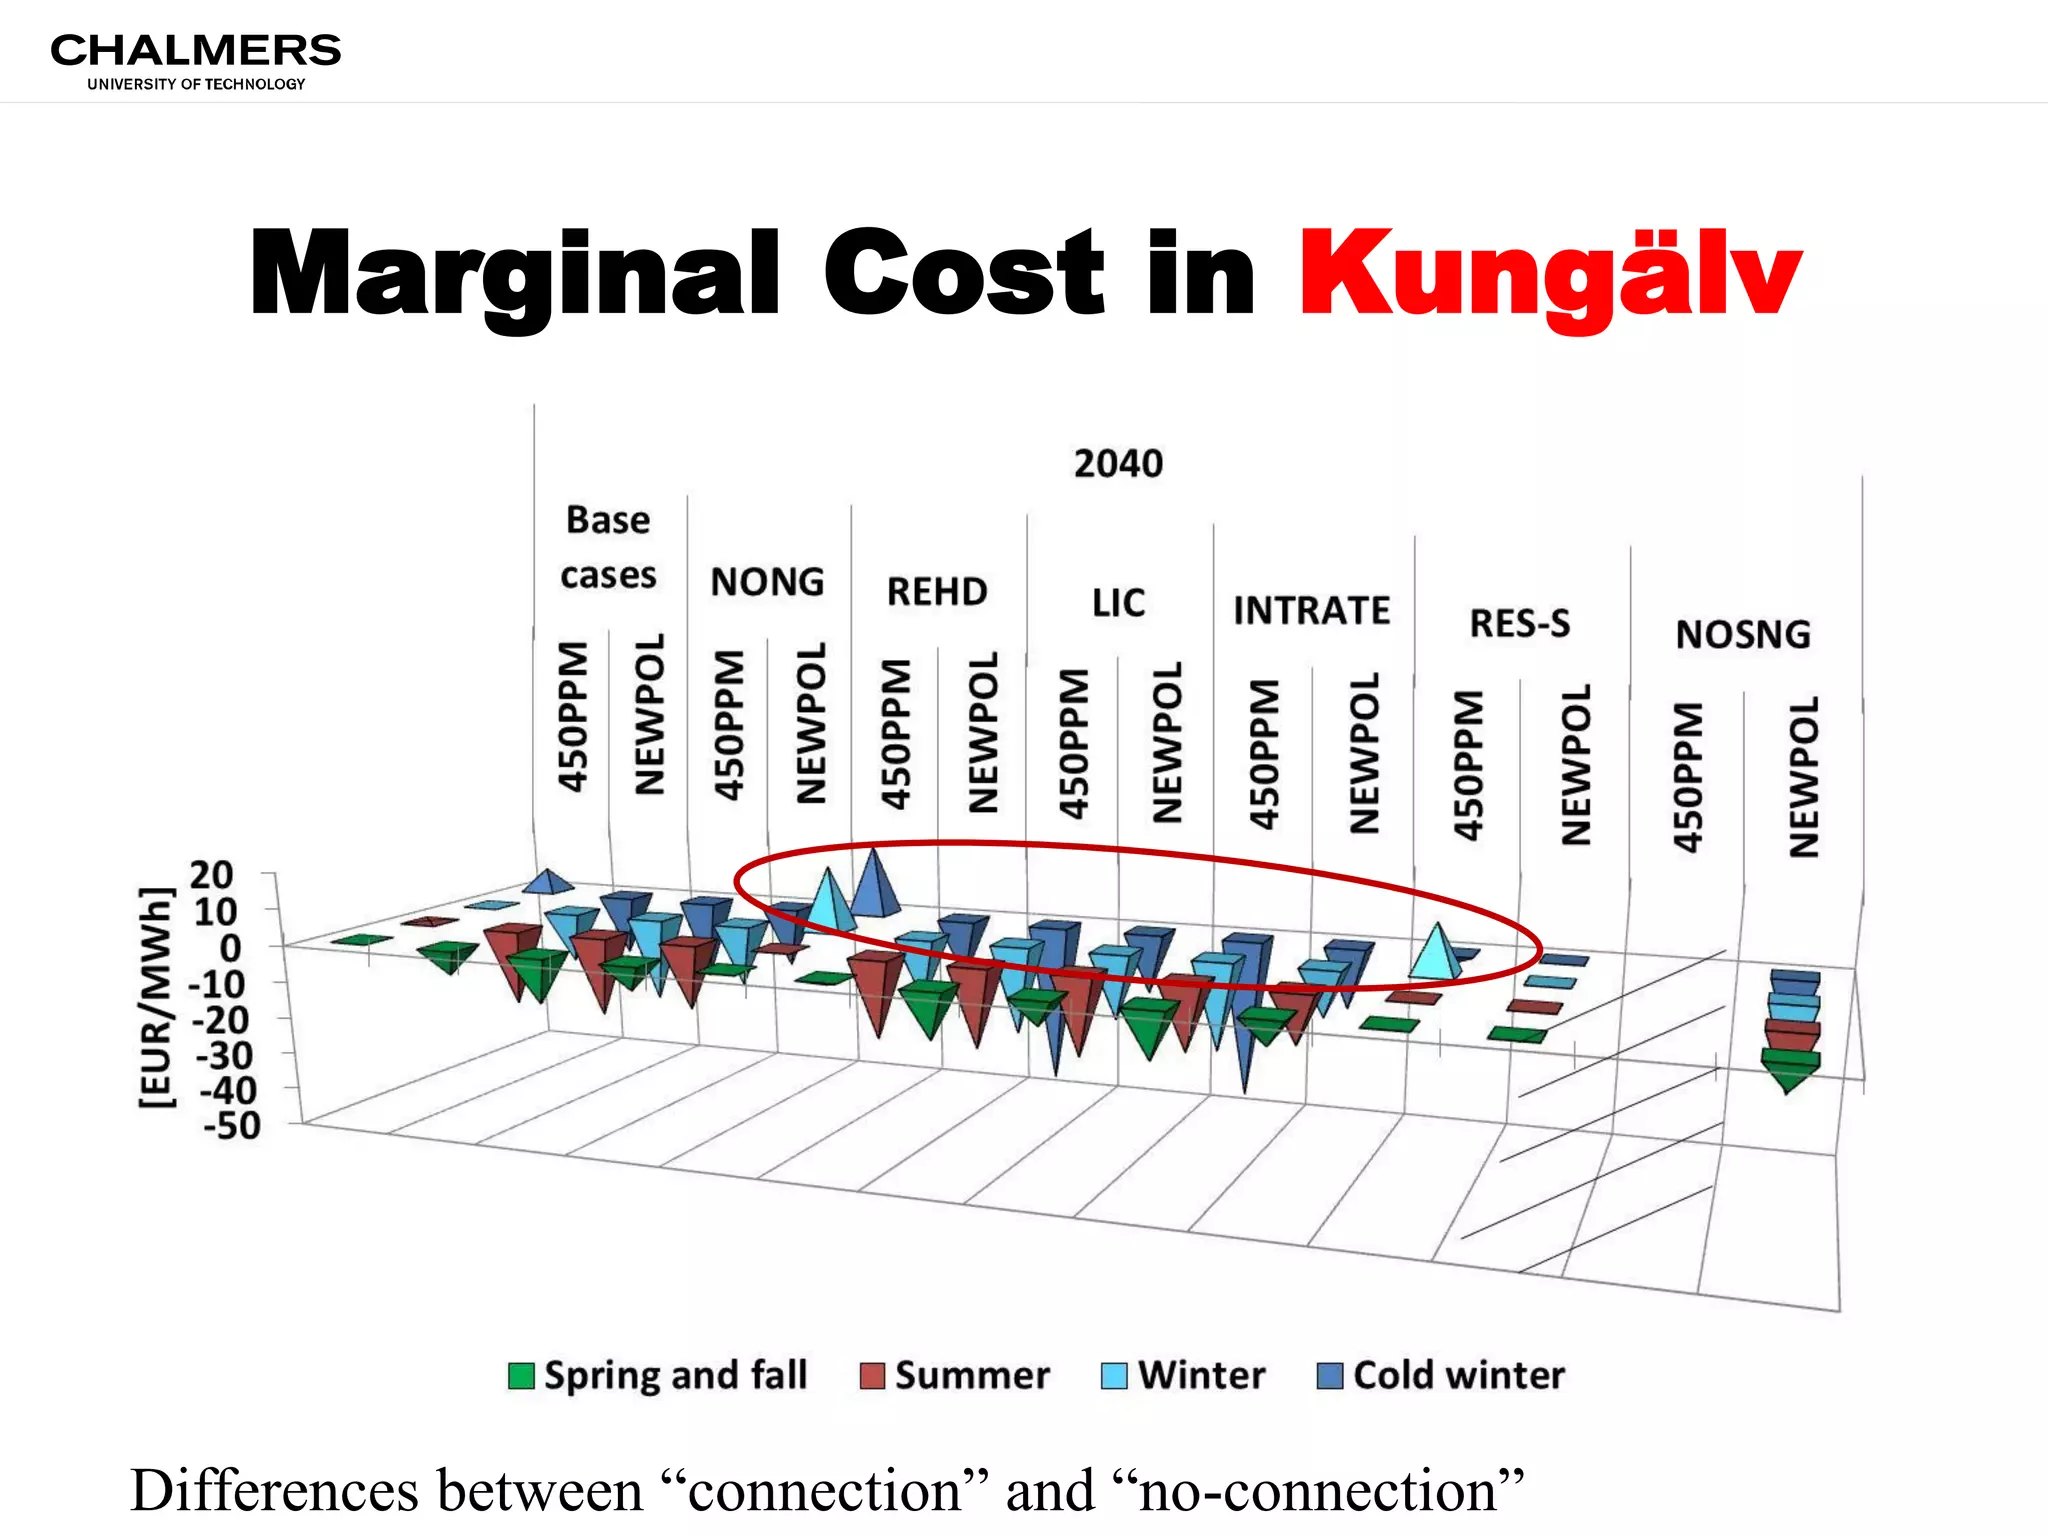
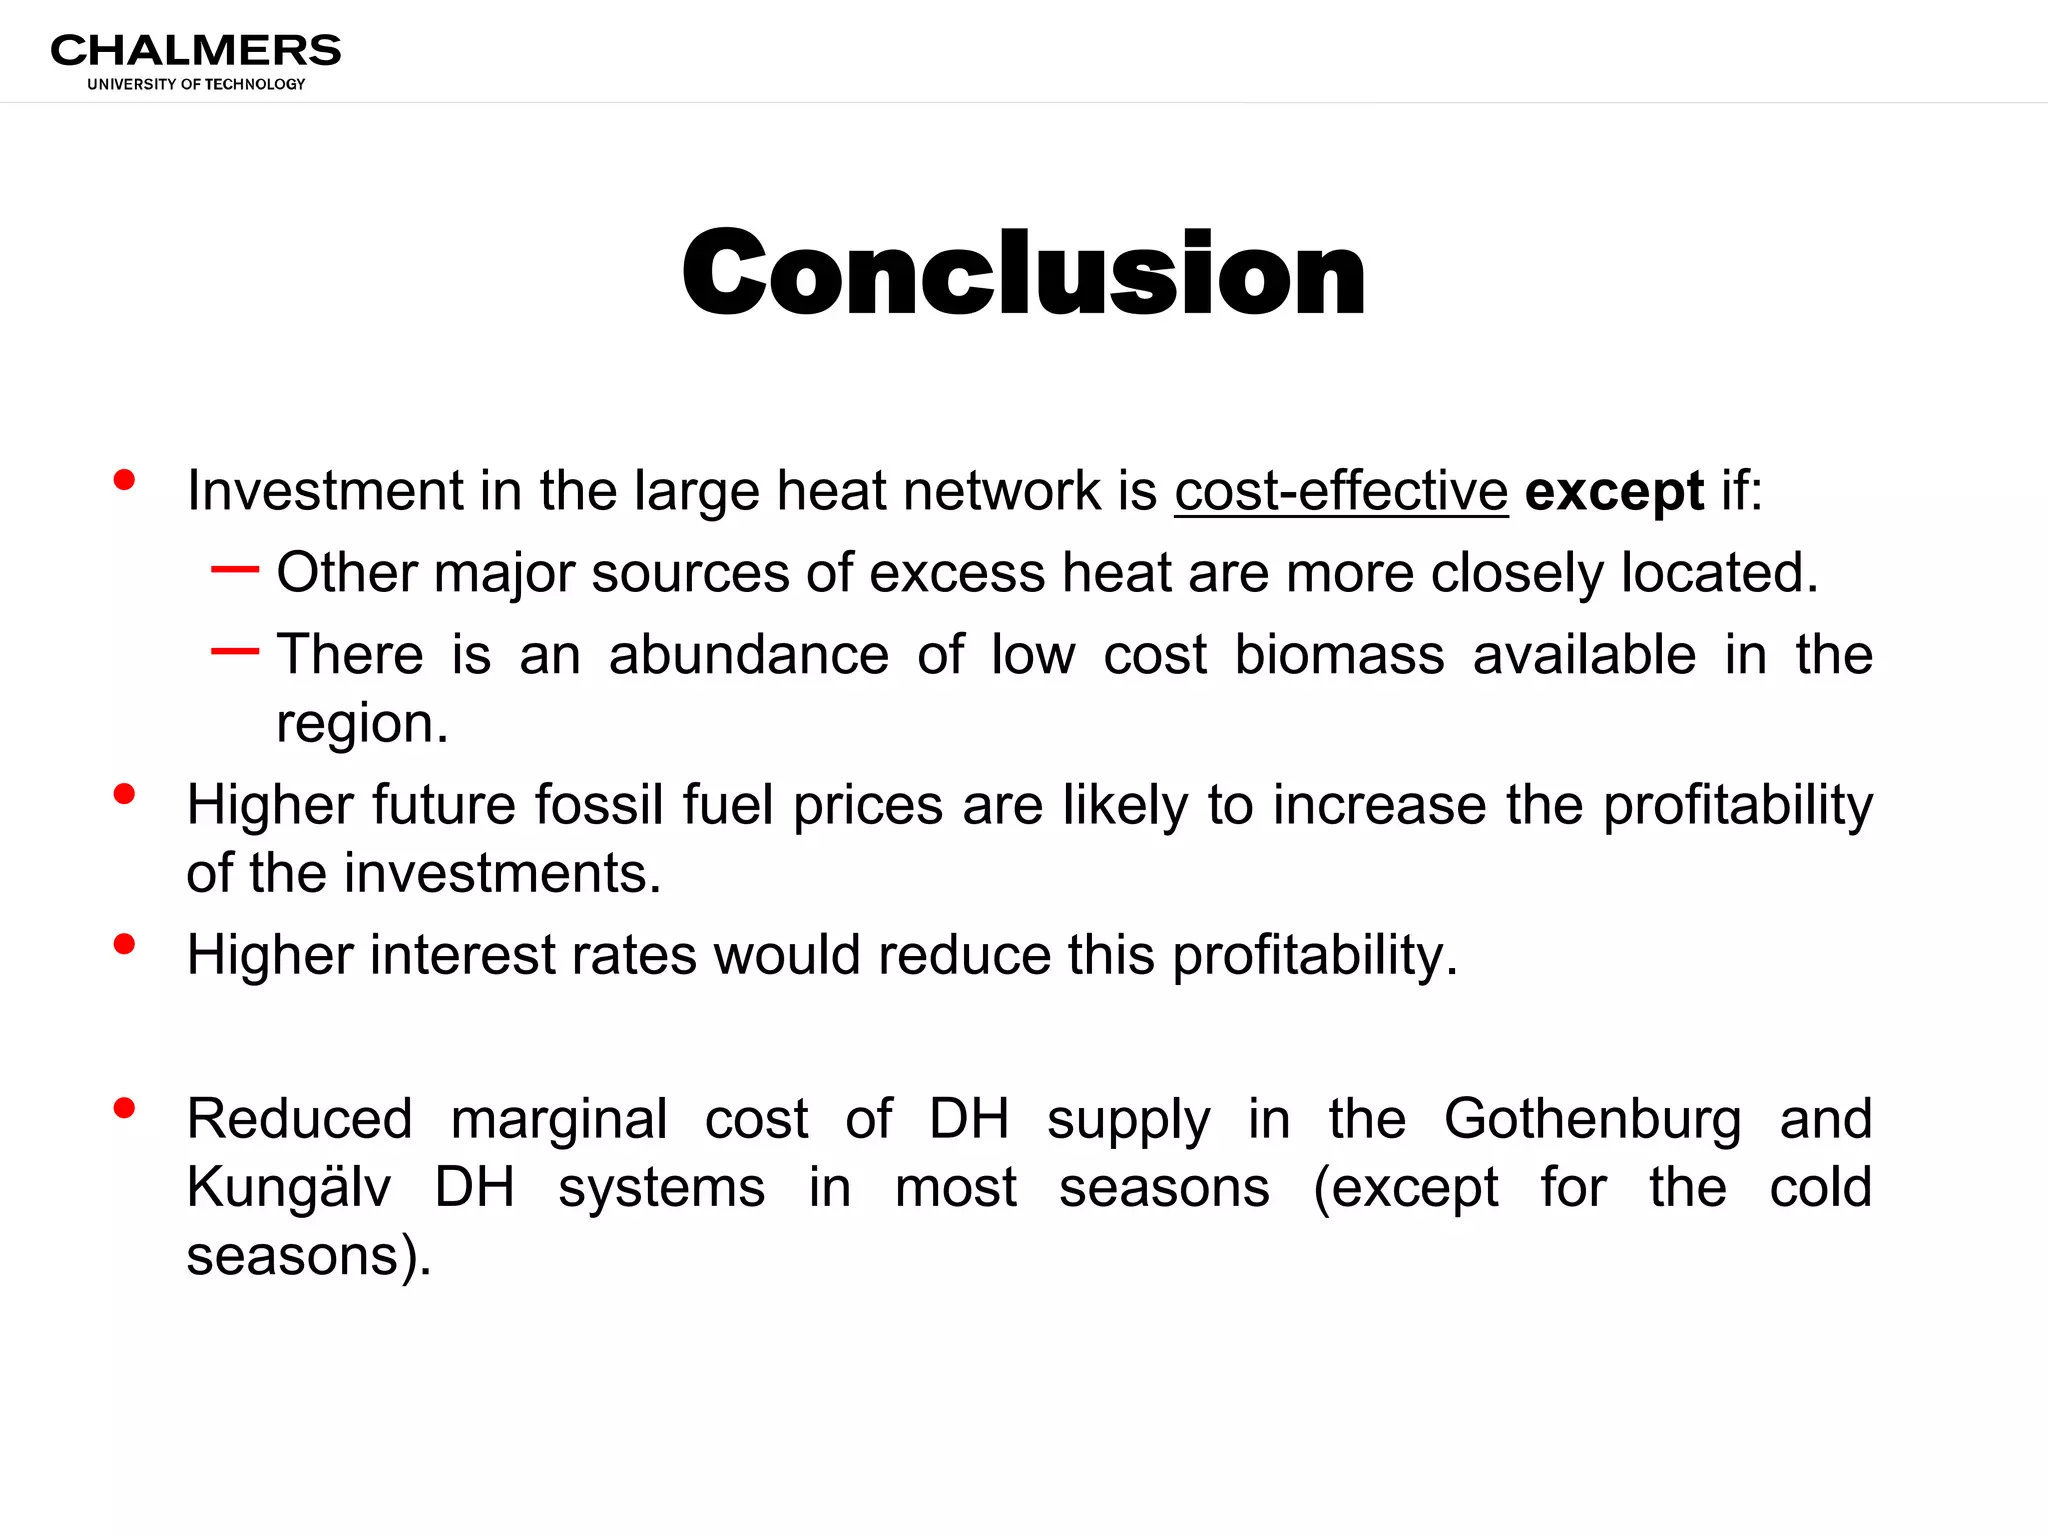
This document summarizes a study assessing the economic impacts of utilizing excess heat from industries through regional heat networks. The study uses energy system modeling to analyze scenarios with and without a large heat network connecting chemical industries to district heating systems in Gothenburg and Kungälv, Sweden. The results show that investing in the heat network reduces the total and marginal costs of district heating supply in most cases. However, the investment is only cost-effective if other excess heat sources are not more localized or biomass is not abundantly and cheaply available in the region.


![[DSC Europe 25] Uros Pesic - The Reality of AI in Marketing.pdf](https://cdn.slidesharecdn.com/ss_thumbnails/rtkodnmtycovsllvzsyn-9-251215095918-b0c6bfe3-thumbnail.jpg?width=640&height=640&fit=bounds)


![[DSC Europe 25] Katherine Forrest - AI NOW: Understanding the Velocity of Cha...](https://cdn.slidesharecdn.com/ss_thumbnails/wvvbruqfrci0sfq9xwgb-4-251212104007-e5ad1987-thumbnail.jpg?width=640&height=640&fit=bounds)


![[DSC Europe 25] Dusan Nesic - Securing Tomorrow’s Infrastructure: Why Cyber-P...](https://cdn.slidesharecdn.com/ss_thumbnails/qikbszfftyowjm2q6duw-1-251211083848-8f2ead6b-thumbnail.jpg?width=640&height=640&fit=bounds)

![[DSC Europe 25] Branko Urosevic -Rethinking Financial Talent: Integrating Cod...](https://cdn.slidesharecdn.com/ss_thumbnails/8jjrus8ttko6qj64f58f-3-251212103250-642c6374-thumbnail.jpg?width=640&height=640&fit=bounds)

![[DSC Europe 25] Behzad Hosseini - AI Agents in the Wild: Deploying Models tha...](https://cdn.slidesharecdn.com/ss_thumbnails/3qtejajvsjqrzwfept2c-10-251212103250-7f2b1068-thumbnail.jpg?width=640&height=640&fit=bounds)
![[DSC Europe 25] Jovan Bogicevic - Legacy to AI-Driven Defense: Transforming D...](https://cdn.slidesharecdn.com/ss_thumbnails/rsarluadt563hntyfc8q-3-251211083849-3e7bc4c0-thumbnail.jpg?width=640&height=640&fit=bounds)

![[DSC Europe 25] Bassam Maharmeh - Artificial Intelligence: Opportunities and ...](https://cdn.slidesharecdn.com/ss_thumbnails/thhfmr2fqpawzj7hsjpg-5-251211083048-2c23204f-thumbnail.jpg?width=640&height=640&fit=bounds)