More Related Content Similar to What is survival analysis, and when should I use it? (20) 1. ISSN 1806-3713© 2016 Sociedade Brasileira de Pneumologia e Tisiologia
http://dx.doi.org/10.1590/S1806-37562016000000013
p < 0.001
Log-rank test
0 25 50 75 100 125 150 175
Months
100%
75%
50%
25%
0%
Survival
Two
years
Five
years
What is survival analysis, and when should I
use it?
Juliana Carvalho Ferreira1,2
, Cecilia Maria Patino2,3
1. Divisão de Pneumologia, Instituto do Coração – InCor – Hospital das Clínicas, Faculdade de Medicina, Universidade de São Paulo, São Paulo, Brasil.
2. Methods in Epidemiologic, Clinical and Operations Research–MECOR–program, American Thoracic Society/Asociación Latinoamericana del Tórax.
3. Department of Preventive Medicine, Keck School of Medicine, University of Southern California, Los Angeles, CA, USA.
INTRODUCTION
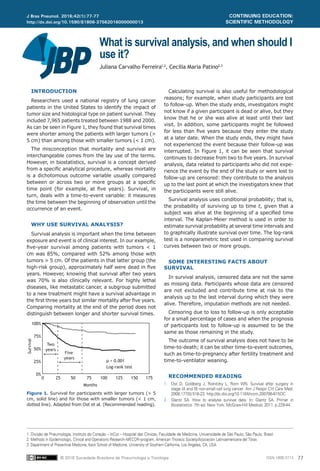
Researchers used a national registry of lung cancer
patients in the United States to identify the impact of
tumor size and histological type on patient survival. They
included 7,965 patients treated between 1988 and 2000.
As can be seen in Figure 1, they found that survival times
were shorter among the patients with larger tumors (>
5 cm) than among those with smaller tumors (< 1 cm).
The misconception that mortality and survival are
interchangeable comes from the lay use of the terms.
However, in biostatistics, survival is a concept derived
from a specific analytical procedure, whereas mortality
is a dichotomous outcome variable usually compared
between or across two or more groups at a specific
time point (for example, at five years). Survival, in
turn, deals with a time-to-event variable: it measures
the time between the beginning of observation until the
occurrence of an event.
WHY USE SURVIVAL ANALYSIS?
Survival analysis is important when the time between
exposure and event is of clinical interest. In our example,
five-year survival among patients with tumors < 1
cm was 85%, compared with 52% among those with
tumors > 5 cm. Of the patients in that latter group (the
high-risk group), approximately half were dead in five
years. However, knowing that survival after two years
was 70% is also clinically relevant. For highly lethal
diseases, like metastatic cancer, a subgroup submitted
to a new treatment might have a survival advantage in
the first three years but similar mortality after five years.
Comparing mortality at the end of the period does not
distinguish between longer and shorter survival times.
Calculating survival is also useful for methodological
reasons; for example, when study participants are lost
to follow-up. When the study ends, investigators might
not know if a given participant is dead or alive, but they
know that he or she was alive at least until their last
visit. In addition, some participants might be followed
for less than five years because they enter the study
at a later date. When the study ends, they might have
not experienced the event because their follow-up was
interrupted. In Figure 1, it can be seen that survival
continues to decrease from two to five years. In survival
analysis, data related to participants who did not expe-
rience the event by the end of the study or were lost to
follow-up are censored: they contribute to the analysis
up to the last point at which the investigators knew that
the participants were still alive.
Survival analysis uses conditional probability; that is,
the probability of surviving up to time t, given that a
subject was alive at the beginning of a specified time
interval. The Kaplan-Meier method is used in order to
estimate survival probability at several time intervals and
to graphically illustrate survival over time. The log-rank
test is a nonparametric test used in comparing survival
curves between two or more groups.
SOME INTERESTING FACTS ABOUT
SURVIVAL
In survival analysis, censored data are not the same
as missing data. Participants whose data are censored
are not excluded and contribute time at risk to the
analysis up to the last interval during which they were
alive. Therefore, imputation methods are not needed.
Censoring due to loss to follow-up is only acceptable
for a small percentage of cases and when the prognosis
of participants lost to follow-up is assumed to be the
same as those remaining in the study.
The outcome of survival analysis does not have to be
time-to-death; it can be other time-to-event outcomes,
such as time-to-pregnancy after fertility treatment and
time-to-ventilator weaning.
RECOMMENDED READING
1. Ost D, Goldberg J, Rolnitzky L, Rom WN. Survival after surgery in
stage IA and IB non-small cell lung cancer. Am J Respir Crit Care Med.
2008;177(5):516-23. http://dx.doi.org/10.1164/rccm.200706-815OC
2. Glantz SA. How to analyse survival data. In: Glantz SA. Primer in
Biostatistics. 7th ed. New York: McGraw-Hill Medical; 2011. p.229-44.
Figure 1. Survival for participants with larger tumors (> 5
cm, solid line) and for those with smaller tumors (< 1 cm,
dotted line). Adapted from Ost et al. (Recommended reading).
J Bras Pneumol. 2016;42(1):77-77
77
CONTINUING EDUCATION:
SCIENTIFIC METHODOLOGY