
Recommended
Recommended
More Related Content
Similar to Competition in the Bottled Water Industry in 2006 John E.docx
Similar to Competition in the Bottled Water Industry in 2006 John E.docx (20)
More from zollyjenkins
More from zollyjenkins (20)
Recently uploaded
Recently uploaded (20)
Competition in the Bottled Water Industry in 2006 John E.docx
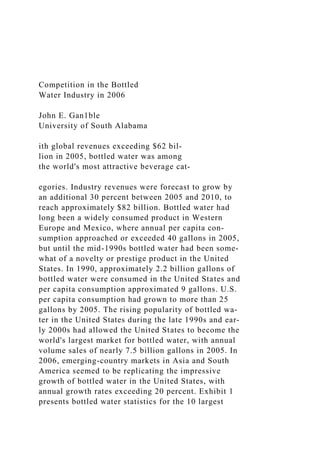
- 1. Competition in the Bottled Water Industry in 2006 John E. Gan1ble University of South Alabama ith global revenues exceeding $62 bil- lion in 2005, bottled water was among the world's most attractive beverage cat- egories. Industry revenues were forecast to grow by an additional 30 percent between 2005 and 2010, to reach approximately $82 billion. Bottled water had long been a widely consumed product in Western Europe and Mexico, where annual per capita con- sumption approached or exceeded 40 gallons in 2005, but until the mid-1990s bottled water had been some- what of a novelty or prestige product in the United States. In 1990, approximately 2.2 billion gallons of bottled water were consumed in the United States and per capita consumption approximated 9 gallons. U.S. per capita consumption had grown to more than 25 gallons by 2005. The rising popularity of bottled wa- ter in the United States during the late 1990s and ear- ly 2000s had allowed the United States to become the world's largest market for bottled water, with annual volume sales of nearly 7.5 billion gallons in 2005. In 2006, emerging-country markets in Asia and South America seemed to be replicating the impressive growth of bottled water in the United States, with annual growth rates exceeding 20 percent. Exhibit 1 presents bottled water statistics for the 10 largest
- 2. country markets for bottled water in 2004. The growing popularity of bottled water in the United States was attributable to concerns over the safety of municipal drinking water, an increased focus on fitness and health, and the hectic on-the- go lifestyles of American consumers. Bottled wa- ter's convenience, purity, and portability made it the natural solution to consumers' dissatisfaction Copyright © 2007 by John E. Gamble. All rights reserved. with tap water and carbonated beverages. The U.S. bottled water market, like most markets outside the United States, was characterized by fierce competi- tive rivalry as the world's bottled water sellers jock- eyed for market share and volume gains. Both the global and U.S. bottled water markets had become dominated by a few international food and bever- age producers- such as Coca-Cola, PepsiCo, and Nestle-but they also included many small regional sellers who were required to either develop low-cost production and distribution capabilities or use dif- ferentiation strategies keyed to SOlne unique product attributes. In 2006, competitive rivalry continued to ratchet upward as sellers launched innovative prod- uct variations, lowered prices in developed markets, used strategic agreements to strengthen positions in established markets, and acquired smaller sellers to gain footholds in rapidly growing emerging markets. Industry analysts and observers believed the recent moves undertaken by the world's largest sellers of bottled water would alter the cOlnpetitive dynam- ics of the bottled water industry and would mandate that certain players modify their current strategic ap- proaches to competition in the industry.
- 3. IN UST co I o I 2006 Even though it was the world's largest market for bottled water, the United States remained among the faster-growing markets for bottled water since per capita consumption rates of bottled water fell sub- stantially below those in Western Europe, the Middle C-48 C-49 Case 4 Competition in the Bottled Water Industry in 2006 -""h Ot Leading Country Markets for Bottled Water, 1999, 2004 (in millions of gallons) United States 4,579.9 6,806.7 8.2% 2 Mexico 3,056.9 4,668.3 8.8 3 China 1,217.0 3,140.1 20.9 4 Brazil 1,493.8 3,062.0 15.4 5 Italy 2,356.1 2,814.4 3.6 6 Germany 2,194.6 2,722.6 4.4 7 France 1,834.1 2,257.3 4.2 8 Indonesia 907.1 1,943.5 16.5 9 Spain 1,076.4 1,453.5 6.2
- 4. 10 India 444.0 1,353.3 25.0 All others 6,833.5 10,535.0 9.0 Worldwide tota.l 25,993.4 40,756.7 (Avg. CARG) 9.4 * CAGR=Compound annual growth rate Source: Beverage Marketing Corporation as reported by the International Bottled Water Association, 2006. East, and Mexico. Bottled water consumption in the United States also lagged per capita consumption of soft drinks by more than a 2: 1 margin, but in 2003 bottled water surpassed coffee, tea, milk, and beer to become the second largest beverage category in the United States. In 2005, more than 15.3 million gallons of carbonated soft drinks were consumed in the United States, but concerns about sugar con- sumption and other nutrition and6tness issues had encouraged many consumers to transition from soft drinks to bottled water. Whereas the bottled water market in the United States grew by 10.7 percent be- tween 2004 and 2005 to reach 7.5 billion gallons, the U.S. carbonated soft drink market declined by 0.6 percent. Industry analysts expected the carbonated soft drink industry to decline by 1.5 percent annu- ally for the foreseeable future as bottled water, en- ergy drinks, and sports drinks gained a larger "share of the stomach." Exhibits 2, 3, and 4 illustrate the growing popularity ofbottled water among u.s. con- sumers during the 1990s and through 2004. Almost one-half of bottled water consumed in the United States in 1990 was delivered to homes and
- 5. offices in returnable five-gallon containers and dis- pensed through coolers. At that time, only 186 mil- lion gallons of water was sold in one-liter or smaller single-serving polyethylene terephthalate (PET) bottles. Beginning in the late 1990s, consumers be- gan to appreciate the convenience and portability of water bottled in single-serving PET containers that could be purchased chilled from a convenience store and drunk immediately. By 2005, bottled water sold in two-liter or smaller PET containers accounted for 60.8 percent of industry volume. The unit sales of bottled water packaged in PET containers grew by 22.5 percent between 2004 and 2005. Water sold in five-gallon containers used in the home and office delivery (HOD) market accounted for only 17.8 per- cent of industry volume in 2005 and grew by only 0.2 percent between 2004 and 2005. Similarly, water sold in 1- or 2.5-gallon high-density polyethylene (HDPE) containers accoL1nted for just 16.5 percent of industry volume in 2005 and grew by only 1.0 percent between 2004 and 2005. Convenience and portability were two of a va- riety of reasons U.S. consumers were increasingly attracted to bottled water. A heightened emphasis on healthy lifestyles and improved consumer awareness of the need for proper hydration led many consum- ers to shift traditional beverage preferences toward bottled water. Bottled water consumers frequently claimed that drinking more water improved the ap- pearance of their skin and gave them more energy. Bottled water analysts also believed that many health-conscious consumers drank bottled water be- cause it was a symbol to others that they were inter- ested in their health.
- 6. A certain amount of industry growth was at- tributable to increased concerns over the quality of tap water provided by municipal water sources. C-50 Part 2 Cases in Crafting and Executing Strategy ._--/Jlbi 2 Per Capita Consumption of Bottled Water by Country Market, 1999, 2004 Italy 40.9 48.5 3.5% 2 Mexico 30.9 44.5 7.6 3 United Arab Emirates 29 43.2 8.3 4 Belgium-Luxembourg 32.2 39.1 4.0 5 France 31 37.4 3.8 6 Spain 26.9 36.1 6.1 7 Germany 26.6 33 4.4 8 Lebanon 17.9 26.8 8.4 9 Switzerland 23.8 26.3 2.0 10 Cyprus 17.8 24.3 6.4 11 United States 16.8 23.9 7.3 12 Saudi Arabia 19.9 23.2 3.1 13 Czech Republic 16.4 23 7.0
- 7. 14 Austria 19.7 21.7 2.0 15 Portugal 18.6 21.2 2.7 Global Average 4.3 6.4 8.3 * CAGR =compound annual growth rate Source: Beverage Marketing Corporation as reported by the International Bottled Water Association, 2006. l'~ -hi 'f 3 Global Bottled Water Market Wholesale Value and Volume, 2001-2005, Forecasts for 2006-2010 2001 92.8 $47.3 2002 99.5 7.2% 51.3 8.5% 2003 107.9 8.4 56.1 9.4 2004 113.3 5.0 59.1 5.3 2005(e) 119.7 5.6 62.9 6.4 2006(f) 125.9 5.2 66.4 5.6 2007(f) 132.9 5.6 70.4 6.0 2008(f) 139.5 5.0 74.5 5.8 2009(f) 146.4 4.9 78.5 5.4 2010(f) 153.4 4.8 81.9 4.3 (e) = estimated
- 8. (f) = forecast Source: Global Bottled Water Industry Profile, December 2005, Datamonitor. Consumers in parts of the world with inadequate United States was very pure by global standards. water treatment facilities relied on bottled water to (Municipal water systems were regulated by the U. S. provide daily hydration needs, but tap water in the Environmental Protection Agency and were required Case 4 Competition in the Bottled Water Industry in 2006 C-Sl u.s. Per Capita Consumption of Bottled Water, 1991-2005 1991 9.3 1992 9.8 5.4% 1993 10.5 7.1 1994 11.5 9.5 1995 12.2 6.1 1996 13.1 7.4 1997 14.1 7.6 1998 15.3 8.5
- 9. 1999 16.8 9.8 2000 17.8 6.0 2001 19.3 8.4 2002 21.2 9.8 2003 22.6 6.6 2004 24 6.2 2005(p) 25.7 7.1 (p) =preliminary Source: Beverage Marketing Corporation as reported by the International Bottled Water Association, 2006. to comply with the provisions of the Safe Drinking Water Act Amendments of 2001.) Consumer con- cerns over the quality of drinking water in the United States emerged in 1993 when 400,000 resi- dents of Milwaukee, Wisconsin, became ill with flu- like symptoms and almost 100 immune-impaired residents died from waterborne bacterial infections. Throughout the 1990s and into the early 2000s, the media sporadically reported cases of municipal wa- ter contamination, such as in 2000 when residents of Washington, D.C., became ill after the city's water filtration process caused elevated levels of suspend- ed materials in the water. Even though some consumers were concerned about the purity of municipal water, most consum- ers' complaints with tap water centered on the chem-
- 10. ical taste of tap water that resulted from treatment processes that included the use of chlorine and other chemicals such as fluoride. In a tap-water tasting in Atlanta hosted by Southpoint Magazine, judges rated municipal water on taste and found some cities' waters very palatable. Water obtained from the municipal source in Memphis was said to have "a refreshing texture." However, othermunicipal systems did not fare as well with the jUdges-some of whom suggested Houston's water tasted "like a chemistry lab," while others said Atlanta's municipal water was akin to "a gulp of swimming pool water."l However, there were positive attributes to the chemicals added to tap water, as chlorine was necessary to kill any bacteria in the water and fluoride had contributed greatly to improved dental health in the United States. In addition, tap water had been shown to be no less healthy than bottled water in a number of independent studies, including a study publicized in Europe that was commissioned by the World Wide Fund for Nature and conducted by researchers at the University of Geneva. Bottled water producers in the United States were required to meet the standards of both the Environmental Protection Agency (EPA) and the U.S. Food and Drug Administration (FDA). Like all other food and beverage products sold in the United States, bottled water was subject to such food safety and labeling requirements as nutritional labeling provisions and general good manufacturing prac- tices (GMPs). Bottled water GMPs were mandated under the 1962 Kefauver-Harris Drug Amendments to the Federal Food, Drug and Cosmetic Act of 1938 and established specifications for plant construc-
- 11. tion and design, sanitation, equipment design and construction, production and process controls, and record keeping. The FDA required bottled water pro- ducers to test at least weekly for the presence ofbac- teria and to test annually for inorganic contaminants, trace metals, minerals, pesticides, herbicides, and or- ganic compounds. Bottled water was also regulated by state agencies that conducted inspections of bot- tling facilities and certification of testing facilities to ensure that bottled water was bottled under federal GMPs and was safe to drink. Bottled water producers were also required to comply with the FDA's Standard of Identity, which required bottlers to include source water information on their products' labels. Water labeled as "spring water" must have been captured from a borehole or natural orifice of a spring that naturally flows to the surface. "Artesian water" could be extracted from a confined aquifer (a water-bearing underground layer of rock or sand) where the water level stood above the top of the aquifer. "Sparkling water" was re- quired to have natural carbonation as it emerged from the source, although carbonation could be added to C-S2 Part 2 Cases in Crafting and Executing Strategy return the carbon dioxide level to what was evident as the water emerged from the source. Even though sparkling water was very popular throughout most of Europe, where it accounted for approximately 54 percent of industry sales, it made up only 8 percent of the bottled water market in the United States.
- 12. The FDA's definition of "mineral water" stat- ed that such water must have at least 250 parts per million of total dissolved solids, and its standards required water labeled as "purified" to have under- gone distillation, deionization, or reverse osmosis to remove chemicals such as chlorine and fluoride. "Drinking water" required no additional processing beyond what was required for tap water but could not include flavoring or other additives that account for more than 1 percent of the product 's total weight. Both "drinking water" and "purified water" had to cleaily state that the water originated "from a com- munity water system" or "from a municipal source." Bottled water producers could also voluntarily become members of the International Bottled Water Association (IBWA) and agree to comply with its Model Code, which went beyond the standards of the EPA, FDA, or state agencies. The Model Code al- lowed fewer parts per million of certain organic and inorganic chemicals and microbiological contami- nants than FDA, EPA, or state regulations and im- posed a chlorine limitation on bottled water. Neither the FDA nor the EPA limited chlorine content. IBWA members were monitored for compliance through annual, unannounced inspections administered by an independent third-party organization. Distribution and Sale of Bottled Water Consumers could purchase bottled water in nearly any location in the United States where food was also sold. The distribution of bottled water varied depending on the producer and the distribution chan- nel. Typically, bottled water was distributed to large grocers and wholesale clubs directly by the bottled
- 13. water producer, whereas most producers used third parties like beer and wine distributors or food dis- tributors to make sales and deliveries to convenience stores, restaurants , and delis. Because ofthe difficulty for food service distrib- utors to restock vending machines and provide bottled water to special events, Coca-Cola and PepsiCo were able to dominate such channels since they could make deliveries of bottled water along with their deliveries of other beverages. Coca-Cola 's and PepsiCo 's vast beverage distribution systems made it easy for the two companies to make Dasani and Aquafina avail- able anywhere Coke or Pepsi could be purcha ed. In addition, the two cola giants almost always negoti- ated contracts with sports stadiums, universities, and school systems that made one of them the exclusive supplier of all types of nonalcoholic beverages sold in the venue for a specified period. Under such cir- cumstances, it was nearly impossible for other brands of bottled water to gain access to the account. PepsiCo and Coca-Cola's soft drink businesses had allowed vending machine sales to account for 8 percent of industry sales volume in 2005 and had also aided the two companies in making Aquafina and Dasani available in supermarkets, supercent- ers, wholesale clubs, and convenience stores. Soft dlink sales were important to all types of food stores since soft dlinks made up a sizable percentage of the store's sales and since food retailers frequently relied on soft drink promotions to generate store traffic. Coca-Cola and PepsiCo were able to encour- age their customers to purchase items across their product lines to ensure prompt and complete ship-
- 14. ment of key soft drink products. As a diversified food products company, PepsiCo had exploited the popularity of its soft drinks , Gatorade sports drinks, Frito-Lay snack foods , and Tropicana orange juice in persuading grocery accounts to purchase not only Aquafina but also other non-soft drink brands such as FruitWorks, SoBe, Lipton 's Iced Tea, and Starbucks Frappuccino. Since most supermarkets , supercenters, and food stores usually carried fewer than seven branded bot- tled waters plus a private-label brand, bottled water producers other than Coke and Pepsi were required to compete aggressively on price to gain access to shelf space. Supermarkets and discount stores ac- counted for 43.5 percent of U.S. industry sales in 2005 and were able to require bottled water suppliers to pay slotting fees in addition to offering low prices to gain shelf space. Natural foods stores could also require aIIDual contracts and slotting fees but were much more willing than traditional supermarkets to pay higher wholesale prices for products that could contribute to the store 's overall level of differentia- tion. In fact, most natural foods stores would not carry brands found in traditional supermarkets. C-53 Case 4 Competition in the Bottled Water Industry in 2006 Convenience stores were also aggressive in press- ing bottled water producers and food distributors for low prices and slotting fees. Most convenience stores carried only two to four brands of bottled water be- yond what was distributed by Coca-Cola and Pepsi and required bottlers to pay annual slotting fees of
- 15. $300 to $400 per store in return for providing 5 to 10 bottle facings on a cooler shelf. Some bottlers offered to provide retailers with rebates of approxi- mately 25 cents per case to help secure distributors for their brand of bottled water. Food and beverage distributors usually allowed bottled water producers to negotiate slotting fees and rebates directly with convenience store buyers. There was not as much competition among bottled water producers to gain shelf space in delis and restaurants since that channel accounted for only 6.5 percerit of U.S. industry sales in 2005. PepsiCo and Coca-Cola were among the better-suited bottled water producers to economically distribute water to restaurants since they likely provided fountain drinks to such establishments. Suppliers to the Indu try The suppliers to the bottled water industry included municipal water systems; spring operators; bottling equipment manufacturers; deionization, reverse osmosis, and filtration equipment manufacturers; manufacturers of PET and HDPE bottles and plas- tic caps; label printers; and secondary packaging suppliers. Most packaging supplies needed for the production of bottled water were readily available from a large number of suppliers. Large bottlers able to commit to annual purchases of more than 5 mil- lion PET bottles could purchase bottles for as little as 5 cents per bottle, whereas regional bottlers pur- chasing smaller quantities of bottles or making only one-time purchases of bottles could expect to pay a much as 15 cents per bottle. Suppliers of secondary packaging like cardboard boxes, shrink-wrap, and six-pack rings and suppliers of printed film or paper
- 16. labels were numerous and aggressively competed for the business of large bottled water producers. Bottling equipment used for water purifica- tion and filling bottles was manufactured and mar- keted by about 50 different companies in the United States. A basic bottle-filling line could be purchased for about $125,000, whereas a large state-of-the-art bottling facility could require a capital investment of more than $100 million. Bottlers choosing to sell spring water could expect to invest about $300,000 for source certification, road grading, and installa- tion of pumping equipment, fencing, holding tanks, and disinfecting equipment. Bottlers that did not own springs were also required to enter into lease agreements with spring owners that typically ranged from $20,000 to $30,000 per year. Companies sell- ing purified water merely purchased tap water from municipal water systems at industrial rates prior to purifying and bottling the water for sale to consum- ers. Sellers ofpurified water were able not only to pay less for water they bottled, but also to avoid spring water's inbound shipping costs of 5 to 15 cents per gallon since water arrived at the bottling facility by pipe rather than by truck. Key Comp titive Capabilities in the Bottled Water Industry Bottled water did not enjoy the brand loyalty of soft drinks, beer, or many other food and beverage prod- ucts but was experiencing some increased brand loy- alty, with 10 to 25 percent of consumers looking for a specific brand and an additional two-thirds consid- ering only a few brands acceptable. Because of the growing importance of brand recognition, success-
- 17. ful sellers of bottled water were required to possess well-developed brand-building skills. Most of the industry's major sellers were global food companies that had built respected brands in soft drinks, dairy products, chocolates, and breakfast cereals prior to entering the bottled water industry. Bottled water sellers also needed to have efficient distribution systems to supermarket, wholesale club, and convenience store channels to be successful in the industry. It was imperative for bottled water dis- tributors (whether direct store delivery by bottlers or delivery by third parties) to maximize the number of deliveries per driver since distribution included high fixed costs for warehouses, trucks, handheld inven- tory tracking devices, and labor. It was also critical for distributors and bottlers to provide on-time deliveries and offer responsive customer service to large cus- tomers in the highly price-competitive market. Price competition also mandated high utilization of large- scale plants to achieve low production costs. Volume and market share were also key factors in keeping marketing expenses at an acceptable per-unit level. C-54 Part 2 Cases in Crafting and Executing Strategy Recent Trends in the Bottled Water Industry As the annual growth rate of bottled water sales in the United States slowed from double-digit rates, signs had begun to appear that price competition in the bottled water industry might mirror that of the carbonated soft drink industry. Fierce price compe- tition could be expected to bring volume gains but
- 18. result in flat or declining revenues for the bottled water industry. Coca-Cola, Nestle, and PepsiCo had avoided strong price competition through 2004, but during the first six months of 2005 all three of the industry's largest sellers began to offer considerable discounts on 12- and 24-bottle multipacks to boost unit volume. Exhibit 5 presents average U.S. retail prices for 24-bottle multipacks marketed by Nestle Waters, Coca-Cola, and PepsiCo between 2003 and the first six months of 2005. The world's largest sellers of bottled water ap- peared to be positioning for industry maturity by purchasing smaller regional brands. Nestle had ac- quired bottled water producers and entered into joint ventures in Poland, Hungary, Russia, Greece, France, Turkey, Algeria, South Korea, Indonesia, and Saudi Arabia between 2000 and 2006. Danone Waters also made a number of acquisitions and entered into stra- tegic alliances and j oint ventures during the early 2000s to increase penetration of selected emerging and developed markets. Danone and Nestle had long competed against each other in most country markets, but PepsiCo and Coca-Cola were also becoming global sellers of bottled water. Coca-Cola had used a joint venture with Danone Waters to increase its bottled water product line in the United States beyond Dasani and acquired established brands in Europe and Australia to build strength in markets outside the United States. PepsiCo expanded into international markets for bottled water by allowing foreign bottling fran- chisees to license the Aquafina brand. The strategic maneuvering had created a more globally competi-
- 19. tive environment in which the top sellers met each other in almost all of the world's markets and made it difficult for regional sellers to survive. California- based Palomar Mountain Spring Water was one of many casualties of intensifying competibve rivalry. Like many other independent bottled water compa- nies launched in the 1990s, Palomar was forced into bankruptcy in 2003 after losing key supermarket and discount store contracts. After Palomar lost much of its distribution in California supermarkets and discount stores to Nestle, its 2003 revenues fell to $7 million from $30 million just two years ear- lier. Exhibit 6 illustrates the extent to which the U.S. bottled water market had consolidated by 2003 and 2004. . The introduction of enhanced waters or func- tional waters was the most important product inno- vation since,bottled water gained widespread accep- tance in the United States, with most sellers in 2006 having introduced variations of their products that included flavoring, vitamins, carbohydrates , electro- lytes, and other supplements. The innovation seemed to be a hit with U.S. consumers, as the market for enhanced bottled waters expanded from $20 million ExhilJ 'r- S Average Retail Prices of Multipack Bottled Water Marketed by Nestle Waters, Coca-Cola, and PepsiCo, 2003-2005 - - - - - .. ',. - - T2003 ' ... - .. , ':2004 '''2~ Average Average AV_~ '4 : 24-Pack .24-Pack ·24!P.a I( :Brands ' 'Price Price ' Price
- 20. ... £' ....... • .. Poland Spring $5.89 $5.17 $5.10 (Nestle Waters) Dasani (Coca-Cola) $5.36 $5,88 $5.80 Dannon (Coca-Cola) $4.70 $4.70 $4.35 Aquafina (PepsiCo) $5.24 $5.40 $5.01 * January 2005-June 2005. Source: Morgan Stanley, as reported by the Atlanta Journal- Constitution, June 21,2005. C-55 Case 4 Competition in the Bottled Water Industry in 2006 Exhibit 6 Top Four U.S. Bottled Water Marketers, 2003-2004 ~-"-"-'·"-··o"'··':' 'f"'" ~ ~ ,... t ~ .... " • - .""!("~.... ~ r o ', ~., .·r 0 ,.--' ,.., , , -',0 ~- ";, ~
- 21. 0 0 •• ' '. 2' O~" •. ' ....~.."."'f~2· 0·~03~ ... 04 " '. , , " 't. •-t. _t - • '. .'" : '. :I-!:.., Rank : .... _ --), .. ...... ~ ""'"- ..? _ ...., o' • • :l. - . Comparty - .' Leading Brands _ ~.,$. a... _ 4". ' • _ . . . ..... M.arket Share'., 6.,La __ ~ 1... _ ~ •. Mar~et~ . • ' Share ~ •. • __ • .w Nestle Waters Poland Spring, Deer Park, Arrowhead, 42.1% 39.1% Zephyrhills, Ozarka, Ice Mountain 2 Coca-Cola Dasani, Evian and Dannon 21.9 24.1 3 PepsiCo Aquafina 13.6 14.5
- 22. 4 CG Roxanne Crystal Geyser 7.4 7.0 Others/Private-Label 15.0 15.3 TOTAL 100.0% 100.0% Source: Morgan Stanley, as reported by the Atlanta Journal- Constitution, June 21,2005. in 2000 to approximately $1 billion in 2006. Most sellers of bottled water had yet to make functional waters widely available outside the United States. Energy Brands helped create the enhanced water segment in the United States with its 2000 launch of Glaceau Vitamin Water, which contained a variety of vitamins promoting mental stimulation, physical rejuvenation, and overall improved health. Glaceau was the best-selling brand of enhanced water in 2000 and 2001, but it fell to the number two position in the segment upon PepsiCo's launch of Propel Fitness Water. Propel Fitness Water remained the market leader in the U.S. enhanced water segment in 2006. Energy Brands had achieved a compounded annual growth rate of more than 200 percent between 2000 and 2005, to record estimated sales of $350 million and maintain its number two position in the U.S. functional water category. Coca-Cola, Nestle, and Danone Waters had be- gun testing vitamin-enhanced waters in as early as 2002, but all three had changed their approaches to functional waters by 2006. Coke had given up on vitamin-enhanced waters in favor of flavored water, while Nestle Waters and Danone Waters retained only a fluoride-enhanced water. Like those at Coca- Cola, managers at Nestle and Danone believed that
- 23. flavored waters offered substantial growth opportu- nities in most country markets. The Tata Group, an Indian beverage producer, showed greater confidence in the vitamin-enhanced bottled water market with its purchase of a 30 percent stake in Energy Brands in 2006 for $677 million. The Tata Group's chairman believed that Energy Brands had the potential to be- come a $3 billion company within 10 years. P 0 o L-.-.. a... WATE 5 N estle Waters Nestle was the world's leading seller of bottled water, with a worldwide market share of 18.3 percent in 2006. It was also the world's largest food com- pany, with 2005 sales of 91 billion Swiss francs (ap- proximately $71 billion). The company was broadly diversified into 10 food and beverage categories that were sold in almost every country in the world under such recognizable brand names as Nescafe, Taster's Choice, Perrier, Vittel, Carnation, PowerBar, Friskies, Alpo, Nestea, Libby's, Stouffer's, and of course, Nestle. The company produced bottled water as ear- ly as 1843, but its 1992 acquisition of Perrier created the foundation of what has made Nestle Waters the world's largest seller of bottled water, with 75 brands in 130 countries. In 2005, Nestle recorded bottled water sales of 8.8 billion Swiss francs (approximately $6.9 billion) and was the global leader in the bottled water industry, with an 18.3 percent worldwide mar- ket share in 2005. Nestle Waters was the number one seller of bottled water in the United States with a
- 24. 42.1 percent market share in 2004 and the number one seller in Europe with a 20 percent market share. Nestle was also the number one seller in Africa and the Middle East and was aggressive in its attempts to build market-leading positions in emerging markets Asia and Latin America through the introduction C-56 Part 2 Cases in Crafting and Executing Strategy of global Nestle products and the acquisition of es- tablished local brands. The company acquired nearly 20 bottled water producers between 2001 and 2003 . In 2006, Nestle Waters was the number one brand of bottled water in Pakistan, Vietnam, and Cuba; the number two brand in Indonesia and Argentina; and the number three brand in Thailand. The company's bottled water portfolio in 2006 included two global brands (Nestle Pure Life and Nestle Aqnarel), five international premium brands (Perrier, Vittel, Contrex, Acqua Panna, and S. Pellegrino), and 68 local brands . Nestle Pure Life was a purified water product developed in 1998 for emerging markets and other markets in which spring water was not an important differentiating feature ofbottled water. Nestle Aquarel was developed in 2000 for the European market and markets that pre- ferred still spring water over purified water or spar- kling spring water. Nestle's other waters marketed in Europe were either spring water with a higher mineral content or sparkling waters such as Perrier and S. Pellegrino. Almost all brands marketed out- side of Europe were either spring water or mineral water with no carbonation. Its brands in the United
- 25. States included Pure Life, Arrowhead, Ice Mountain, Calistoga, Deer Park, Zephyrhills, Ozarka, and Poland Spring. During the early 2000s, Nestle Waters manage- ment believed that its broad portfolio of local wa- ter brands was among the company 's key resource strengths. However, the notable success of Nestle's two global brands had caused management to reor- ganize the division in 2006. Pure Life and Aquarel had grown from just 2.5 percent of the division 's sales in 2002 to 12.0 percent of the division's 2005 sales. Consumers in the United States seemed to ac- cept the Pure Life brand as well as long-established local brands, with sales of Nestle Pure Life in the United States increasing by 50 percent between 2004 and 2005. Flavored varieties of Pure Life had also achieved notable success in Canada by capturing a 70 percent share of the flavored water market within the first six months on the market. Nestle's 68 local brands had accounted for as much as 75.7 percent of division sales in 2002, but local brands had declined to 64.8 percent of sales in 2005. The company 's five premium international brands accounted for an ad- ditional 23.2 percent of 2005 sales. Nestle had test-marketed functional waters fortified with vitamins and plant extracts between 2003 and 2004, but offered only fruit-flavored enhanced waters in 2006. Contrex Lemon Meringue and Strawberry Melba were two innovative calorie- free flavors introduced in 2006. The company had also used packaging innovations to differentiate its bottled water brands, including a spill-proof cap for child-sized bottles of Poland Spring, Deer Park
- 26. and Arrowhead. Nestle Waters also developed ~ bubble-shaped bottle that was designed to appeal to children. Perrier's new PET container was part of a strategy to revitalize the prestigious brand, which had experienced annual sales declines since the mid-1990s. The new plastic bottle was intended to better match the on-the-go lifestyles of young consumers than Perrier's heavy one-liter glass con- tainers. Nestle would still package Perrier in glass bottles for consumers who preferred the brand's traditional packaging for dinner parties and other formal settings. Home and office delivery (HOD) was also an im- portant component of Nestle's strategy-especially in North America, Europe, and the Middle East. HOD made up nearly 30 percent of Nestle Waters ' sales volume in the United States and was record- ing double-digit growth in most other country mar- kets in 2005. In 2005, Nestle competed in the HOD market for bottled water in 30 countries. Between 2000 and 2004, the company had made 8 acquisi- tions in the European HOD segment to grow from no presence to the leading position, with 32 percent market share. Nestle had also made acquisitions and entered into joint ventures to develop market lead- ing positions in countries located in the Middle East, Northern Africa, and the Far East. Nestle's market leading positions in Europe and the United States in HOD and PET channels allowed it to earn the status of low-cost leader in the United States. Exhibit 7 illustrates Nestle Waters' cost and wholesale pric- ing advantages relative to Coca-Cola and PepsiCo in U.S. markets. Nestle Waters ' management stated in mid-2002 that it expected to double the division's revenues by 2010.
- 27. Groupe Danone Groupe Danone was established through the 1966 merger of two of France's leading glass makers, who foresaw the oncoming acceptability of plastic as a substitute to glass containers. The management of the newly merged company believed that, rather I r Case 4 Competition in the Bottled Water Industry in 2006 C-S7 c t 'I .r. J, 11 Value Chain Comparison for the Bottled Water Operations of Nestle, PepsiCo, and Coca-Cola Retailer price per case $8.44 $8.52 $8.65 Retailer margin 35.0% 17.5% 17.6% Wholesale price per case $5.49 $7.03 $7.13 Wholesale sales $5.49 $7.03 $7.13 Support revenue 0.00 0.41 0.52 Total bottler revenue $5.49 $7.44 $7.65 Expenses Water * $0.01 $1.67 $1.70
- 28. PET bottles 1.03 1.16 1.16 Secondary packaging 0.61 0.68 0.68 Closures 0.21 0.23 0.23 Labor/manufacturing 0.70 0.70 0.77 Depre~iation 0.07 0.08 0.08 Total cost of goods sold 2.63 4.52 4.62 Gross profit $2.86 $2.92 $3.03 Selling, general, & 2.29 2.25 2.53 administrative EBITA $0.57 $0.67 $0.50 EBITA margin 10.4% 9.0% 6.5% * Includes licensing fees and royalties paid by Coca-Cola and PepsiCo bottlers to Coca-Cola and PepsiCo. Source: Goldman Sachs Global Equity Research as reported by Beverage World, April 2002. than shi fting its focus to the manufacture of plastic volume in 2005 but was displaced by Nestle in both containers, the company should enter markets for · terms of volume and dollar sales during 2006. products typically sold in glass containers. Groupe Danone recorded worldwide bottled water sales Danone's diversification outside of glass containers of €3.4 billion in 2005 . Among Groupe Danone's
- 29. began in 1969 when the company acquired Evian- most important beverage brands were Evian, the France 's leading brand of bottled water. Throughout world's leading brand of spring water, and Wahaha, the 1970s and 1980s, Groupe Danone acquired ad- the leading brand of bottled water in China. ditional food and beverage companies that produced Each brand accounted for more than £1 billion in beer, pasta, baby food, cereals, sauces, confection- sales during 2005. During that year, 40 percent of ery, dairy products, and baked goods. In 1997, the Danone 's bottled water sales originated in Europe, company slimmed its portfolio of businesses to dairy 47 percent were in China, and 13 percent were in products, bottled water, and a baked goods division emerging markets outside of Asia. Danone 's local producing cereal, cookies, and snacks. In 2005 , and regional brands held number one shares in many Groupe Delllone was a leading global food company, country markets such as Denmark, Germany, Spain, with annual sales of€13 billion and was the world's the United Kingdom, Poland, Indonesia, Mexico, largest producer of dairy products, the number two and Morocco. producer of cereal, cookies, and baked snacks, and Like Nestle, Danone had made a number of ac- the second largest seller of bottled water. The com- quisitions of regional bottled water producers dur- pany had been the largest seller of bottled water by ing the late 1990s and early 2000s. During 2002, C-58 Part 2 Cases in Crafting and Executing Strategy Danone acquired a 'controlling interest in Poland's
- 30. leading brand of bottled water for an undisclosed amount and purchased Canada's Sparkling Spring brand of waters for an estimated $300-$400 million. The company also entered into a joint venture with Kirin Beverage Company to strengthen its distribu- tion network in Japan and embarked on a partner- ship with the Rachid Group, an Egyptian firm, to ac- celerate its development of market opportunities in North Africa and the Near and Middle East. During 2003 and 2004, Groupe Danone acquired three HOD bottled water sellers in Mexico. Danone acquired the leading brand ofbottled water in Serbia and an HOD seller in Spain in 2004. In 2006, the company ac- quired a 49 percent stake in Denmark's leading seller of bottled water. Danone Waters ' revenues had declined by nearly 20 percent between 2000 and 2005 as its U. S. dis- tribution agreement with Coca-Cola began to suffer. Prior to Coca-Cola's launch of Dasani, its bottlers distributed Evian and other non-Coke bottled water brands. Before the introduction of Dasani, about 60 percent of Evian's U.S. distribution was handled by Coca-Cola bottlers. With Coca-Cola bottler's atten- tion directed toward the sale of Dasani, Evian lost shelf space in many convenience stores, supermar- kets' delis, restaurants, and wholesale clubs. Danone Waters and Coca-Cola entered into a joint venture in 2002 that allowed Evian and Dannon water brands to be distributed along with Dasani to convenience stores, supermarkets, and other retail locations serviced by Coca-Cola's bottling opera- tions. In addition, the agreement made Coke respon- sible for the production, marketing and distribution of Dannon in the United States. Coca-Cola provided
- 31. Danone an up-front cash payment in return for 51 percent ownership of the joint venture. Danone con- tributed its five plants and other bottled water as- sets located in the United States to the joint venture. However, Evian and Dannon continued to suffer un- der the new distribution arrangement as Coca-Cola continued to put most of its marketing muscle be- hind Dasani. Danone sold its 49 percent interest in the North American bottled water joint venture to Coca-Cola in 2005. Danone's home and office delivery businesses were not included in the agreement with Coca-Cola and were combined with Suntory Water Group's as- sets to form DS Waters in 2003. The combination of Danone Waters' and Suntory Waters assets made the joint venture the largest HOD distributor in the United States, with sales of approximately $800 million. Brands marketed by DS Waters included Alhambra, Crystal Springs, Sierra Springs, Hinckley Springs, Kentwood Springs, Belmont Springs, and Sparkletts. Groupe Danone and Suntory sold 100 percent of DS Waters to a private investment fund in 2005 for an undisclosed sum. The sale result- ed in a €315 million loss for Groupe Danone and completed Groupe Danone's exit from the North American bottled water market. Danone 's HOD business remained the worldwide leader in the cat- egory with number one rankings in Asia, Argentina, and Canada. Groupe Danone was the second larg- est HOD provider in Europe in 2005 through a joint venture with Swiss-based Eden Springs. Groupe Danone had made functional and fla- vored waters a strategic priority for its beverage
- 32. business. The company introduced flavored and vitamin-rich versions of Volvic in Europe during 2003 and 2004, and by 2005 it was selling flavored and functional waters in most of its markets. The company held a number one ranking in functional beverage categories in New Zealand and Argentina. Functional and flavored waters accounted for 25 per- cent of the group's beverage sales in 2005. The Coca-Cola Company With 300 brands worldwide, the Coca-Cola Company was the world's leading manufacturer, marketer, and distributor of nonalcoholic beverage concentrates. The company produced soft drinks, juice and juice drinks, sports drinks, water, and coffee and was best known for Coca-Cola, which has been called the world's most valuable brand. In 2005, the com- pany sold more than 20.6 billion cases of beverages worldwide to record revenues of $23.1 billion. Coca- Cola's net income for 2005 was nearly $4.9 billion. Seventy-three percent of Coke's gallon sales were generated outside ofNorth America, with four inter- national markets (Mexico, Brazil, China, and Japan) accounting for 27 percent of Coca-Cola's sales by volume. Sales in the United States also accounted for 27 percent of the company's total volume. Along with the universal appeal ofthe Coca-Cola brand, Coca-Cola's vast global distribution system that included independent bottlers, bottlers partially owned by Coca-Cola, and company-owned bottlers made Coke an almost unstoppable international C-59 Case 4 Competition in the Bottled Water Industry in 2006
- 33. powerhouse. Coca-Cola held market-leading positions in most countries in the cola segment of the soft drink industry, and the strength of the Coca-Cola brand aided the company in gaining market share in most other soft drink segments such as the lemon- lime and diet segments. The company had also been able to leverage Coke's appeal with consumers to gain access to retail distribution channels for new beverages included in its portfolio such as Minute Nlaid orange juice products, Powerade isotonic bev- erages, and Dasani purified water. The Coca-Cola Company did not market and distribute its own brand of bottled water until 1999, when it introduced Dasani. The company created a purified water that included a combination of mag- nesium sulfate, potassium chloride, and salt to recre- ate what Coke researchers believed were the best attributes of leading spring waters from around the world. The Dasani formula was a closely guarded secret and was sold to bottlers, just as the company sold its Coke concentrate to bottlers. The Dasani name was developed by linguists who suggested the dual "a"s gave a soothing sound to the name, the "s" conveyed crispness and freshness, and the "i" ending added a foreign ring. Dasani was supported with an estimated 5 million advertising budget during its first year on the market and was distributed through ail retail channels where Coke was available. Coca- Cola's U.S. advertising budget for Dasani was $20 million in 2005. Coca-Cola's marketing expertise and vast US. distribution system allowed Dasani to become the second largest brand of water sold in the United States by 2001--a position it continued to hold in 2006.
- 34. Coca-Cola's 2002 joint venture with Danone Waters allowed Coca-Cola to jump to the rank of second largest bottled water producer in the United States and third largest bottled water producer in the world. The joint venture provided Coke with bottled water products at all price points, with Dasani po- sitioned as an upper-midpriced product, Evian as a premium-priced bottled water, and Dannon as a discount-priced water. Coke management believed the addition of Dannon would allow the company to protect Dasani's near-premium pricing, while gain- spring water brands that could be marketed na- tionally to challenge Nestle's regional brands in the spring water segment. Even though the joint venture allowed Coca- Cola's sales of bottled water to increase from $765 million in 2002 to $1.3 billion in 2003, the three-tier strategy seemed to be failing in some regards since Coke's three water brands had collectively lost 2.2 market share points between 2003 and 2004. Coca- Cola's loss ofmarket share seemed to be attributable, to some to degree, to ~est16 's growth during 2004 and the increasing popularity ofprivate-label brands, which had grown by more than 60 percent during 2004. However, some lost market share for the three brands combined might have been a result of weak support for Evian and Dannon brands. Coca-Cola had committed to increasing advertising and pro- motion for Evian by 20 percent between 2005 and 2010, but beverage industry analysts believed it was unlikely that Evian would ever return to its previous top-five ranking in the United States.
- 35. Coca-Cola tested a vitamin- and flavor-enhanced Dasani NutriWater sub-brand during 2002 and 2003, but it abandoned the concept after poor test-market performance. In 2005, the company did go forward with Splenda-sweetened lemon- and raspberry- flavored varieties of Dasani. The company later add- ed strawberry and grape flavors to the Dasani line. Fruit-flavored Dasani had proved to be successful in the market by 2006, with most retailers stocking at least two flavors of Dasani in addition to unflavored Dasani water. Coca-Cola extended the Dasani line in 2006 with the introduction of Dasani Sensations-a flavored water with light carbonation. Like other va- rieties of Dasani, Dasani Sensations contained no calories. Powerade Option was another functional water developed by Coca-Cola that was introduced in 2005. Powerade Option was a competing product to Gatorade Propel Fitness Water and was available in grape and strawberry flavors in 2006. As of 2006, Powerade Option had been largely unsuccessful in capturing share from Propel Fitness Water and was unavail.able in many retail locations. Coca-Cola had long produced and marketed, bottled water in foreign countries under local brand names, such as its Bon Aqua brand in the German market and NaturAqua in Hungary, but began ef- forts to make Dasani an international brand in 2004 with expansion into in Africa, Brazil, and the United Kingdom. Coca-Cola management chose the United Kingdom as its entry point to Western Europe with launches planned for 20 additional European countries by mid-2004. Coca-Cola supported the March 2004 launch of Dasani in the United King- dom with a $3.2 million advertising budget and a
- 36. C-60 Part 2 Cases in Crafting and Executing Strategy 4-million-bottle sampling campaign but voluntarily rccalled all Dasani bottles from retailers' shelves just two weeks after the launch. The recall was predicated on test results per- formed by the company that indicated the bottles were tainted with bromate--a cancer-causing agent. Bromate became introduced to the product when cal- cium, a mandatory ingredient for bottled waters sold in the United Kingdom, was added to Coca-Cola's proprietary formula of minerals used to distinguish Dasani from other bottled waters. The bromate lev- els present in Dasani exceeded regulatory limits in the United Kingdom but met standards for purity on the European c,ontlnent. Nevertheless, Coke man- agement believed it best to recall the product and discontinue imn1ediate plans to distribute Dasani not only in the United Kingdom but also in all other European markets. The Dasani launch was viewed by many in the business press as one of the all-time great marketing disasters and resulted in Coke's abandoning the Dasani brand in Europe. Coca- Cola management announced during a June 2006 Deutsche Bank conference for consumer goods that it would expand its line of noncarbonated beverages in Europe through acquisitions. Within two weeks of the announcement, Coca-Cola had acquired the Italian mineral water company Fonti del Vulture and the Apollinaris mineral water brand sold in Germany by Orangina. Coca-Cola also acquired two HOD bottled water producers in Australia during 2006.
- 37. In 2006, PepsiCo was the world's fourth largest food and beverage company, with sales of approximately $32 billion. The company's brands were sold in more than 200 countries and included such well-known names as Tostitos, Mountain Dew, Pepsi, Doritos, Lipton Iced Tea, Gatorade, Quaker, and Cracker Jack. Six of PepsiCo's products were among the top-IS largest selling products sold in U. S. su- permarkets. PepsiCo also produced and marketed Aquafina-the best-selling brand of bottled water in the United States between 2002 and 2006. PepsiCo had made attempts to enter the bottled water market in as early as 1987, when it purchased a spring water company, but its attempts were un- successful until its 1997 introduction of Aquafina. After experimenting with spring water and sparkling water for several years, Pepsi management believed it would be easier to produce a national brand of bottled water that could utilize the same water pu- rification facilities in Pepsi bottling plants that were used to produce the company's brands of soft Pepsi management also believed that the company could distinguish its brand of purified bottled water from competing brands by stripping all chlorine and other particles out of tap water that might impart an unpleasant taste or smelL PepsiCo began testing a filtration process for Aquafina in 1994 when it in- stalled million worth of reverse osmosis filtration equipment in its Wichita, Kansas, bottling plant to further purify municipal water used to make soft drinks. The system pushed water through a fiberglass membrane at very high pressure to remove chemi- cals and minerals before further purifying the water
- 38. using carbon filters. The water produced Pepsi's process was so free of chemicals that the company was required to add ozone gas to the water prevent bacteria growth. Since the company's introduction of Aquafina, PepsiCo had expanded its water brands in the United States to include Gatorade Propel Fitness Water, SoBe Life Water, and functional versions of Aquafina. The product lines for its water business were developed around customer type and lifestyle. Propel was a flavor- and vitamin-enriched water marketed to physically active consumers, while Life Water was a vitamin-enhanced water similar to Glaceau Vitamin Water in formulation and packag- ing that was marketed to image-driven consumers. The company targeted mainstream water consumers with unflavored Aquafina~ Aquafina FlavorSplash (offered in four flavors) I and Aquafina Sparkling (a zero-calorie, lightly carbonated citrus or berry- flavored water). Aquafi.na Alive, planned for a 2007 launch, included vitamins and natural fruit The company's strategy involved offering a contin- uum of healthy beverages from unflavored Aquafina to nutrient-rich Gatorade. In 2006, Gatorade, Propel, and Aquafina were all number one in their catego- ries, with market shares of 80 percent, 34 percent, and approximately 14 percent, respectively. PepsiCo was slowly moving into international bottled water markets, with its most notable effort occurring in Mexico. In 2002, PepsiCo's bottling operations acquired :Mexico's largest Pepsi bottler, Pepsi -Gemex SA de Cv, for $1.26 billion. Gemex not only bottled and distributed Pepsi soft drinks in Mexico but also was Mexico's number one producer
- 39. http:Aquafi.na Case 4 Competition in the Bottled Water in 2006 C-61 of purified water. After its acquisition of Gemex, PepsiCo shifted its international expansion efforts to bringing Aquafina to selected emerging markets in Eastern Europe, the Middle and Asia. In 2006, Aquafina was the number one brand of bottled water in Russia and Vietnam and the number two brand in Kuwait. In addition to the industry's ""'........ LL';;., tIed water, there were hundreds of and spe- cialty brands of bottled water in the United States. Most of these companies were privately held bottlers with distribution limited to small geographic that competed aggressively on price to make it onto convenience store and supermarket shelves as third- tier brands. Many of these bottlers also sought out private-label contracts with discounters and large supermarket chains to better ensure full capacity uti- lization and to achieve sufficient volume to purchase bottles and other packaging at lower prices. CG Roxanne was the most successful privately owned bottled water company in the United States. The company's Crystal Geyer brand made it the fourth largest seller of bottled water in the United States in with a 7.4 market share. Crystal competed at the lower price points in U.S. supermarkets and convenience stores and was bot- tled from in California, Tennessee, South Carolina, and New Hampshire. The company did not
- 40. disclose its financial performance. Another group of small bottlers such as Penta and Trinity used differentiating features to avoid the fierce competition at the low end of the market and sold in the superpremium segment, where bottled water retailed from $1.50 to $2.25 per 16-ounee PET container. Superpremium brands were most often sold in natural foods stores, with Trinity Springs being among the leaders in the channel in 2005. Trinity's differentiation was based on its water source, which was a 2.2-mile-deep arte- sian well located in the Trinity rv10untains of Idaho. Trinity Springs' distribution halted in March 2006 Endnote when a court invalidated the 2004 sale of the com- pany to Amcon Distributing. which had lost $2 million in fiscal 2005 and another $1.8 million during the first six months of fiscal 2006, shut down its Trinity Springs water division after the and was negotiating a settlement with Trinity shareholders in late 2006. Penta's differentiation was based on a propri- etary purification system that the company claimed removed 100 of impurities from tap wa- ter. The company had also built brand recognition through product placements in motion pictures, mu- sic and more than 25 television series. Penta also sponsored a large number of triathlons across the United States and was endorsed a wide variety of entertainers and professional athletes. In 2006, Penta was distributed in more than 5,000 health food
- 41. stores in the enited States. Penta was also avail- able in Australia, Japan, the United Kingdom, and Canada. was also among the best-selling brands of superpremium water sold in natural foods stores in 2006 but was also sold in many supermarkets, convenience stores, and drugstores aeross the United States. Like Penta, received considerable expo- sure from its placement in network television series and motion pictures. Voss achieved differentiation not only from the purity of its source in Norway but also through its distinctive glass bottle and limited channels of dis- tribution. The brand was available only in the most exclusive hotels, spas, and resorts. Another super- premium brand, Eon, achieved its differentiation through its anti-aging claims. The company's anti- aging properties were said to result from the basic atomic structure of Eon water, which was altered through a proprietary reverse osmosis technology. The structure ofEon was similar to that naturally oc- curring in snowflakes and ice and was sug- gested to improve cellular hydration and cell detoxi- fication properties better than unstructured water. Many. other superpremium brands of bottled water were sold in the United States during 2006, with each attempting to support its premium pricing with some unique characteristic. As quoted in "The Taste of Water," Bottled Water Web, Statistics I - Adiletta 1 Statistics Correlation Worksheet Name: _________________________
- 42. Ice Cream Sales Answer the following questions, showing any calculations involved. Include this document along with the graphs created with Minitab in your submission. 1. Identify the independent (predictor) and dependent (response) variables. [2 pts] Independent variable: __________________ Dependent variable: __________________ 2. From the scatter diagram, does there seem to be a linear correlation? If so, is it strong or weak? Is it positive or negative? What does it say about the relationship between the 2 variables? [4 pts] 3. Use your scatter diagram to answer the following questions. a. If you calculated the linear correlation coefficient for this data to be r = –0.75, explain in one sentence how you know this is incorrect. [2 pts] b. If you calculated the linear correlation coefficient for this
- 43. data to be r = 1.20, explain in one sentence how you know this is incorrect. [2 pts] 4. What is the correlation coefficient, r. Based on the correlation coefficient, how accurate do you think your regression equation is at making a prediction? Why? [2 pts] 5. What is the p-value? Is a linear relationship appropriate? How do you know? [2 pts] 6. Identify the following quantities: [3 pts] Regression Equation: ______________________________ Slope: _______________ y-Intercept: _______________ 7. Explain the meaning of the slope in terms of this problem. [5
- 44. pts] 8. Explain the meaning of the y-intercept in terms of this problem. Is it meaningful? Why or why not? [5 pts] 9. Predict the ice cream cone sales on a day where the high temperature was 75°. Show all work here and round to 2 decimals. [2 pts] 10. On a 70° day, the Creamery had sales of 400 ice cream cones. Is this sales figure above or below the average for this temperature? Show your work for credit. [2 pts]
- 45. 11. Answer the following questions. a. The high temperature on Saturday is predicted to be 75°. Would it be reasonable to use the regression equation you created to predict this day’s sales? Why or why not? [2 pts] b. The high temperature on Sunday is predicted to be 85°. Would it be reasonable to use the regression equation you created to predict this day’s sales? Why or why not? [2 pts] c. The high temperature on Sunday at the Creamery’s Buffalo store is predicted to be 74°. Would it be reasonable to use the regression equation you created to predict this store’s sales? Why or why not? [2 pts]
- 46. 12. Compute and interpret R2. [4 pts] Minitab Commands: Correlation Stat > Basic Statistics > Correlation Enter both variables > OK Regression Analysis Stat > Regression > Regression > Fit Regression Model Responses: Enter response variable Continuous predictors: Enter predictor variable > OK Fitted Line Plot & Regression Equation Stat > Regression > Fitted Line Plot Enter Response and Predictor variables > OK To create a Residual Plot in Minitab Stat > Regression > Fitted Line Plot. Enter Response and Predictor variables Be sure Type of Regression Model is Linear Graphs > In the cell that says “Residuals versus the variables,” enter the name of the explanatory variable. OK > OK
- 47. Five Forces Analysis – MGMT 425 Rubric Failing Poor Acceptable Exceptional Points Power of Buyers Incorrect identification of relevant buyers and impact on industry.(0) Correctly identifies one or two relevant buyers, but unclear or weak discussion of factors that shape impact of buyers on industry. (1) Correctly identifies relevant buyers and supports choices with a discussion of one factor that shapes impact of buyers on industry. (2) Correctly identifies relevant buyers and supports choice with a discussion of two or more factors that shape impact of buyers on industry. (3) Power of Suppliers Incorrect identification of relevant suppliers and impact on industry. (0) Correctly identifies one or two relevant suppliers, but unclear or weak. discussion of factors that shape impact of suppliers on industry. (1) Correctly identifies relevant suppliers and supports choices with a discussion of one factor that shapes impact of suppliers on industry. (2) Correctly identifies relevant suppliers and supports choice with a discussion of two or more factors that shape impact of suppliers on industry. (3)
- 48. Strength of Rivalry Incorrect assessment of rivalry and factors that drive industry rivalry. (0) Correctly assesses rivalry, but unclear or weak discussion of factors that shape industry rivalry. (1) Correctly assesses rivalry and provides a discussion of one factor that shapes industry rivalry. (2) Correctly assesses rivalry and provides a discussion of two or more factors that shape industry rivalry. (3) Strength of Substitutes Incorrect identification of substitutes and impact on industry. (0) Correctly identifies relevant substitutes, but unclear or weak discussion of factors that shape the impact of substitutes on industry. (1) Correctly identifies relevant substitutes and supports choices with a discussion of one factor that shapes the impact of substitutes on industry. (2) Correctly identifies relevant substitutes and supports choices with a discussion of two or more factors that shape the impact of substitutes on industry. (3) Threat of Entry Incorrect identification of entry threats and impact on industry. No discussion of entry barriers. (0) Correctly identifies entry threats, but unclear or weak discussion of factors that impact the threat of entry. Mentions entry barriers, but limited discussion of impact. (1) Correctly identifies entry threats and supports choices with a discussion of one factor that impacts the threat of entry. Mentions entry barriers and discusses impact. (2) Correctly identifies entry threats and supports choices with a discussion of two or more factors that impact the threat of entry. Mentions entry barriers and discusses impact. (3)
- 49. Case: Competition in the Bottled Water Industry in 2006 McGraw-Hill/Irwin Copyright © 2010 by The McGraw-Hill Companies, Inc. All rights reserved. Chapter 3: Evaluating a Company’s External Environment Screen graphics created by: Jana F. Kuzmicki, Ph.D. Troy University * McGraw-Hill/Irwin Copyright © 2010 by The McGraw-Hill Companies, Inc. All rights reserved. “Analysis is the critical starting point of strategic thinking.” Kenichi Ohmae Consultant and Author * McGraw-Hill/Irwin
- 50. Copyright © 2010 by The McGraw-Hill Companies, Inc. All rights reserved. “Things are always different – the art is figuring out which differences matter.” Laszlo Birinyi Investments Manager * 3-* Chapter Learning Objectives To gain command of the basic concepts and analytical tools widely used to diagnose a company’s industry and competitive conditions. To become adept in recognizing the factors that cause competition in an industry to be fierce, more or less normal, or relatively weak. To learn how to determine whether an industry’s outlook presents a company with sufficiently attractive opportunities for growth and profitability. To understand why in-depth evaluation of specific industry and competitive conditions is a prerequisite to crafting a strategy well matched to a company’s situation. * 3-*
- 51. Chapter RoadmapThe Strategically Relevant Components of a Company’s External EnvironmentThinking Strategically About a Company’s Industry and Competitive EnvironmentQuestion 1: What Are the Industry’s Dominant Economic Features?Question 2: How Strong Are Competitive Forces?Question 3: What Forces Are Driving Industry Change and What Impacts Will They Have?Question 4: What Market Positions Do Rivals Occupy—Who Is Strongly Positioned and Who Is Not?Question 5: What Strategic Moves Are Rivals Likely to Make Next?Question 6: What Are the Key Factors for Future Competitive Success?Question 7: Does the Outlook for the Industry Offer the Company a Good Opportunity to Earn Attractive Profits? * 3-* Diagnosing a company’s situation has two facetsAssessing the company’s external or macro-environment Industry and competitive conditions Forces acting to reshape this environmentAssessing the company’s internal or micro-environment Market position and competitiveness Competencies, capabilities, resource strengths and weaknesses, and competitiveness Understanding the Factors that Determine a Company’s Situation
- 52. *
- 53. 3-* Figure 3.1: From Thinking Strategically About the Company’s Situation to Choosing a Strategy 3-* * 3-* Figure 3.2: The Components of a Company’s Macro- environment 3-* * 3-* Thinking Strategically About a Company’s Macro-environmentA company’s macro- environment includes all relevant factors and influences outside its boundariesDiagnosing a company’s external situation involves assessing strategically important factors that have a bearing on the decisions a company’s makes about
- 54. itsDirectionObjectivesStrategyBusiness modelRequires that company managers scan the external environment toIdentify potentially important external developmentsAssess their impact and influenceAdapt a company’s direction and strategy as needed * 3-* Key Questions Regarding the Industry and Competitive Environment 3-*
- 55. What are the industry’s dominant economic traits? How strong are competitive forces? What forces are driving change in the industry? What market positions do rivals occupy? What moves will they make next? What are the key factors for competitive success? How attractive is the industry from a profit perspective? * 3-* Market size and growth rateNumber of rivalsScope of competitive rivalryBuyer needs and requirementsDegree of product differentiationProduct innovationSupply/demand conditionsPace of technological changeVertical integrationEconomies of scaleLearning and experience curve effects Question 1: What are the Industry’s Dominant Economic Traits? 3-* Table 3.1: What to Consider in Identifying an Industry’s Dominant Economic Features
- 56. 3-* * 3-* Learning/Experience EffectsLearning/experience effects exist when a company’s unit costs decline as its cumulative production volume increases because of Accumulating production know-how Growing mastery of the technology The bigger the learning or experience curve effect, the bigger the cost advantage of the firm with the largest cumulative production volume 3-* Question 2: How Strong Are Competitive Forces?Objectives are to identify Main sources of competitive forces Strength of these forcesKey analytical tool Five Forces Model of Competition * 3-*
- 57. Figure 3.3: The Five Forces Model of Competition 3-* * 3-* Analyzing the Five Competitive Forces: How to Do It Step 1: Identify the specific competitive pressures associated with each of the five forces Step 2: Evaluate the strength of each competitive force – fierce, strong, moderate to normal, or weak? Step 3: Determine whether the collective strength of the five competitive forces is conducive to earning attractive profits 3-* Usually the strongest of the five forcesKey factor in determining strength of rivalryHow aggressively are rivals using various weapons of competition to improve their market
- 58. positions and performance?Competitive rivalry is a combative contest involvingOffensive actionsDefensive countermoves Competitive Pressures Among Rival Sellers * 3-* Figure 3.4: Weapons for Competing and Factors Affecting Strength of Rivalry 3-* * 3-* What Are the Typical Weapons for Competing? Lower pricesMore or different performance featuresBetter product performanceHigher qualityStronger brand image and appealWider selection of models and stylesBigger/better dealer networkLow interest rate financingBetter or more adsStronger product innovation capabilitiesBetter customer serviceStronger
- 59. capabilities to provide buyers with custom-made products 3-* * 3-* Competitors are active in making fresh moves to improve market standing and business performanceSlow market growthNumber of rivals increases and rivals are ofequal size and competitive capabilityBuyer costs to switch brands are lowIndustry conditions tempt rivals to use price cuts or other competitive weapons to boost volumeA successful strategic move carries a big payoffDiversity of rivals increases in terms of visions, objectives, strategies, resources, and countries of originOutsiders acquire weak firms in the industry and use their resources to transform new firms into major market contenders What Causes Rivalry to be Stronger? 3-* Industry rivals move only infrequently or in a non-aggressive manner to draw sales from rivalsRapid market growthProducts of rivals are strongly
- 60. differentiated and customer loyalty is highBuyer costs to switch brands are highThere are fewer than 5 rivals or there are numerous rivals so any one firm’s actions has minimal impact on rivals’ business What Causes Rivalry to be Weaker? 3-* Test Your Knowledge The rivalry among competing sellers in an industry intensifies A. when buyer demand for the product is growing rapidly. B. when customers are brand loyal and their costs to switch to competing brands or substitute products are relatively high. C. when buyer demand is strong and sellers have little or no excess capacity and only minimal inventories. D. as the number of rivals increases and as they become more equal in size and competitive capability. E. when the products of rival sellers are highly differentiated products and the industry consists of so many rivals that any one company’s actions have little direct impact on rivals’ business. Answer: D 3-* Seriousness of threat depends onSize of pool of entry candidates and available resourcesBarriers to entryReaction of existing firmsEvaluating threat of entry involves assessingHow formidable entry barriers are for each type of potential entrant
- 61. andAttractiveness of growth and profit prospects Competitive Pressures Associated With Potential Entry
- 62. * 3-* Figure 3.5: Factors Affecting Threat of Entry 3-* * 3-* Sizable economies of scaleCost and resource disadvantages independent of sizeBrand preferences and customer loyaltyCapital requirements and/or other specialized resource requirementsAccess to distribution channelsRegulatory policiesTariffs and international trade restrictionsAbility of industry incumbents to launch vigorous initiatives to block a newcomer’s entry Common Barriers to Entry
- 63. 3-* There’s a sizable pool of entry candidatesEntry barriers are lowIndustry growth is rapid and profit potential is highIncumbents are unwilling or unable to contest a newcomer’s entry effortsWhen existing industry members have a strong incentive to expand into new geographic areas or new product segments where they currently do not have a market presence When Is the Threat of Entry Stronger? * 3-* There’s only a small pool of entry candidatesEntry barriers are highExisting competitors are struggling to earn good profitsIndustry’s outlook is riskyIndustry growth is slow or stagnantIndustry members will strongly contest efforts of new entrants to gain a market foothold When Is the Threat of Entry Weaker? * 3-*
- 64. Competitive Pressures from Substitute Products Substitutes matter when customers are attracted to the products of firms in other industries Sugar vs. artificial sweetenersEyeglasses and contact lens vs. laser surgeryNewspapers vs. TV vs. Internet Concept Examples
- 67. * 3-* How to Tell Whether Substitute Products Are a Strong ForceWhether substitutes are readily available and attractively pricedWhether buyers view substitutes as being comparable or betterHow much it costs end users to switch to substitutes
- 70. * 3-* Figure 3.6: Factors Affecting Competition From Substitute Products 3-* *
- 71. 3-* There are many good substitutes readily availableSubstitutes are attractively pricedThe higher the quality and performance of substitutesThe lower the end user’s switching costsEnd users grow more comfortable with using substitutes When Is the Competition From Substitutes Stronger? * 3-* Good substitutes are not readily available or do not existSubstitutes are higher priced relative to performance they deliverEnd users incur high costs in switching to substitutes When Is the Competition From Substitutes Weaker? * 3-* Whether supplier-seller relationships represent a weak or strong competitive force depends onWhether suppliers can exercise sufficient bargaining leverage to
- 72. influence terms of supply in their favorNature and extent of supplier-seller collaboration in the industry Competitive Pressures From Suppliers and Supplier-Seller Collaboration * 3-* Figure 3.7: Factors Affecting Bargaining Power of Suppliers 3-* * 3-* Industry members incur high costs in switching their purchases to alternative suppliersNeeded inputs are in short supplySupplier provides a differentiated input that enhances the quality of performance of sellers’ products or is a valuable
- 73. part of sellers’ production processThere are only a few suppliers of a specific inputSome suppliers threaten to integrate forward When Is the Bargaining Power of Suppliers Stronger? * 3-* Item being supplied is a commoditySeller switching costs to alternative suppliers are lowGood substitutes exist or new ones emergeSurge in availability of supplies occursIndustry members account for a big fraction of suppliers’ total salesIndustry members threaten to integrate backwardSeller collaboration with selected suppliers provides attractive win-win opportunities When Is the Bargaining Power of Suppliers Weaker? * 3-* Industry members often forge strategic partnerships with select suppliers toReduce inventory and logistics costsSpeed availability of
- 74. next-generation componentsEnhance quality of parts being suppliedSqueeze out cost savings for both partiesCompetitive advantage potential may accrue to those industry members (sellers) doing the best job of managing supply-chain relationships Competitive Pressures: Collaboration Between Sellers and Suppliers * 3-* Whether the relationships between industry members and buyers represent a weak or strong competitive force depends onWhether buyers have sufficient bargaining leverage to influence terms of sale in their favorExtent and competitive importance of strategic partnerships between certain industry members and the buyers Competitive Pressures From Buyers and Seller-Buyer Collaboration * 3-*
- 75. Figure 3.8: Factors Affecting Bargaining Power of Buyers 3-* * 3-* Buyer switching costs to competing brands or substitutes are lowBuyers are large and can demand concessionsLarge-volume purchases by buyers are important to sellersBuyer demand is weak or decliningOnly a few buyers existsIdentity of buyer adds prestige to seller’s list of customersQuantity and quality of information available to buyers improvesBuyers have ability to postpone purchases until laterBuyers threaten to integrate backward When Is the Bargaining Power of Buyers Stronger? * 3-* Buyers purchase item infrequently or in small quantitiesBuyer switching costs to competing brands are highSurge in buyer demand
- 76. creates a “sellers’ market”Seller’s brand reputation is important to buyerA specific seller’s product delivers quality or performance that is very important to buyerBuyer collaboration with selected sellers provides attractive win-win opportunities When Is the Bargaining Power of Buyers Weaker? * 3-* Partnerships between industry members and some/many of their customers can impact competitive pressuresCollaboration may result in mutual benefits regardingJust-in-time deliveriesOrder processingElectronic invoice paymentsData sharingCompetitive advantage may accrue to those industry members doing the best job of partnering with their customers Competitive Pressures: Collaboration Between Sellers and Buyers * 3-*
- 77. For Discussion: Your Opinion Explain why low switching costs and weakly differentiated products tend to give buyers a high degree of bargaining power. Buyers with low switching costs can more readily switch brands or sources from several sellers than buyers who have high switching costs. When the products of rivals are virtually identical, i.e. weakly differentiated, it is relatively easy for buyers to switch from seller to seller at little or no cost. 3-* Competitive environment is unattractive from the standpoint of earning good profits whenRivalry is vigorousEntry barriers are low and entry is likelyCompetition from substitutes is strongSuppliers and customers have considerable bargaining power Strategic Implications of the Five Competitive Forces * 3-* Competitive environment is ideal from
- 78. a profit-making standpoint whenRivalry is moderateEntry barriers are high and no firm is likely to enter Good substitutes do not existSuppliers and customers are in a weak bargaining position Strategic Implications of the Five Competitive Forces * 3-* Objective is to craft a strategy toInsulate firm from competitive pressuresInitiate actions to produce sustainable competitive advantageAllow firm to be the industry’s “mover and shaker” with the “most powerful” strategy that defines the business model for the industry Coping With the Five Competitive Forces * 3-*
- 79. Question 3: What Forces Are Driving Industry Change and What Impacts Will They Have?Industries change because forces are driving industry participants to alter their actionsDriving forces are the major underlying causes of changing industry and competitive conditionsWhere do driving forces originate?Outer ring of macroenvironmentInner ring of macroenvironment * 3-* STEP 1: Identify forces likely to exert greatest influence over next 1 - 3 yearsUsually no more than 3 - 4 factors qualify as real drivers of change
- 80. STEP 2: Assess impactAre driving forces acting to cause market demand for product to increase or decrease?Are driving forces acting to make competition more or less intense?Will driving forces lead to higher or lower industry profitability? STEP 3: Determine what strategy changes are needed to prepare for impacts of driving forces Analyzing Driving Forces: Three Key Steps
- 81. * 3-* Changes in long-term industry growth rateIncreasing globalization of industryEmerging new Internet capabilities and applicationsChanges in who buys the product and how they use itProduct innovationTechnological
- 82. change/process innovationMarketing innovation Common Types of Driving Forces 3-* Entry or exit of major firmsDiffusion of technical knowledgeChanges in cost and efficiencyConsumer preferences shift from standardized to differentiated products (or vice versa)Changes in degree of uncertainty and riskRegulatory policies / government legislationChanging societal concerns, attitudes, and lifestyles Common Types of Driving Forces (con’t) 3-* Table 3.2: The Most Common Driving Forces 3-* * 3-*
- 83. Question 4: What Market Positions Do Rivals Occupy?One technique to reveal different competitive positions of industry rivals is strategic group mappingA strategic group is a cluster of firms in an industry with similar competitive approaches and market positions * 3-* Firms in same strategic group have two or more competitive characteristics in commonHave comparable product line breadthSell in same price/quality rangeEmphasize same distribution channelsUse same product attributes to appeal to similar types of buyersUse identical technological approachesOffer buyers similar servicesCover same geographic
- 84. areas Strategic Group Mapping 3-* STEP 1: Identify competitive characteristics that differentiate firms in an industry from one another STEP 2: Plot firms on a two-variable map using pairs of these differentiating characteristics STEP 3: Assign firms that fall in about the same strategy space to same strategic group STEP 4: Draw circles around each group, making circles proportional to size of group’s respective share of total industry sales Procedure for Constructing a Strategic Group Map 3-* Example: Strategic Group Map of Selected Automobile Manufacturers 3-* *
- 85. 3-* Variables selected as axes should not be highly correlatedVariables chosen as axes should expose big differences in how rivals competeVariables do not have to be either quantitative or continuousDrawing sizes of circles proportional to combined sales of firms in each strategic group allows map to reflect relative sizes of each strategic groupIf more than two good competitive variables can be used, several maps can be drawn Guidelines: Strategic Group Maps 3-* Interpreting Strategic Group MapsThe closer strategic groups are on the map, the stronger the cross-group competitive rivalry tends to beNot all positions on the map are equally attractiveDriving forces and competitive pressures often favor some strategic groups and hurt othersProfit potential of different strategic groups varies due to strengths and weaknesses in each group’s market
- 86. position 3-* Test Your Knowledge A strategic group map is a helpful analytical tool for A. assessing why competitive pressures and driving forces usually impact the biggest strategic groups more so than the smaller groups. B. determining which companies have how big a competitive advantage and how good their prospects are for increasing their market shares. C. determining which company is the most profitable in the industry and why it is doing so well. D. determining who competes most closely with whom; evaluating whether industry driving forces and competitive pressures favor some strategic groups and hurt others; and ascertaining whether the profit potential of different strategic groups varies due to the strengths and weaknesses in each group’s respective market positions. E. pinpointing which of the five competitive forces is the strongest and which is the weakest. Answer: D 3-* A firm’s best strategic moves are affected byCurrent strategies of competitorsFuture actions of competitors Profiling key rivals involves gathering
- 87. competitive intelligence aboutCurrent strategiesMost recent actions and public announcementsResource strengths and weaknessesEfforts being made to improve their situationThinking and leadership styles of top executives Question 5: What Strategic Moves Are Rivals Likely to Make Next? * 3-* Sizing up strategies and competitive strengths and weaknesses of rivals involves assessingWhich rival has the best strategy? Which rivals appear to have weak strategies?Which firms are poised to gain market share, and which ones seen destined to lose ground?Which rivals are likely to rank among the industry leaders five years from now? Do any up- and-coming rivals have strategies and the resources to overtake the current industry leader? Competitor Analysis
- 88. 3-* Which rivals need to increase their unit sales and market share? What strategies are rivals most likely to pursue?Which rivals have a strong incentive, along with resources, to make major strategic changes?Which rivals are good candidates to be acquired? Which rivals have the resources to acquire others?Which rivals are likely to enter new geographic markets?Which rivals are likely to expand their product offerings and enter new product segments? Things to Consider in Predicting Moves of Rivals 3-* For Discussion: Your Opinion Why does a company need to bother with studying competitors and trying to predict what moves rivals will make next? Why can’t it just choose whatever strategy it wants or make whatever moves in the marketplace it wishes without first worrying about what rivals are going to do?
- 89. Having good information to predict the strategic direction and likely next moves of key rivals allows a company to prepare defensive countermoves, to craft its own strategic moves with some confidence about what market maneuvers to expect from rivals, and to exploit any openings that arise from competitors’ missteps or strategy flaws. If a company neglects studying its competitors, it risks being caught unaware when rivals make fresh, bold strategic moves; thus, a company is likely to lose ground in the marketplace. 3-* Key Success Factors (KSFs) are competitive factors and attributes that affect every industry member’s ability to be competitively and financially successfulKSFs are those particular attributes that are so important that they spell the difference betweenProfit and lossCompetitive success or failure KSFs can relate toSpecific strategy elementsProduct attributesResourcesCompetenciesCompetitive capabilitiesMarket achievements Question 6: What Are the Key Factors for Competitive Success?
- 90. * 3-* The answers to 3 questions often help pinpoint an industry’s KSFsOn what basis do customers choose between competing brands of sellers?What resources and competitive capabilities does a company need to have to be competitively successful?What shortcomings are likely to place a company at a significant competitive disadvantage?Rarely are there more than 5 - 6 factors that are truly key to the future financial and competitive success of industry members Identifying Industry Key Success Factors 3-* Table 3.3: Common Types of Industry Key Success Factors
- 91. 3-* * 3-* Access to distribution – to get a company’s brand stocked and favorably displayed in retail outletsImage – to induce consumers to buy a particular company’s product (brand name and attractiveness of packaging are key deciding factors)Low-cost production capabilities – to keep selling prices competitiveSufficient sales volume – to achieve scale economies in marketing expenditures Example: KSFs for Bottled Water Industry * 3-* Example: KSFs for Ready-to-Wear Apparel IndustryAppealing designs and color combinations – to create buyer appealLow-cost manufacturing efficiency – to keep selling prices competitiveStrong network of
- 92. retailers/company-owned stores – to allow stores to keep best-selling items in stockClever advertising – to effectively convey a specific image to induce consumers to purchase a particular label * 3-* Involves assessing whether the industry and competitive environment presents a company with an attractive or unattractive opportunity for earning good profitsFactors to consider:Industry growth potentialWhether competitive forces are growing stronger/weakerWhether driving forces will favorable/unfavorably impact industry profitabilityDegree of risk and uncertainty in industry’s futureWhether the industry confronts severe problemsFirm’s competitive position in industry vis-à-vis rivalsFirm’s potential to capitalize on industry opportunities or the vulnerabilities of weaker rivalsWhether a firm has sufficient competitive strength to defend against unattractive industry factors Question 7: Does the Outlook for the Industry Offer an Attractive Opportunity? *
- 93. 3-* Factors to Consider in Assessing Industry AttractivenessAs a general propositionIf an industry’s overall profit prospects are above average, the industry environment is basically attractiveIf an industry’s overall profit prospects are below average, the industry environment is basically unattractiveHoweverAttractiveness is relative, not absoluteConclusions about attractiveness have to be drawn from the perspective of a particular company * 3-* An industry is unlikely to be equally attractive or unattractive to all industry members Industry environments attractive to strong competitors may be unattractive to weak competitorsA favorably positioned company may survey an industry environment and see opportunities that weak competitors have little or no ability to captureIndustry environments attractive to insiders may be unattractive to potential entrantsUnder certain circumstances, a firm uniquely well-situated in an otherwise unattractive industry can still earn good profits by taking sales and market share away from weaker competitors Factors to Consider in Assessing Industry Attractiveness
- 94. 3-* Core Concept: Assessing Industry Attractiveness The degree to which an industry is attractive or unattractive is not the same for all industry participants or potential entrants. The opportunities an industry presents depend partly on a company’s ability to capture them. 3-* * 3-* Test Your Knowledge Which of the following is not an important factor for company managers to consider in drawing conclusions about whether the industry presents an attractive opportunity? A. Whether powerful competitive forces are squeezing industry
- 95. profitability to subpar levels and whether competition appears destined to grow stronger or weaker B. The industry’s growth potential and the degree of uncertainty and risk in the industry’s future C. Whether industry profitability will be affected favorably or unfavorably by the prevailing driving forces D. How many of the industry’s key success factors do companies in the industry typically incorporate into their strategies E. The company’s ability to capitalize on the vulnerabilities of weakly positioned rivals and whether the company has sufficient competitive strength to defend against or counteract the factors that make the industry unattractive Answer: D ASSIGNMENTS Written Case Assignment #1 – Case: ____________ (100 points total) For the first case you are to do an external analysis of the industry in which the company competes. Your paper must be no longer than 5 double-spaced pages (12pt font). Please write in complete sentences, using proper grammar and spelling, but remember, this is a report – not an essay. Use Chapter 3 concepts to guide your work. The format/subheadings must be as follows: Rubric 5 points 1. Major economic features of the industry, including, but not limited to market size, market growth rate, number of rivals, scope of rivalry, number of buyers etc. (Text Table 3.1). Describe only those features that are relevant to the case.
- 96. 15 points 2. The industry’s competitive (five) forces. You must discuss all five forces. Make sure to properly identify rivals, supplies/suppliers, buyers, and substitutes. Don’t forget to asses the strength of each force. Make sure you identify two or more factors that support your strength assessment (each with an example from the case) (Text Figures 3.3 – 3.8). You should use the format below to guide your writing. a. Rivalry in the industry is____________ (strong, weak, or moderate) because___________. b. Suppliers to the industry provide_(what?)_____. They are (strong, weak, or moderate) __________, because___________. c. Buyers of the product are__(who?)______. They are__________ (strong, weak, or moderate), because____________. d. Substitutes are ____(what?)_____. They are _________(strong, weak, or moderate), because____________. e. Threat of entry of new competitors is __________(strong, weak, or moderate), because_________. The barriers to entry are _(what?)_____. 10 points 3. Factors that are causing major long-term industry change (driving forces). Please identify the appropriate categories and provide an example from the case for each category (Text Table 3.2). This section should discuss at least 3 driving forces. 10 points 4. Key success factors. Please identify the relevant types of key success factors and provide an example from the case for each type (Text Table 3.3). This section should contain at least 3,
- 97. but no more than 6 key success factors. 10 points Proper spelling, grammar and formatting, paper length, appropriate style and word choice, section headings, fonts and margins.