
Recommended
Recommended
More Related Content
What's hot
What's hot (20)
Viewers also liked
Similar to Ps53
Similar to Ps53 (20)
Ps53
- 1. Asian Social Science; Vol. 8, No. 13; 2012 ISSN 1911-2017 E-ISSN 1911-2025 Published by Canadian Center of Science and Education Evaluating Factors Influencing Consumer Satisfaction towards Online Shopping in China Xiaoying Guo1, Kwek Choon Ling1 & Min Liu2 1 Faculty of Business and Information Systems, UCSI University, Kuala Lumpur, Malaysia 2 Faculty of Education, Beijing Normal University, Beijing, China Correspondence: Kwek Choon Ling, Faculty of Business and Information Systems, UCSI University, 1, Jalan Menara Gading, UCSI Heights, 56000 Kuala Lumpur, Malaysia. Tel: 60-16-688-6248. E-mail: kwekcl@ucsi.edu.my Received: June 28, 2012 Accepted: July 23, 2012 Online Published: October 18, 2012 doi:10.5539/ass.v8n13p40 URL: http://dx.doi.org/10.5539/ass.v8n13p40 Abstract With the development of Internet, online shopping is developing rapidly in China as a new way for shopping. Therefore, it is important for this research paper to identify the determinants of consumer satisfaction towards online shopping in China. A total of 350 online shoppers in China had participated in this research. The findings revealed that website design, security, information quality, payment method, e-service quality, product quality, product variety and delivery service are positively related to consumer satisfaction towards online shopping in China. Keywords: consumer satisfaction, website design, security, information quality, payment method, e-service quality, product quality, product variety, delivery service 1. Introduction Modern science and technology have made people’s life easier and more convenient. As one of the outcomes of modern science and technology, the Internet has been deeply into every aspect of people’s daily life. According to China Internet Network Information Center (CNNIC), there were 420,000,000 Internet users in China, which is 31.6% of the total population (CNNIC, cited in Internet World Stats, 2010). “Up to June, 2010, the number of net citizen in China has reached 420 million, exceeding the point of 400 million, with an increase of 36 million compared to the end of 2009. The popularity rate of internet has climbed up to 31.8%, with an increase of 2.9% compared to the end of 2009.” (CNNIC, 2011). The rapid growth of online customers indicates that it is importance to pay more attention to the issue of consumer satisfaction as a key factor to run online business (PRC Ministry of Information Technology, 2011). Only when consumers are satisfied with the products or services of a business, can the business maintain loyal consumers and attract more potential consumers. Consumer satisfaction is the ultimate result of meeting a consumer’s expectation from the performance of products. Most satisfied customers normally have the intention to re-purchase the products if product performance meets their expectation (Syed & Norjaya, 2010). Consumer satisfaction can be influenced by many factors. Numerous researches have been conducted to identify the determinants of online consumer satisfaction (Jun, Yang and Kim, 2004; Ballantine, 2005; Cappelli, Guglielmetti, Mattia, Merli and Renzi, 2011). In order to improve business performance and increase the level of consumer satisfaction, online retailers should have a clear and deep understanding of the antecedents of consumer satisfaction in the online environment. In this perspective, this research aims to identify factors that influence consumer satisfaction towards online shopping in the context of China. 2. Literature Review 2.1 Consumer Satisfaction Li and Zhang (2002) defined consumer satisfaction as the extent to which consumes’ perceptions of the online shopping experience confirm their expectations. The European Public Administration Network (EUPAN) explained consumer satisfaction with a model using the disconfirmation theory, in which suggests that consumer satisfaction with a service is related to the size of the disconfirmation experience; where disconfirmation is related to the person’s initial expectations. If experience of the service greatly exceeds the expectation clients 40
- 2. www.ccsenet.org/ass Asian Social Science Vol. 8, No. 13; 2012 had of the service, then satisfaction will be high. Consumers must be satisfied with their e-commerce shopping experience before acquiring more goods and services online. A great deal of studies has been done to identify the antecedents of consumer satisfaction towards online shopping (Jun, Yang and Kim, 2004; Ballantine, 2005; Cappelli, Guglielmetti, Mattia, Merli and Renzi, 2011). It is found that consumers’ attitudes and beliefs regarding convenience and security concerns have significant effects on their intention to purchase online (Limayen et al., 2000). Shanker et al. (2003) had also contended that service provided during and following the purchase is essential to e-consumers’ repeat purchases. In addition, Christian and France (2005) had identified three categories of determinants that could affect consumer satisfaction towards online shopping. They are technology factors, including security, usability and site design, and privacy; shopping factors, including convenience, trust and trustworthiness, and delivery; and product factors, including merchandising, product value and product customization. Through this study, the researchers had identified the determinants of consumer satisfaction towards online shopping in China, including website design, security, information quality, payment method, e-service quality, product quality, product variety, and delivery service. 2.2 Website Design Effective website design includes navigation capability or visual appeal of the website (Cyr, 2008). Customer satisfaction in e-commerce is related to the quality of website design (Cho and Park, 2001). Lee and Lin (2005) had empirically found that website design positively influences overall customer satisfaction and perceived service quality. Cyr (2008) examined characteristics of culture and design, which are information design, navigation design and visual design, as antecedents to website trust, website satisfaction and e-loyalty in a sample of three countries which are Canada, Germany and China. The findings indicate that navigation design, visual design and information design have positive influence on consumer satisfaction. 2.3 Security Another important factor affecting online shopping satisfaction is security. Christy and Matthew (2005) illustrated security as the website’s ability in protecting consumer personal information collected from its electronic transactions from the unauthorized use of disclosure. Consumers concern about the security, liability and privacy of the online website (Gefen, 2000). Basically, security concerns in electronic commerce can be divided into concerns about user authentication and concerns about data and transaction security (Ratnasingham, 1998; Rowley, 1996). According to the prior research (Elliot & Fowell, 2000; Szymanski & Hise, 2000), as perception of security risk decreases, satisfaction with the information service of online stores is expected to increase. In other words, strong security attribute does increase the degree of customer satisfaction. In the study conducted by Christian and France (2005), they identified three categories of factors as keys to influence e-satisfaction in which including technology, shopping, and individual product factors. Security was identified under technological factors. The study from Christian and France (2005) reconfirmed the positive relationship between security and e-satisfaction. 2.4 Information Quality Accuracy of information is concerned with the reliability of website content. Kateranttanakul (2002) argued that the reliability of website content facilitates consumers to perceive lower risks, better justifications for their decisions and ease in reaching the optimal decisions, and in turn affects customer satisfaction and intention to purchase online. This argument is consistent with the media richness theory that emphasized the importance of the quality, accuracy, and reliability of the information exchanged across a medium (Daft & Lengel, 1986). Christy & Matthew (2005) asserted that information quality has significant effect on consumer satisfaction in internet shopping, and accuracy, content, format and timeliness are the four dimensions of information quality. Besides, Liu et al. (2008) found that higher level of information quality will improve customer satisfaction in online shopping and they evaluated information quality from other four dimensions: information accuracy, information comprehensibility, information completeness, and information relevance. Findings from the Liu et al. (2008) research indicated that information quality has significant impact on customer satisfaction. 2.5 Payment Method Online shopping retailers usually offer several ways of payment, such as online payment concerning credit card usage; payment with cash; and telegraphic remittance. Most consumers choose a payment method not only base on convenience, but also what’s more important is security. Online shoppers expect websites to protect personal data, provide for secure payment, and maintain the privacy of online communication (Franzak et al., 2001). Grace and Chia-Chi (2009) argued that customers will base on certain criteria to evaluate the usefulness and ease 41
- 3. www.ccsenet.org/ass Asian Social Science Vol. 8, No. 13; 2012 of use for a particular website, including information search, internet subscription and payment methods. In addition, Grace and Chia-Chi (2009) also found that when a customer spends a long time to understand and familiarize himself or herself with shopping and payment procedures at a certain shopping website, the specific holdup cost paid on related intangible things will increase. Therefore, making the payment procedure easy is of importance for online retailers to maintain customers and increase consumer satisfaction level (Grace & Chia-Chi, 2009). 2.6 E-service Quality Parasuraman et al. (2005) refer e-service to “the extent to which a website facilitates efficient and effective shopping, purchasing, and delivery of products and services.” Santos (2003) defined e-service quality as “overall customer assessment and judgments in relation to the excellence and the quality of e-service delivery in the virtual marketplace.” E-service quality is becoming an important criterion to measure e-retail websites and an important element to business achievement. Cox and Dale (2001) suggested that without a quality management approach that guarantees quality from its systems, staff and suppliers, a business will not be able to deliver the appropriate level of service quality to satisfy its customers. Service quality on the Internet is especially important for the interface between customer and the Internet, namely the Website. Kuang-Wen Wu (2011) conducted a study in related to examine and explore the relationships among electronic service quality, customer satisfaction, electronics recovery service quality, and customer loyalty for customer electronics e-tailers. Findings of the study indicated that electronic service quality had no direct effect on customer satisfaction, but had indirect positive effects on customer satisfaction for consumer electronic e-tailers. However, the finding from Jung-Hwan and Chungdo (2010) is contradicted with the argument from Kuang-Wen Wu (2011). Jung-Hwan and Chungdo (2010) conducted a research to compare the e-service quality perceptions of US and South Korean consumers in relation to overall e-service quality, e-satisfaction, and e-loyalty to understand geographic and cultural differences in the context of international expansion of e-business. Results of the research revealed that there is a significant positive effect of overall e-service quality on consumers’ e-satisfaction towards online shopping and the positive effects of overall e-service quality and e-satisfaction on e-loyalty (Jung-Hwan & Chungho, 2010). 2.7 Product Quality Quality is an intrinsic property of a product. Product quality is the expected standard of product or service excellence (Jarvenpaa & Todd, 1996). In the Sproles and Kendall’s Consumer Style Inventory (CSI) model, they highlighted the influence of high-quality product. Some consumers regard quality as their first consideration when shop online. Although online shopping cannot enable consumers to touch or feel directly the quality of the product, but comments on the website can indicate the quality of the product to some extent. The study conducted by Christian and France (2005) through a conjoint analysis of consumer preferences based on data collected from 188 young consumers reveals that the three most important attributes to consumers for online satisfaction are privacy (technology factor), merchandising (product factor), and convenience (shopping factor). Under product factor as indicated in the finding of Christian and France (2005), quality is an intrinsic property of a product and the expected standard of product or service excellence. Enhancing product quality will have a positive effect in improving consumer satisfaction (Christian & France, 2005). 2.8 Product Variety Offering a broad variety of products is often a key for web merchants to keep customers coming back. Given much more choices, there will be a higher chance to sell the product. Online retailers who have offered a wide variety of products and selections seem to be more successful (Christian & France, 2005). Consumers expect online retailers to offer a wide range of product variety because of the reach of the Internet and the potential to track down specialty goods and services (Jarvenpaa & Todd, 1996). Szymanski and Hise (2000) indicated that wider assortment of products may be attractive to customers and e-satisfaction would be more positive when online stores offer superior product assortments. In the study conducted by Liu et al. (2008), they argued that eight constructs (including information quality, website design, merchandise attributes, transaction capability, security/privacy, payment, delivery, and customer service) are strong predictors of customer satisfaction in the online shopping environment. Merchandise attribute was evaluated from two dimensions: product variety and product price. Variety of merchandise plays a significant role in whether consumers are satisfied or dissatisfied with their online shopping experiences. It is indicated that wider merchandise variety and low price will have positive effects on customer satisfaction in the online shopping environment (Liu et al., 2008). 42
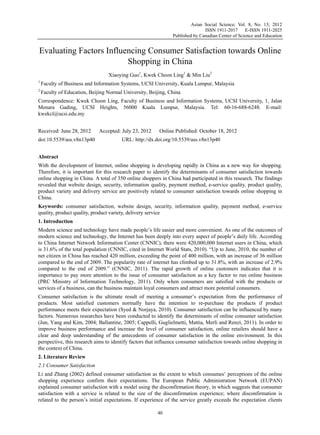
- 4. www.ccsenet.org/ass Asian Social Science Vol. 8, No. 13; 2012 2.9 Delivery Service Delivery is the amount of time necessary for the package to go from the distribution center to the customer’s door (Christian & France, 2005). Post-purchase evaluation can be influenced by the efficiency of logistics and customer service. Delivery problem is a very common phenomena existing in the online shopping environment. In the e-commerce environment, not only is the consumption of goods separated from production, thus making it necessary for goods to be delivered to consumers before consumption, there is also a delay in the delivery of goods. Delayed delivery has a negative effect on satisfaction (Liu et al., 2008). As shown by the 2004 China Online Shopping Report by CNNIC, 25 percent of Chinese customers were not satisfied due to delayed delivery or wrong product delivery (CNNIC, 2011). Syed and Norjaya (2010) had conducted a study to investigate the key factors that influencing customer satisfaction through online shopping. In this study, four key dimensions of customer satisfaction in the online shopping environment are identified. It is found that website design, reliability, product variety and delivery performances are the four key factors that influence customers’ satisfaction of online shopping (Syed & Norjaya, 2010). Findings from this research indicated that delivery performance has significant influence on customer satisfaction and it can explain much of the variation in online buying satisfaction. 2.10 Hypotheses From the discussion above, this has led to the development of the proposed conceptual framework as indicated in Figure 1 and following hypotheses are suggested. The eight hypotheses are as follows: H1: Website design has positive influence on consumer satisfaction towards online shopping in China H2: Security has positive influence on consumer satisfaction towards online shopping in China H3: Information quality has positive influence on consumer satisfaction towards online shopping in China H4: Payment method has positive influence on consumer satisfaction towards online shopping in China H5: E-service quality has positive influence on consumer satisfaction towards online shopping in China H6: Product quality has positive influence on consumer satisfaction towards online shopping in China H7: Product variety has positive influence on consumer satisfaction towards online shopping in China H8: Delivery service has positive influence on consumer satisfaction towards online shopping in China Figure 1. Proposed conceptual framework Source: Developed for this research 3. Research Methodology The research design methods being used in this research is quantitative research. Furthermore, descriptive research design was adopted as the study has clear problem statements, specific hypotheses and detailed body of knowledge (Malhotra, 2007). 43
- 5. www.ccsenet.org/ass Asian Social Science Vol. 8, No. 13; 2012 There are three parts in the design of the questionnaire. The first part of the questionnaire allows the researcher to identify whether the respondent is eligible to take part in this research (screening questions); the second part of the questionnaire elaborated the independent variables and dependent variable that would be tested in the survey; and the third part of the questionnaire identified respondent’s demographic information. In measuring the constructs, five-point Likert scale anchored by: 1 = strongly agree, 2 = agree, 3 = neither agree nor disagree, 4 = disagree and 5 = strongly disagree was used in the questionnaire with adoption from different sources of the existing literature. Questions that used to measure various constructs were adapted from Liu et al. (2008) and CAPTEC, an industrial computer system provider. Since the sample location will be in Beijing (China), the questionnaire was designed in both Chinese and English languages. The target population for this research would encompass those tertiary students who have prior online purchasing experience. Questionnaires were sent out to those tertiary students in Beijing (China) and self administered survey method was adopted. Purposive sampling technique was adopted in the sampling process to identify the respondents who had experience in the online shopping transaction and the targeted sample size was 380. Data from the returned questionnaires was analysed by using SPSS software version 17. Different statistical analyses were carried out, such as descriptive analysis, scale measurement (reliability and validity) and inferential analysis (Pearson correlation coefficient analysis and multiple regression analysis) 4. Research Results 4.1 Demographic Profile Based on the survey, male respondents represented 40.5 percent of the total respondents while female respondents represented 59.5 percent. In the case of age distribution, the majority of the respondents were between the ages of 18 to 25 (71.1 percent). Most respondents have undergraduate degree qualification. In terms of time spend on the Internet weekly, the majority of respondents (37.9 percent) spend more than 20 hours on the Internet every week. Additionally, most respondents (63.9 percent) have been using the Internet for more than 5 years. When asking about online shopping habit, majority of the respondents (64.2 percent) are very familiar with online shopping, approximately half of the respondents (50.8 percent) visit online shopping website frequently; all respondents have online shopping experience which are in accordance with the target population of this research; and among the most popular online shopping websites, TaoBao online shopping website attracted the majority of respondents (80.5 percent). 4.2 Reliability Test The reliability of a measure indicates the stability and consistency with which the instrument measures the concept and helps to assess the ‘goodness’ of a measure (Cavana et al., 2001). Cronbach’s alpha was used in the reliability test for all the nine constructs. The value of Cronbach’s alpha coefficient 0.6 was used as a guideline in this research to ensure the stability and consistency of the adopted instruments (Hair et al., 2006). The result of reliability test from this research indicated that the Cronbach’s alpha coefficients for all the nine constructs are above 0.60. Cronbach’s alpha coefficient for all the nine constructs ranged from the lowest of 0.745 (product quality) to the highest of 0.832 (security). 4.3 Validity Test Based on the output shown in Table 1, factor analysis was appropriate because the value of KMO is 0.876 (between 0.5 and 1.0) and the result of Bartlett’s Test of Sphericity showed that the value of Approx. Chi-Square is 6240.148 that is large enough and the value of Sig is 0.000 (which is less than 0.05) in which indicated that the data are suitable for data analysis (Xue, 2006). Table 1. Nine factors identified by the principal components factor analysis Variable Item 44 Factor loading Eigen-value Cronbach’s Alpha WD I like the layout of the website The start page leads me easily to the information I need The start page tells me immediately where I can find the information I am looking for I found it easy to move around in this website This website uses good colour combinations I like the colour combination of this website I feel happy when I use the website The website is easy to use This website is user friendly .607 .680 .773 .805 .804 .721 .662 .538 .513 9.500 0.785
- 6. www.ccsenet.org/ass Asian Social Science Vol. 8, No. 13; 2012 45 S I feel secure giving out credit card information at this website The website has adequate security features I feel I can trust this website I feel safe in my transactions with this website .688 .885 .802 .756 3.223 0.832 IQ I believe the website provides accurate information to potential customers like me The information provided at the website is reliable The information provided at the website is easily understandable The information on the website is complete for purchase decisions I can find all the detailed information of the goods I need The information in the website is relevant .550 .524 .669 .646 .558 .656 2.363 0.781 PM This website has complete payment options such as post office remittance, online payment, and cash on delivery, etc I accept the payment options provided by the website .804 .810 1.255 0.750 EQ Customer service personnel are always willing to help me Inquiries are answered promptly The company is ready and willing to respond to customer needs .748 .778 .674 1.584 0.815 PQ The products of the website meet my needs and expectations regarding quality I am satisfied with the product quality provided by the website .797 .768 1.101 0.745 PV The product range of this website is complete The products of other similar websites can be found at this website Most of the goods I need can be found at this website There are more choices for goods of a particular type at this website .650 .724 .757 .654 1.320 0.746 DS The product is delivered by the time promised by the company You get what you ordered from this website The items sent by the website are well packaged and perfectly sound I am satisfied with the delivery mode of the website (post, express delivery, home delivery) .607 .613 .777 .707 1.924 0.775 CS If I had to do it over again, I’d make my most recent online purchase at this website My choice to purchase from this website was a wise one I have truly enjoyed purchasing from this website I am satisfied with my most recent decision to purchase from this website .660 .713 .664 .640 1.426 0.761 Note: WD = Website Design, S = Security, IQ = Information Quality, PM = Payment Method, EQ = E-service Quality, PQ = Product Quality, PV = Product Variety, DS = Delivery Service, CS = Consumer Satisfaction KMO = 0.876 df = 703 p = 0.000 (p<0.05) Source: Developed for this research In addition, based on the result of rotated component matrix using Varimax with Kaiser Normalization, it can be seen that all the questions are divided into nine components, and each component stands for the variables identified in this research. Thus, discriminant validity of this research was concluded (Hair et al., 2006). The factor loading of all items are above 0.5, which verified the convergent validity of the data and means that there is positive correlation among all the items of each component. 4.4 Pearson Correlation Coefficient Analysis The result of Pearson correlation coefficient analysis was represented in Table 2. From the result shown, it can be seen that most variables show significance correlations. The highest r value of the Pearson correlation is 0.509, which represents the significance correlation between independent variable “delivery service” and dependent variable “consumer satisfaction”. The lowest r value is 0.125, which represents the low correlation between
- 7. www.ccsenet.org/ass Asian Social Science Vol. 8, No. 13; 2012 independent variables “payment method” and “security”. All the associations represent positive signs which indicate the positive direction of the associations among all the constructs tested. Table 2. Pearson correlation coefficient WD S IQ PM EQ PQ PV DS CS 46 WD Pearson Correlation Sig. (2-tailed) N 1 380 .283** .000 380 .429** .000 380 .250** .000 380 .243** .000 380 .191** .000 380 .279** .000 380 .293** .000 380 .373** .000 380 S Pearson Correlation Sig. (2-tailed) N .283** .000 380 1 380 .371** .000 380 .125* .015 380 .370** .000 380 .287** .000 380 .219** .000 380 .327** .000 380 .385** .000 380 IQ Pearson Correlation Sig. (2-tailed) N .429** .000 380 .371** .000 380 1 380 .234** .000 380 .421** .000 380 .417** .000 380 .307** .000 380 .464** .000 380 .454** .000 380 PM Pearson Correlation Sig. (2-tailed) N .250** .000 380 .125* .015 380 .234** .000 380 1 380 .131* .011 380 .168** .001 380 .350** .000 380 .317** .000 380 .301** .000 380 EQ Pearson Correlation Sig. (2-tailed) N .243** .000 380 .370** .000 380 .421** .000 380 .131* .011 380 1 380 .414** .000 380 .206** .000 380 .479** .000 380 .411** .000 380 PQ Pearson Correlation Sig. (2-tailed) N .191** 000 380 .287** .000 380 .417** .000 380 .168** .001 380 .414** .000 380 1 380 .166** .001 380 .349** .000 380 .357** .000 380 PV Pearson Correlation Sig. (2-tailed) N .279** .000 380 .219** .000 380 .307** .000 380 .350** .000 380 .206** .000 380 .166** .001 380 1 380 .361** .000 380 .343** .000 380 DS Pearson Correlation Sig. (2-tailed) N .293** .000 380 .327** .000 380 .464** .000 380 .317** .000 380 .479** .000 380 .349** .000 380 .361** .000 380 1 380 .509** .000 380 CS Pearson Correlation Sig. (2-tailed) N .373** .000 380 .385** .000 380 .454** .000 380 .301** .000 380 .411** .000 380 .357** .000 380 .343** .000 380 .509** .000 380 1 380 Note: ** Correlation is significant at the 0.01 level (2-tailed) * Correlation is significant at the 0.05 level (2-tailed) WD = Website Design, S = Security, IQ = Information Quality, PM = Payment Method, EQ = E-service Quality, PQ = Product Quality, PV = Product Variety, DS = Delivery Service, CS = Consumer Satisfaction Source: Developed for this research 4.5 Multiple Regression Analysis The result of multiple regression analysis was shown in Table 3(a) and Table 3(b). The value of Tolerance ranges from 0.598 to 0.816, which were all larger than 0.10, and the VIF value ranges from 1.226 to 1.671, which are all less than 5 (Hair et al., 2006). Therefore, it can be indicated that the problem of multicollinearity does not exist among the eight independent variables.
- 8. www.ccsenet.org/ass Asian Social Science Vol. 8, No. 13; 2012 47 Table 3(a). Regression analysis - ANOVAb Model Sum of Squares df Mean Square F Sig Regression 633.982 8 79.248 Residual 940.174 371 2.534 Total 1574.155 379 31.272 .000a a. Predictors: (Constant), delivery service, website design, payment method, product quality, security, product variety, e-service quality, information quality b. Dependent Variable: Consumer satisfaction Source: Developed for this research Table 3 (b). Regression analysis – coefficients Model Unstandardized Coefficients Standardized Coefficients t Sig. Collinearity Statistics B Std. Error Beta Tolerance VIF (Constant) website design security information quality payment method e-service quality product quality product variety delivery service 2.215 .068 .097 .071 .152 .101 .148 .088 .188 .914 .024 .033 .034 .074 .048 .074 .044 .041 .128 .136 .109 .091 .103 .094 .091 .233 2.425 2.795 2.983 2.097 2.058 2.080 2.008 1.998 4.549 .016 .005 .003 .037 .040 .038 .045 .046 .000 .764 .776 .598 .816 .653 .742 .776 .614 1.309 1.289 1.671 1.226 1.531 1.349 1.288 1.628 a. Dependent Variable: consumer satisfaction R = 0.635a R Square = 0.403 Adjusted R Square = 0.390 F = 31.272 P = 0.000a Source: Developed for this research The p values of all the eight independent variables are less than the alpha value of 0.05. Therefore, the research concludes that all the eight independent variables are positively related to consumer satisfaction. All the hypotheses proposed previously are supported. Besides, based on the Unstandardized Coefficients, the following multiple regression equation was formed: Consumer satisfaction = 2.215 + 0.068 (website design) + 0.097 (security) + 0.071 (information quality) + 0.152 (payment method) + 0.101 (e-service quality) + 0.148 (product quality) + 0.088 (product variety) + 0.188 (delivery service) In addition, the data of Standardized Coefficients explains the intensity among variables. Variables are ranked as following based on intensity: delivery service (0.233), security (0.136), website design (0.128), information quality (0.109), e-service quality (0.103), product quality (0.094), payment method (0.091) and product variety (0.091). It can be concluded that delivery service is the most relatively powerful independent variable in influencing consumer satisfaction towards online shopping in China. Based on Table 3 (b), the study concluded that the change of consumer satisfaction can be explained 40.3 percent (r2 = 0.403) by website design, security, information quality, payment method, e-service quality, product quality, product variety, and delivery service. 5. Conclusion 5.1 Implications of Research Findings This research conducted a conclusive study of eight determinants which have been studied by previous researchers and reconfirmed that website design, security, information quality, payment method, e-service quality, product quality, product variety, and delivery service have positive influence on consumer satisfaction from the aspect of online shopping environment in China. Result of this research enriched the theoretical body of
- 9. www.ccsenet.org/ass Asian Social Science Vol. 8, No. 13; 2012 knowledge that related to the online business environment in China. In addition, the research findings do provide insights and feedback for online retailers in drafting managerial strategies on how to improve their performance in order to increase the level of consumer satisfaction and standout in the highly competitive business environment in China. Online retailers need to thoroughly consider all these eight determinants of customer satisfaction for their business planning in the online business environment. In addition, it is important for online retailers to incorporate these determinants into the process of evaluating the level of consumer satisfaction as part of the corporation performance measurement. 5.2 Limitations of the Research Even though the research findings provide some new insights to researchers, these findings should be viewed in light of some limitations. This research adopted a cross-sectional design which measures units from a sample of the population at only one point in time (Burns & Bush, 2003). Due to the limitation of cross-sectional study, the research is not able to describe satisfactorily in portraying the observed changes in pattern and the causality of consumer satisfaction towards online shopping and it is also not sufficient to predict a long-term trend in the online shopping environment. In addition, most of the respondents’ age from 18 years old to 25 years old and most of them are tertiary students in Beijing who have limited purchasing power, the research findings are not typically enough to represent the views of all the online shoppers in China. 5.3 Recommendations for the Further Research Due to the limitations of this research, a few recommendations are suggested for further research with the purpose of enhancing the study of consumer satisfaction in the online business environment. Cross-sectional study may not be able to portray the observed changes in patterns and the causality of consumer satisfaction. In due respect, longitudinal studies that repeatedly measure the same sample units of a population over a period of time is proposed to be adopted in the future study (Burns & Bush, 2003). Due to the restriction of generalization, it is recommended to broaden the research setting by incorporating more respondents at different age groups with various occupations from different cities of China. With these measurements taken in place for the future research, it will be able to enhance the validity and generalization of the research findings. References Anderson, R. E., & Srinivasan, S. S. (2003). E-satisfaction and E-loyalty: a contingency framework. Psychology and Marketing, 20(2), 123-138. http://dx.doi.org/10.1002/mar.10063 Ballantine, P. W. (2005). Effects of interactivity and product information on consumer satisfaction in an online retail setting. International Journal of Retail & Distribution Management, 35(6), 461-471. http://dx.doi.org/10.1108/09590550510600870 Burns, A. C., & Bush, R. F. (2003). Marketing research: online research applications (4th ed.). New Jersey, 48 USA: Pearson Education, Inc. Cappelli, L., Guglielmetti, R., Mattia, G., Merli, R., & Renzi, M. F. (2011). Testing a customer satisfaction model for online services. International Journal of Quality and Service Sciences, 3(1), 69-92. http://dx.doi.org/10.1108/17566691111115090 Cavana, R. Y., Delahaye, B. L., & Sekaran, U. (2001). Applied business research. Australia: John Wiley & Sons, Limited. Cho, N., & Park, S. (2001). Development of electronic commerce user – consumer satisfaction index (ECUSI) for internet shopping. Industrial Management and Data Systems, 101(8), 400–405. http://dx.doi.org/10.1108/EUM0000000006170 Cheung, C. M. K., & Lee, M. K. O. (2005). Consumer satisfaction with internet shopping: a research framework and propositions for future research. Proceeding, ICCE ’05 Proceedings of the 7th international conference on Electronic commerce. Cox, J., & Dale, B. G. (2001). Service quality and E-Commerce: an exploratory analysis. Management Service Quality, 11(2), 121-131. MCB University Press. http://dx.doi.org/10.1108/09604520110387257 Daft, R. L., & Lengel, R. H. (1986, May). Organizational information requirements, media richness and structural design. Management Science, 32(5), 554-571. http://dx.doi.org/10.1287/mnsc.32.5.554 Devaraj, S., Fan, M., & Kohli, R. (2002). Antecedents of B2C channel satisfaction and preference: validating E-commerce metrics. Information Systems Research, 13(3), 316-333. http://dx.doi.org/10.1287/isre.13.3.316.77
- 10. www.ccsenet.org/ass Asian Social Science Vol. 8, No. 13; 2012 Cyr, D. (2008). Modeling website design across culture: relationships to trust, satisfaction and E-loyalty. Journal of Management Information Systems, 24(4), 47-72. http://dx.doi.org/10.2753/MIS0742-1222240402 Elliot, S., & Fowell, S. (2000). Expectations versus reality: a snapshot of consumer experiences with Internet retailing. International Journal of Information Management, 20(5), 323-336. http://dx.doi.org/10.1016/S0268-4012(00)00026-8 Flavian, C., Guinaliu, M., & Gurrea, R. (2006). The Role Played by Perceived Usability, Satisfaction and Consumer Trust on Website Loyalty. Information & Management, 43(1), 1-14. http://dx.doi.org/10.1016/j.im.2005.01.002 Franzak, F., Pitta, D., & Fritsche, S. (2001). Online relationships and the consumer’s right to privacy. Journal of Consumer Marketing, 18, 631-641. http://dx.doi.org/10.1108/EUM0000000006256 Gefen, D. (2000). E-Commerce: the role of familiarity and trust. The International Journal of Management and 49 Science, 28, 725-737. Grace Lin, T. R., & Chia, C. S. (2009). Factors influencing satisfaction and loyalty in online shopping: an integrated model. Online Information Review, 33(3), 458-475. http://dx.doi.org/10.1108/14684520910969907 Hair, J. F., Bush, R. P., & Ortinau, D. J. (2006). Marketing research: within a changing information environment (3rd ed.). New York, USA: McGraw-Hill/Irwin. Internet Word Stats. (2011). Internet Usage and Population Growth. Retrieved November 14, 2011, from http://www.internetworldstats.com/am/us.htm Jarvenpaa, S., & Todd, P. (1996). Consumer reactions to electronic shopping on the world wide web. International Journal of Electronic Commerce, 1(2), 59-88. Jun, M., Yang, Z., & Kim, D. (2004). Customers’ perceptions of online retailing service quality and their satisfaction. International Journal of Quality & Reliability Management, 21(8), 817-840. http://dx.doi.org/10.1108/02656710410551728 Katerattanakul, P. (2002). Framework of effective website design for business-to-consumer Internet commerce. business library. Retrieved November 15, 2011, from http://findarticles.com/p/articles/mi_qa3661/is_200202/ai_n9069842/?tag=content;col1 Kim, J. H., & Kim, C. (2010). E-service quality perceptions: a cross-cultural comparison of American and Korean consumers. Journal of Research in Interactive Marketing, 4(3), 257-275. http://dx.doi.org/10.1108/17505931011070604 Lee, G. G., & Lin, H. F. (2005). Customer Perceptions of E-service quality in online shopping. Journal of Retail and Distribution Management, 33(2), 161-176. http://dx.doi.org/10.1108/09590550510581485 Li, N., & Zhang, P. (2002). Consumer Online Shopping Attitudes and Behavior: An Assessment of Research. Eighth Americas Conference on Information Systems. Limayem, M., Khalifa, M., & Frini, A. (2000). What make consumers buy from the Internet? A longitudinal study of online shopping. IEEE Transactions on Systems, Man, and Cybernetics: Part A, 30(4), 421-432. http://dx.doi.org/10.1109/3468.852436 Liu, X., He, M.Q., Gao, F., & Xie, P. H. (2008). An empirical study of online shopping customer satisfaction in China: a holistic perspective. International Journal of Retail & Distribution Management, 36(11), 919-940. http://dx.doi.org/10.1108/09590550810911683 Malhotra, N. K. (2007). Marketing research: an applied orientation (5th ed.). New Jersey: Pearson Prentice Hall. Martinez Lopez, F. J., Luna, P., & Martinez, F. J. (2005). Online shopping, the standard learning hierarchy, and consumer’s internet experience. Internet Research, 15(3), 312-334. http://dx.doi.org/10.1108/10662240510602717 Parasuraman, A., Zeithaml, V. A., & Malhotra, A. (2005). E-S-Qual: a multiple-item scale for assessing electronic service quality. Journal of Service Research, 7(3), 213-233. http://dx.doi.org/10.1177/1094670504271156 Ratnasingham, P. (1998). The importance of trust in electronic commerce. Internet Research, 8(4), 313-321. http://dx.doi.org/10.1108/10662249810231050
- 11. www.ccsenet.org/ass Asian Social Science Vol. 8, No. 13; 2012 Rowley, J. (1996). Retailing and shopping on the Internet. International Journal of Retail & Distribution Management, 24(3), 81-91. http://dx.doi.org/10.1108/09590559610113411 Santos, J. (2003). E-service quality: a model of virtual service quality dimensions. Managing Service Quality, 13(3), 233-246. http://dx.doi.org/10.1108/09604520310476490 Schaupp, L. C., & Belanger, F. (2005). A conjoint analysis of online consumer satisfaction. Journal of 50 Electronic Commerce Research, 6(2), 95-111. Shanker, V., Smith, A., & Rangaswamy, A. (2003). Consumer satisfaction and loyalty in online and offline environments. International Journal of Research in Marketing, 20(2), 153-175. http://dx.doi.org/10.1016/S0167-8116(03)00016-8 China Internet Network Information Center (CNNIC). (2011). Statistical report on internet development in China. Retrieved November 9, 2011, from http://www.cnnic.cn Alam, S. S., & Yasin, N. M. (2010). An investigation into the antecedents of customer satisfaction of online shopping. Journal of Marketing Development and Competitiveness, 4(1), 71-78. Szymanski, D. M., & Hise, R. T. (2000). E-Satisfaction: an initial examination. Journal of Retailing, 76(3), 309-322. http://dx.doi.org/10.1016/S0022-4359(00)00035-X Wu, K. W. (2011). Customer loyalty explained by electronic recovery service quality: implications of the customer relationship re-establishment for consumer electronics E-Tailers. Contemporary Management Research, 7(1), 21-44. Xue, W. (2006). SPSS Statistic Analysis. Bejing: China Renmin University Press.
- 12. Reproduced with permission of the copyright owner. Further reproduction prohibited without permission.