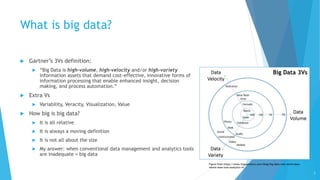
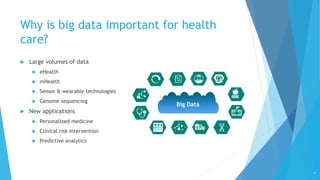
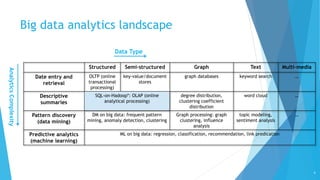
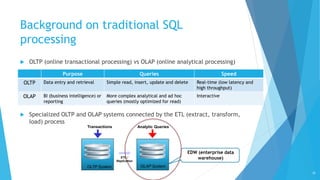
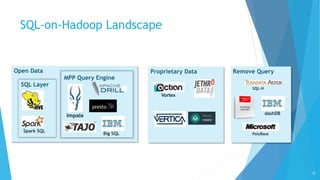
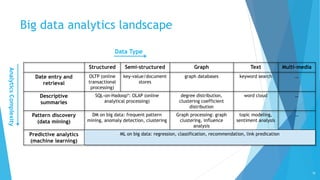
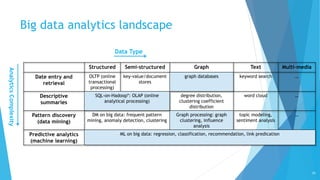
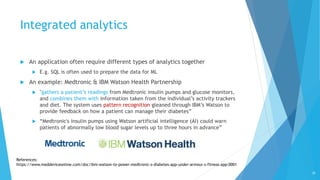
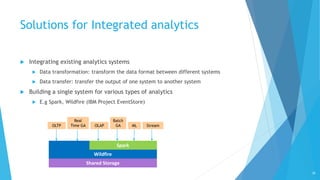
Successfully reported this slideshow.
Your SlideShare is downloading. ×

Big Data Analytics: From SQL to Machine Learning and Graph Analysis

Ad
Ad
Ad
Ad
Ad
Ad
Ad
Ad
Ad
Ad
Ad

Check these out next

1 of 28 Ad

More Related Content

Slideshows for you (20)

Similar to Big Data Analytics: From SQL to Machine Learning and Graph Analysis (20)

Advertisement

Recently uploaded (20)

Big Data Analytics: From SQL to Machine Learning and Graph Analysis

  1. 1. © 2017 IBM Corporation Big Data Analytics: From SQL to Machine Learning and Graph Analysis Yuanyuan Tian IBM Research -- Almaden Keynote for KDD bigdas 2017
  2. 2. A bit about me  I am a computer scientist who builds data management and analytics systems  My talk is from the perspective of a big data analytics system builder  I have some exposure to healthcare domain data and analytics problems by collaborating with experts in IBM Watson Health division 2
  3. 3. What is big data?  Gartner’s 3Vs definition:  “Big Data is high-volume, high-velocity and/or high-variety information assets that demand cost-effective, innovative forms of information processing that enable enhanced insight, decision making, and process automation.”  Extra Vs  Variability, Veracity, Visualization, Value  How big is big data?  It is all relative  It is always a moving definition  It is not all about the size  My answer: when conventional data management and analytics tools are inadequate = big data 3 Figure from https://www.linguamatics.com/blog/big-data-real-world-data- where-does-text-analytics-fit Big Data 3Vs
  4. 4. Why is big data important for health care?  Large volumes of data  eHealth  mHealth  Sensor & wearable technologies  Genome sequencing  New applications  Personalized medicine  Clinical risk intervention  Predictive analytics 4 Big Data
  5. 5. Big data analytics  Big data analytics comes in different forms! 5
  6. 6. Two dimensions of big data analytics  Data type  Structured data  Records in relational database tables  Semi-structured data  Json and XML  Unstructured data  Text data  Graph data  Social and interaction data  Multi-media data  Images and videos  Complexity of analytics  Data entry and retrieval  Look for a patient’s EHR at check in  Descriptive summaries  Compute the number of outbreaks across different geo regions  Pattern discovery (data mining)  Identify unusual patterns of medical claims by clinics, physicians, labs, etc  Predictive analytics (machine learning)  Predict a patient’s readmission to the hospital 6
  7. 7. Big data analytics landscape 7 Structured Semi-structured Graph Text Multi-media Date entry and retrieval OLTP (online transactional processing) key-value/document stores graph databases keyword search … Descriptive summaries SQL-on-Hadoop*: OLAP (online analytical processing) degree distribution, clustering coefficient distribution word cloud … Pattern discovery (data mining) DM on big data: frequent pattern mining, anomaly detection, clustering Graph processing: graph clustering, influence analysis topic modeling, sentiment analysis … Predictive analytics (machine learning) ML on big data: regression, classification, recommendation, link predication Data Type AnalyticsComplexity
  8. 8. Big data analytics landscape 8 Structured Semi-structured Graph Text Multi-media Date entry and retrieval OLTP (online transactional processing) key-value/document stores graph databases keyword search … Descriptive summaries SQL-on-Hadoop*: OLAP (online analytical processing) degree distribution, clustering coefficient distribution word cloud … Pattern discovery (data mining) DM on big data: frequent pattern mining, anomaly detection, clustering Graph processing: graph clustering, influence analysis topic modeling, sentiment analysis … Predictive analytics (machine learning) ML on big data: regression, classification, recommendation, link predication Data Type AnalyticsComplexity
  9. 9. Big data analytics landscape 9 Structured Semi-structured Graph Text Multi-media Date entry and retrieval OLTP (online transactional processing) key-value/document stores graph databases keyword search … Descriptive summaries SQL-on-Hadoop*: OLAP (online analytical processing) degree distribution, clustering coefficient distribution word cloud … Pattern discovery (data mining) DM on big data: frequent pattern mining, anomaly detection, clustering Graph processing: graph clustering, influence analysis topic modeling, sentiment analysis … Predictive analytics (machine learning) ML on big data: regression, classification, recommendation, link predication Data Type AnalyticsComplexity
  10. 10. Background on traditional SQL processing  OLTP (online transactional processing) vs OLAP (online analytical processing)  Specialized OLTP and OLAP systems connected by the ETL (extract, transform, load) process 10 Purpose Queries Speed OLTP Data entry and retrieval Simple read, insert, update and delete Real-time (low latency and high throughput) OLAP BI (business intelligence) or reporting More complex analytical and ad hoc queries (mostly optimized for read) Interactive Transactions Analytic Queries ETL / Replication OLTP System OLAP System EDW (enterprise data warehouse)
  11. 11. Why SQL-on-Hadoop?  SQL (Structured Query Language) is the de facto language for transactional and decision support systems and BI tools  Healthcare analysts and hospital IT experts are very familiar with SQL  SQL-on-Hadoop eases the transition to big data  Little or no change to existing BI tools and applications  SQL-on-Hadoop overcomes some shortcomings of conventional EDWs  Scalability & fault tolerance  Better support for semi-structured data  Directly work on raw data (query in situ) by avoiding ETL 11
  12. 12. Open Data SQL Layer Remove Query SQL-on-Hadoop Landscape Impala Big SQL PolyBase Proprietary Data Vortex SQL-H Spark SQL MPP Query Engine 12 dashDB
  13. 13. Technical Challenge  How to distribute data and computation in a large cluster of machines for performance  Bottleneck: transferring large volumes of data across the network  Example: join (combining columns from multiple tables) 13 PID VisitDate Reason 1 2016-03-15 Fever 2 2016-10-20 Headache 1 2017-02-08 Fever 3 2017-06-18 Cold PID Name BOD Sex 1 Jim Green 1980-04-15 M 2 Alice Lee 1965-11-11 F 3 Rose Darcy 2001-07-21 F PID VisitDate Reason Name BOD Sex 1 2016-03-15 Fever Jim Green 1980-04-15 M 2 2016-10-20 Headache Alice Lee 1965-11-11 F 1 2017-02-08 Fever Jim Green 1980-04-15 M 3 2017-06-18 Cold Rose Darcy 2001-07-21 F Clinical Visits Patient Info
  14. 14. SQL-on-Hadoop Strategies (1/2)  Storing data in formats that are easy for query processing  Columnar data formats (Parquet, ORCFile)  Pushing analytics close to the data  Intelligent data readers (apply predicates and projections while read the data)  Carefully choosing the algorithm and what data to transfer for each analytics operation  E.g. how to choose from different join algorithms based on data characteristics 14 VS Broadcast smaller table network cost: 2|G| Repartition both tables network cost: 2/3|B|+2/3|G| Blue table (B) Green table (G)
  15. 15. SQL-on-Hadoop Strategies (2/2)  Pre-process data into better organization for queries  Hash or range-based data partitioning and bucketing  Auxiliary data structures for eliminating unnecessary data access  Indexing and synopsis  Better data placement for related data  E.g. collocating related data together on HDFS (Hadoop distributed file system) 15 Co-partition network cost: |G| 21 1 1 12 2 2 3 3 3 3 Co-partition and co-location network cost: 0 1 1 1 2 2 2 3 3 3 1 2 3
  16. 16. Big data analytics landscape 16 Structured Semi-structured Graph Text Multi-media Date entry and retrieval OLTP (online transactional processing) key-value/document stores graph databases keyword search … Descriptive summaries SQL-on-Hadoop*: OLAP (online analytical processing) degree distribution, clustering coefficient distribution word cloud … Pattern discovery (data mining) DM on big data: frequent pattern mining, anomaly detection, clustering Graph processing: graph clustering, influence analysis topic modeling, sentiment analysis … Predictive analytics (machine learning) ML on big data: regression, classification, recommendation, link predication Data Type AnalyticsComplexity
  17. 17. Machine learning on big data  SQL analytics tools are not enough to capture the full value of big data  Big data impact on ML (machine learning):  Opportunities:  More training data  better predications  We can train a model with billions of parameters, because we have sufficiently big data  Making deep learning possible!  Challenges:  Scalability and distributed computing  A big learning curve for data scientists 17
  18. 18. Machine Learning Deep Learning Big ML systems landscape 18
  19. 19. Different levels of abstractions for big ML systems  ML libraries  E.g. Spark MLlib, H2O, IBM Watson  Provide a list of parameterized ML algorithms  Declarative ML  E.g. SystemML, Mahout  Expose R or Matlab like language for users  Primitive: linear algebra and math operations  Cost-based optimizer to compile execution plans  Also provide a library of ML algorithms  AutoML  E.g. H2O  Automate the process of training a large selection of candidate models 19 Hadoop or Spark Cluster (scale-out) In-Memory Single Node (scale-up) Runtime Compiler Language SystemML
  20. 20. Big data analytics landscape 20 Structured Semi-structured Graph Text Multi-media Date entry and retrieval OLTP (online transactional processing) key-value/document stores graph databases keyword search … Descriptive summaries SQL-on-Hadoop*: OLAP (online analytical processing) degree distribution, clustering coefficient distribution word cloud … Pattern discovery (data mining) DM on big data: frequent pattern mining, anomaly detection, clustering Graph processing: graph clustering, influence analysis topic modeling, sentiment analysis … Predictive analytics (machine learning) ML on big data: regression, classification, recommendation, link predication Data Type AnalyticsComplexity
  21. 21. Graph analytics on big data  Graphs provide a powerful primitive for modeling real-world objects and the relationships between objects  Patient-patient/doctor-patient interactions, biological pathways, protein interaction networks, ontologies, knowledge graphs, etc  Two types:  Graph databases: focus on real-time graph analytics  Graph processing systems: focus on batch processing of graphs 21
  22. 22. Graph databases  Real-time graph analytics  Updates, simple node and edge retrieval  Pattern matching queries  Given a graph pattern, find subgraphs in the database graphs that (exactly or approximately) match the query  Example: find out what biological processes are affected by a disease  Querying a disease pathway against a database of known pathways 22 Graph Databases SAGA (query against a database of pathways)
  23. 23. Graph processing systems  Batch graph analytics  Long running (usually iterative) analysis on the entire graph  E.g. PageRank algorithm to identify key influencers of a disease propagation network  Performance bottleneck: network overhead  Better graph partitioning and absorbing messages within a partition  Combining messages (when messages can be aggregated) 23 Graph Processing Microsoft Graph Engine
  24. 24. Big data analytics landscape 24 Structured Semi-structured Graph Text Multi-media Date entry and retrieval OLTP (online transactional processing) key-value/document stores graph databases keyword search … Descriptive summaries SQL-on-Hadoop*: OLAP (online analytical processing) degree distribution, clustering coefficient distribution word cloud … Pattern discovery (data mining) DM on big data: frequent pattern mining, anomaly detection, clustering Graph processing: graph clustering, influence analysis topic modeling, sentiment analysis … Predictive analytics (machine learning) ML on big data: regression, classification, recommendation, link predication Data Type AnalyticsComplexity
  25. 25. Integrated analytics  An application often require different types of analytics together  E.g. SQL is often used to prepare the data for ML  An example: Medtronic & IBM Watson Health Partnership  "gathers a patient’s readings from Medtronic insulin pumps and glucose monitors, and combines them with information taken from the individual’s activity trackers and diet. The system uses pattern recognition gleaned through IBM’s Watson to provide feedback on how a patient can manage their diabetes”  “Medtronic's insulin pumps using Watson artificial intelligence (AI) could warn patients of abnormally low blood sugar levels up to three hours in advance” 25 References: https://www.meddeviceonline.com/doc/ibm-watson-to-power-medtronic-s-diabetes-app-under-armour-s-fitness-app-0001
  26. 26. Solutions for Integrated analytics  Integrating existing analytics systems  Data transformation: transform the data format between different systems  Data transfer: transfer the output of one system to another system  Building a single system for various types of analytics  E.g Spark, Wildfire (IBM Project EventStore) 26 Spark OLAPOLTP ML Stream Batch GA Shared Storage Wildfire Real Time GA
  27. 27. Conclusion  Big data analytics comes in different forms  What types of data do you have?  What level of complexity does the analytics require?  What is the latency requirement?  An application often require different types of analytics together  What types of analytics do you need to integrate?  What is your performance requirement?  Do you need to integrating existing analytics pipelines or can you start with a single systems that supports all analytics? 27
  28. 28. 28

Editor's Notes

  • I will try to provide a roadmap in this talk to help you navigate through the big data analytics landscape.

    I'm not a healthcare domain expert, however, I have some exposure to healthcare domain data and analytics problems and have been collaborating with experts Watson Health division to formulate the talk
  • The first question before we talk about big data analytics is what is big data? The most popular definiion is the 3V defitnion from Gartner.

    And over the years, others have extended the deinfition of big data with more vs.

    The next question people usually ask is how do you know you have big data? How big is big data?
    Well, it is all relative, and with the technology advancement in storage and data processing, it is always moving definiton. 10 years ago, people think 1 petabyte of data so huge, nowdays is becoming very common, now people start to talk about exabyte, and even zettabyte. And as we have seen the 3 v defintion, its not all about size. So, how big is big data? There is agreed upon answer. My answer to this question is that you know you are dealing with big data when the convention data management and analytics tools are not enough.


    Volume - The quantity of generated and stored data. The size of the data determines the value and potential insight- and whether it can actually be considered big data or not.

    Variety - The type and nature of the data. This helps people who analyze it to effectively use the resulting insight.

    Velocity - In this context, the speed at which the data is generated and processed to meet the demands and challenges that lie in the path of growth and development.

    Variability - nconsistency of the data set can hamper processes to handle and manage it.

    Veracity - The quality of captured data can vary greatly, affecting the accurate analysis.
  • Large volumes of data are being accumlated in the healthcare domain, due to ehealth, mobile health, the wide use of senor and wearable technologis, and the advancement of genome sequencing. In addition, a number of new healthcare applications emerge because of big data, such as
  • Big data analytics can mean different things to different people. For some people it is machine learning, others it may be SQL analytics. It is not suprising, because big data analytics comes in different forms. In this talk, I will categorize big data analytics.
  • I will categorize big data analytics along two dimensions.

    The other dimension is complexity of analytics, starting from simple to more complex. The simplest type of analytics does update and data retrieval, for example, retrieving a patients HER record when she checks in a hostpital. The next type is creating descriptive summaries, which groups data and computing statistics. The next level goes beyong computing simple statistics to discovering patterns using data mining techniques. For example, for fraud detection, identifying unusual patterns of medical claims by clincs, phisicans, labs,so on. The last level is predicative analytics using machine learning techniques. For example, predicint whether a patient will be readmitted to the hospital based on the history data.
  • Now here is the big data analytcs landscape along the two dimensions. The horizental dimension is data type, and the vertical dimension is the analytic complexity. I am not familary with image or video processing, so I am going to leave multi-media out.

    For structured data, data entry and retrievel is basically oLTP, and for semi-structured data, people use key-value/document store, such as cassandra or mogodb for data entry and retrieval. For graph data entry and retrievel, people use graph databases, like neo4j and janusgraph. For text data, people use search systems for keyword search.

    For both structured and unstructure data, people use SQL-on-Hadoop systems for descriptive sumaries. They basically do OLAP Notice the the start next Hadoop? Here Hadoop is abused to represent big data, many SQ-on-Hadoop systems are not really using hadoop underneath. For graphs, people basically compute …, and for text, word cloud is most widely used method to compute descriptive summaries. For structured and unstructured data, people use data minging on big data for ...., for graphs, people use graph processing systems for graph clustering, influence analysis etc. Examples of pattern discovery on text are topic modeling and sentiment analysis. For predictive analytics, big ML systems for used for all different types of data, but depending on the actual data types, you may need to do some data transformation to be able to use ML.
  • Over the years, I have worked on a number of types of big data analytics. I will cover these types in this talk.
  • Now here is the big data analytcs landscape along the two dimensions. The horizental dimension is data type, and the vertical dimension is the analytic complexity. I am not familary with image or video processing, so I am going to leave multi-media out.

    For structured data, data entry and retrievel is basically oLTP, and for semi-structured data, people use key-value/document store, such as cassandra or mogodb for data entry and retrieval. For graph data entry and retrievel, people use graph databases, like neo4j and janusgraph. For text data, people use search systems for keyword search.

    For both structured and unstructure data, people use SQL-on-Hadoop systems for descriptive sumaries. They basically do OLAP Notice the the start next Hadoop? Here Hadoop is abused to represent big data, many SQ-on-Hadoop systems are not really using hadoop underneath. For graphs, people basically compute …, and for text, word cloud is most widely used method to compute descriptive summaries. For structured and unstructured data, people use data minging on big data for ...., for graphs, people use graph processing systems for graph clustering, influence analysis etc. Examples of pattern discovery on text are topic modeling and sentiment analysis. For predictive analytics, big ML systems for used for all different types of data, but depending on the actual data types, you may need to do some data transformation to be able to use ML.
  • Before, I talk about SQL-on-Haoop, I will briefly provide some background info on tranditional SQL processing. In traditional SQL, there are two types: OLTP and OLAP. And the difference between them is listed in this table. Because OLTP and OLAP sytems have very different characteristics, the database field has evloved into having specialed OLTP systems and OLAP systems. And ETL process is used consolidcate and transform transactional data from OLTP sysytem to OLAP systems.

    Name any application in use at a hospital or in a physician’s office, and the chances are good that it runs on an OLTP database.

    EHRs, lab systems, financial systems, patient satisfaction systems, patient identification, billing and payment processing, ect.
  • SQL (Structured Query Language) is the de facto language for transactional and decision support systems and BI tools to access and query a variety of data sources

    Transitioning to big data requires a steep learning curve,
  • SQL-on-hadoop systems support data warehousing functionalities on big data, I,e. they focus olap queries. There are so many SQL-on-Hadoop systems today. The can be categrozed in several camps. The first camp support querying exsiting data in open format, there is no lock-in. The camp can be further categorized in sub-groups, with first group just builds a simple SQL layer on existing data platforms like HIVe builing on mapreduce, Spark SQL building on Spark, where as the second subgroup builds a MPP query engine from scrach, The second group typical have better performance. The second camp controles the storage layer and uses propriety formats. The last camp extends existing EDW to work with big data.

    Querying existing data with open format vs controlled storage layer with proprietary formats?
    A SQL layer on top of existing big data systems (like MapReduce or Spark) or a MPP query engine architected from ground up?
    Directly querying big data vs going through an existing database?
  • The major technical challenge for SQL-on-Hadoop systems is to distribute data and computation in…
    Quite often the major bottleneck is transferring large volumes of data across the network. Let’s use the database join operator to illustrate this challenge. Join is a database operator to combing columns from multiple tables togather. For example, one can join the clinical visits and patient info tables on the patient id. The join will bring in the records with same pid together. In the big data setting, the two tables are partitioned and distributed across the cluster, so the join processing needs to transfer data acros the network to actually performan the query.
  • Here are some strategies applied in many SQL-on-Hadoop systems to address the changelles.

    For example, in the past, I have worked on comparing different join algorithms for big data and provid guidelines on how to choose from differen join algorithms for a particular query based on data characteristics. For example, one join strategy for joining a big table with a small table is broacasting the smaller table to all machines in the cluster, then perform local joins on each machne. In this Figure, I have two tables, a blue table and a green table, they are all distributed across the machines in the cluster, in this particular case, the green table is the smaller table, so I will ship all the partitions of the green table to every node. The red arrow represnts the network communication. The algorithm in total sends 2 times of the size of the Green table across the network. Then there is another join strategy that is good for joining two large tables. This algorithm repartitions both tables, and send the corresponding partitions from both table to one of the machines for processing. This algorithm will end up sening in total this much table across the network. As you can see, depends on the size of the two tables, one algorithm may be perfered for particular join operation.
  • Data partitioning is to partition data based on some values, instead of randomly partition data. For when two tables are partitioned the same way on the join key, you only need to bring in the corresponding partitions together for join processing. This often will reduce the processing and network overhead.

    Finally, better data placement can often bring in siginifcant performane boost. For example, in one of my works, I extended the HDFS to support collocation of related data in an best-effort approach. And using this technique can signifcantly reduce the network overhead. In this sample, not only the two tables are co-partitioned, but the corresponding partitons are also collocated, so when join the two tables togeher, no network cost is incurred.
  • We have talked so much on SQL-on-Hadoop, let’s now move on to machine learning on big data.
  • Here is where Machine learning comes to help. Machine learning is not a new field. But Big data has brought in huge impact on machine learning. First of all, It revived the whole machine learning field, because more training data usually leads to better preidcations. And now we have enough data to train a model with billions of parameters. Big data essentially enabled deep learning. At the same time, big data also bring in a lot challenges to machine learning as well, such as scalabitiy and distributed computation. And more importantly, it emposes a big learning curve for data scientss, because they do not only need to worry about the particular ML algorithm, but how to distirbuted the data and computation in the big data plaftform.
  • To help reduce the learning curve many big ML systems emerged. They are usually categoried into two camps. One camp for general machine learning, the other camp specialled in deep learning. But the trend now is that two camps start to converge together, with general ML systems start to support deep learning, and the deep learning camp also start to support general ml algorithms. Personally, I haven’t worked much on deep learning, so I will focus on the general ML camp.
  • The big ml systems help data scientists by masking the details of implementing ml algorithms for big data. There are different levels of abstractions that big ML systems provide. One grpup of big machine learning systems provide the users with a library of machine learning lagorithms. The behavior of each algorithm can be controlled by the parameters. But that’s it. The algorithm are pretty much black boxes for the users. There is no way to change the internals of the algorithm. This problem is addressed by declaraive ml systems, like systemML and mahout. These systems usuallly expose an R-or matlab like language for data scientists, with linear algebra and math operations as the primative. The the system employs a cost-based optimizer to compile the algorithm into effcient execution plans on the target platform. Finally, recently, H2O has propopsed a new concept called AutoML. Usually, for a particular application, a data scientist usually tries a large number of candidate models and selects the best. AutoML basically automates this process.
  • Next, I will briefly talk about graph databases and grpah processing together.
  • Popular graph databases include Neo4j, janus graph, ibm graph etc. They focus on real-time graph analytics. Besides upates and simple node ane edge retrievel, most graph databases support graph pattern matching query. Basically, given a graph pattern, they find subgraphs in the database that match the query. Most graph database only support exact match. But sometimes, approximate match necessary when graph data is noisy. In one of my PhD work, I have built a system called SAGA for approxiate graph matchng, And it can support querying a disease parthy againse a data of known pathways to find out what biologial processed are affected by a disease.
  • The second type of graph analytics systems are graph processing systems. They focus on batch graph analytics. These are long running analysis on the entire grpah, They are often iterative.
    Also new trend in these types of sytems is to deal
  • Over the years, I have worked on a number of types of big data analytics. I will cover these types in this talk.
  • The first way solution is to integrating existing analytics systems together. The two challenges here is
  • The take away of messge of my talk is that big

×