2019 performance analysis iata
•
1 like•143 views

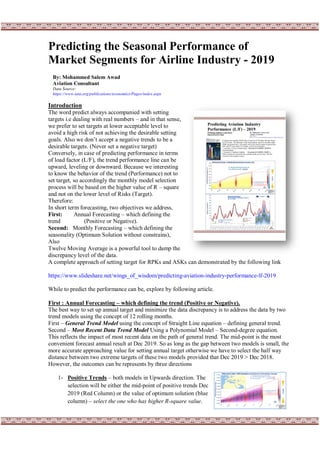
Predicting the Seasonal Performance of Market Segments for Airline Industry - 2019

Recommended
More Related Content
Similar to 2019 performance analysis iata
Similar to 2019 performance analysis iata (20)
More from Mohammed Awad
More from Mohammed Awad (20)
Recently uploaded
Recently uploaded (20)
2019 performance analysis iata
- 1. Predicting the Seasonal Performance of Market Segments for Airline Industry - 2019 Introduction The word predict always accompanied with setting targets i.e dealing with real numbers – and in that sense, we prefer to set targets at lower acceptable level to avoid a high risk of not achieving the desirable setting goals. Also we don’t accept a negative trends to be a desirable targets. (Never set a negative target) Conversely, in case of predicting performance in terms of load factor (L/F), the trend performance line can be upward, leveling or downward. Because we interesting to know the behavior of the trend (Performance) not to set target, so accordingly the monthly model selection process will be based on the higher value of R – square and not on the lower level of Risks (Target). Therefore: In short term forecasting, two objectives we address, First: Annual Forecasting – which defining the trend (Positive or Negative). Second: Monthly Forecasting – which defining the seasonality (Optimum Solution without constrains), Also Twelve Moving Average is a powerful tool to damp the discrepancy level of the data. A complete approach of setting target for RPKs and ASKs can demonstrated by the following link https://www.slideshare.net/wings_of_wisdom/predicting-aviation-industry-performance-lf-2019 While to predict the performance can be, explore by following article. First : Annual Forecasting – which defining the trend (Positive or Negative). The best way to set up annual target and minimize the data discrepancy is to address the data by two trend models using the concept of 12 rolling months. First – General Trend Model using the concept of Straight Line equation – defining general trend. Second – Most Recent Data Trend Model Using a Polynomial Model – Second-degree equation. This reflects the impact of most recent data on the path of general trend. The mid-point is the most convenient forecast annual result at Dec 2019. So as long as the gap between two models is small, the more accurate approaching value for setting annual target otherwise we have to select the half way distance between two extreme targets of these two models provided that Dec 2019 > Dec 2018. However, the outcomes can be represents by three directions 1- Positive Trends – both models in Upwards direction. The selection will be either the mid-point of positive trends Dec 2019 (Red Column) or the value of optimum solution (blue column) – select the one who has higher R-square value. By: Mohammed Salem Awad Aviation Consultant Data Source: https://www.iata.org/publications/economics/Pages/index.aspx
- 2. 22 2- Negative Trends – both models in downwards direction – However, here the story is different (as we are interesting in predicting performance, either good or bad, or positive or negative, or upward or downward trend. We select the one that has higher value of R-square. 3- High Discrepancy Data – this is occur when we apply two trend models, one has a positive trend, and the other one has a negative trend. i.e mean large gap between the two models, as we mentioned above we look to the one who has a higher R-square. Second: Monthly Forecasting – which defining the seasonality (Optimum Solution without constrains) This is the main core program to define the seasonality pattern without any preset constrains, it follows the trends based on 36 months database. Which always comes closely to the preset values. Moreover, the blue column in the annual graph represents it. Therefore, we get a complete picture to select the right performance level. However, when it’s a higher value, then we have to select the preset values as a best performance level. Input Data :Air Passenger Market Analysis – Report In depth analysis that addressed by Iata Economsit. We can use these data for our analysis to predict the performance of all Market Areas in the world. The World Market Segments according to IATA Specification are: 1- Total Airline Industry a. International b. Domestic Also 1- Total Airline Industry a. Total Africa Market. b. Total Asia Pecific Market. c. Total Europe Market d. Total Latin America Market e. Total Middle East Market f. Total North America Market
- 3. 33 Analysis: All Total Airline Industry and its market segment as African Market, Asia Pecific Market, Europe Market, Latin America Market, Middle East Market and North America Market are analysed annually and monthly. 1- Total Airline Industry Market: - 2019 Perdicting Perforamce (Load Factor) = 82.21 % - Value of R-square : 90.03 % - Data Discrepancy: Medium
- 4. 44 2- Total Africa Market: - 2019 Perdicting Perforamce (Load Factor) = 72.71 % - Value of R-square : 87.86 % - Data Discrepancy: Medium
- 5. 55 3- Total Asia Pecific Market : - 2019 Perdicting Perforamce (Load Factor) = 83.00 % - Value of R-square : 77.16 % - Data Discrepancy: High
- 6. 66 4- Total Europe Market: - 2019 Perdicting Perforamce (Load Factor) = 85.48 % - Value of R-square : 94.91 % - Data Discrepancy: Low
- 7. 77 5- Total Latin America Market - 2019 Predicting Perforamce (Load Factor) = 81.96 % - Value of R-square : 85.81 % - Data Discrepancy : High
- 8. 88 6- Total Middle East Market - 2019 Perdicting Perforamce (Load Factor) = 73.25 % - Value of R-square : 85.81 % - Data Discrepancy: Medium
- 9. 99 7- Total North America Market - 2019 Perdicting Perforamce (Load Factor) = 83.97 % - Value of R-square : 91.55 % - Data Discrepancy: Low
- 10. 1010 Results L/Factor R-square Data % % Discrepancy 1- Total Airline Industry 82.21 90.03 Medium a. Tot. Africa Market. 72.71 87.86 Medium b. Tot. Asia Pecific Market. 83.00 77.16 High c. Tot. Europe Market 85.48 94.91 Low d. Tot. Latin America Market 81.96 70.36 High e. Tot. Middle East Market 73.25 85.81 Medium f. Tot. North America Market 83.97 91.55 Low