
Recommended
Recommended
More Related Content
Similar to U3 IP.savMKTG420_U3IP.docUnit 3 Individual Project .docx
Similar to U3 IP.savMKTG420_U3IP.docUnit 3 Individual Project .docx (19)
More from willcoxjanay
More from willcoxjanay (20)
Recently uploaded
Recently uploaded (20)
U3 IP.savMKTG420_U3IP.docUnit 3 Individual Project .docx
- 1. U3 IP.sav MKTG420_U3IP.doc Unit 3 Individual Project 1 MACROBUTTON DoFieldClick Type your Name Here American Intercontinental University MACROBUTTON DoFieldClick Type your Paper Title Project Type: MKTG420 Unit 3 Individual Project MACROBUTTON DoFieldClick Date of Submission Abstract This is a single paragraph, no indentation is required. The next page will be an abstract; “a brief, comprehensive summary of the contents of the article; it allows the readers to survey the contents of an article quickly” (Publication Manual, 2010). The length of this abstract should be 35-50 words (2-3 sentences). NOTE: the abstract must be on page 2 and the body of the paper will begin on page 3. MACROBUTTON DoFieldClick Type your Paper Title Introduction Remember to always indent the first line of a paragraph (use the tab key). The introduction should be short (2-3 sentences). The margins, font size, spacing, and font type (italics or plain) are set in APA format. While you may change the names of the headings and subheadings, do not change the font. Part 1: Research background on the scales Introduce the concept and be sure to indent the first line of the paragraph. Provide background on each of the 4 scales
- 2. (assurance, empathy, reliability and responsiveness), not limited to a simple definition but as a measurement that aids marketers. Discuss how the questions in the survey are transformed into "scales" (also called "factors"). In other studies using SERVQUAL, how many and what types of respondents were included? Part 1 of the Individual Project should be 1 page in length. Be sure to cite your resources. Part 1: Concept of Scales/Factors Introduce the concept and be sure to indent the first line of the paragraph. Part 1: SERVQUAL Samples Introduce the concept and be sure to indent the first line of the paragraph. Part 2: (Full-Text Research) Service Quality and Segmentation Introduce the concept and be sure to indent the first line of the paragraph. Connect information from at least 3 articles. Do not write and overview or critique of the articles. Synthesize and connect the information contained to develop a solid understanding of how service quality and segmentation are related. Part 2 of the Individual Project should be 2 pages in length and should be predominately from at least three articles in AIU's full-text databases. Be sure to cite your resources. Part 3: Null/Hypo 1, ANOVA, Decision Attached is a small set of data that has been collected from brand loyal customers of Store 1 and Store 2. Write out a Null hypothesis and an alternate hypothesis for each of the 4 aspects of service quality that are include in the analysis (assurance, empathy, reliability and responsiveness) to see if there is a
- 3. difference between stores. Run 4 ANOVAs to test the Null hypotheses. State the decision for each of the tests. Part 3: Null/Hypo 2, ANOVA, Decision Write out a Null hypothesis and an alternate hypothesis for each of the 4 aspects of service quality that are include in the analysis (assurance, empathy, reliability and responsiveness) to see if there is a difference between stores. Run 4 ANOVAs to test the Null hypotheses. State the decision for each of the tests. Part 3: Null/Hypo 3, ANOVA, Decision Write out a Null hypothesis and an alternate hypothesis for each of the 4 aspects of service quality that are include in the analysis (assurance, empathy, reliability and responsiveness) to see if there is a difference between stores. Run 4 ANOVAs to test the Null hypotheses. State the decision for each of the tests. Part 3: Null/Hypo 4, ANOVA, Decision Write out a Null hypothesis and an alternate hypothesis for each of the 4 aspects of service quality that are include in the analysis (assurance, empathy, reliability and responsiveness) to see if there is a difference between stores. Run 4 ANOVAs to test the Null hypotheses. State the decision for each of the tests. Part 3: Compare ANOVA & t-test results Compare the results from last unit's t-tests. Part 3: Findings You now have two types of hypothesis tests. Analyze how your findings support or do not support what you found in the research. It is OK if your results are different than what you
- 4. expected. Part 3 of the Individual Project will vary in length based on the size of the SPSS output. Be sure to cite your resources Conclusion Add some concluding remarks-can be a sentence or two. References NOTE: The reference list starts on a new page after your conclusion. U3 IP SPSS Help.pdf Rules for Forming Hypotheses A (alternative) hypothesis is a statement of what you believe based on deductive reasoning. The null hypothesis, which is the opposite of the hypothesis, is tested in hopes that it can be REJECTED, thereby implying the other hypothesis can be supported (NOTICE we do not say true, false or proven). In journal articles, if only one hypothesis is shown, it is usually the HYPOTHESIS. We are really interested in the hypothesis, but the rules of statistics dictate that we test the null hypothesis. You only test concepts that are measured by your Surveys (the FACTORS**) A survey is made up of questions. The questions will either
- 5. measure a demographic (a label describing a person, thing). Examples would be gender, education, age, tenure, etc. OR They are questions that when put together (either averaged or summed) measure an abstract concept…we call this a scale or factor score (The individual portion of the U4 Group Assignment). When writing hypotheses, you do not compare on a single question, but rather a concept or factor/scale. If you measure a single question in a hypothesis for the project, you will get the whole question wrong. Each hypothesis must contain a comparison of one of the factors in your scale. You can compare two different factors or a factor plus a demographic (for example). Wording for ANOVAs & T-Tests: NULL: Males are the same as females with regard to ____________________. HYPO: Males are not the same as females with regard to ____________________. Three Possible Statements of Hypotheses HYPOTHESIS NULL HYPOTHESIS LOWER TAIL Less than < Greater than or equal to >/= UPPER TAIL Greater than > Less than or equal to </=
- 6. TWO TAIL Not equal to =/ Equal to = NOTE: although in advanced statistical testing, an equality symbol may be found in either the hypothesis or the null, it is often easier to have the equality sign in the NULL HYPOTHESIS. You may set it up either way, but the preferred manner (at this stage) is stated in the table above. WORDING FOR DECISION RULE…. These are not tests, but words to describe the Reject/Do Not Reject Status p-VALUE approach Given that the sig. (xx) is greater than the alpha (.xx), the NULL cannot be rejected therefore there is no support for the HYPO that (paste HYPO here) OR Given that the sig. (xx) is less than the alpha (.xx), the NULL is rejected therefore there is support for the HYPO that (paste HYPO here) Let us NOW look for the wording of the decision rule A TOTALLY DIFFERENT SURVEY IS BEING USED….
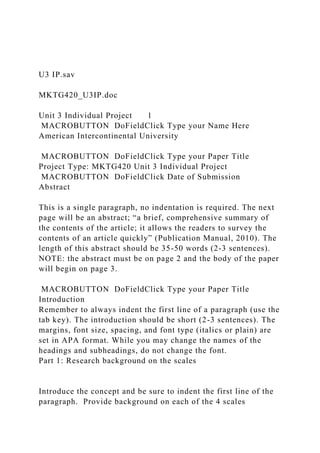
- 7. Given that the sig. xx is less than the alpha of .05, the NULL hypothesis is rejected and therefore there is support for the HYPO that (insert HYPO) Given that the sig. xx is greater than the alpha of .05, the NULL hypothesis is not rejected and therefore there is no support for the HYPO that (insert HYPO) Don’t get fancy and start using words like the HYPO is accepted or is true…just stay with these simple phrases…and remember-there are no absolutes in this HYPO testing game…that is why we use the concept of SUPPORT for a hypothesis. NULL: Males have the same level of Overall Job Satisfaction compared to Females. (M = F) Males have a different level of Overall Job Satisfaction compared to Females. (M =/ F) Looking at the mean Job Satisfaction scores for both genders shows that they are nearly equal, though the standard deviation for females is much larger,
- 8. showing that the scores are less consistent for females. Given that the sig. .688 is greater than the alpha of .05, the NULL hypothesis is not rejected and therefore there is no support for the HYPO that Males have a different level of Overall Job Satisfaction compared to Females. (M =/ F). Group Stati stics 24 2.7361 .18768 .03831 83 2.7925 .67559 .07416 Gender Male Femal e Overall Job Sati sfaction N Mean Std. Deviat ion Std. Error Mean Independent Samples Test 37.249 .000 -.403 105 .688 -.0564 .13986 -.33371 .22092 -.676 105.0 .501 -.0564 .08347 -.22189 .10911 Equal vari ances
- 9. assumed Equal vari ances not assumed Overall Job Satisfacti on F Sig. Levene's Test for Equal ity of Variances t df Sig. (2-tail ed) Mean Differen ce Std. Error
- 10. Differ ence Lower Upper 95% Confi dence Interval of the Difference t-t est for E qualit y of Means We can also run an ANOVA to test this: Given that the sig. .688 is greater than the alpha of .05, the NULL hypothesis is not rejected and therefore there is no support for the HYPO that Males have a different level of Overall Job Satisfaction compared to Females. (M =/ F). ANOVA Overall J ob Satisfaction .059 1 .059 .163 .688
- 11. 38.237 105 .364 38.296 106 Between Groups Within Groups Total Sum of Squares df Mean Square F Sig. U4 IP.sav MKTG420_U4IP.doc Unit 4 Individual Project 1 MACROBUTTON DoFieldClick Type your Name Here American Intercontinental University MACROBUTTON DoFieldClick Type your Paper Title Project Type: MKTG420 Unit 4 Individual Project MACROBUTTON DoFieldClick Date of Submission Abstract This is a single paragraph, no indentation is required. The next page will be an abstract; “a brief, comprehensive summary of the contents of the article; it allows the readers to survey the contents of an article quickly” (Publication Manual, 2010). The length of this abstract should be 35-50 words (2-3 sentences). NOTE: the abstract must be on page 2 and the body of the paper will begin on page 3.
- 12. MACROBUTTON DoFieldClick Type your Paper Title Introduction Remember to always indent the first line of a paragraph (use the tab key). The introduction should be short (2-3 sentences). The margins, font size, spacing, and font type (italics or plain) are set in APA format. While you may change the names of the headings and subheadings, do not change the font. Store Profiles This content is from Unit 1 IP, Part 1. Company Research This content is from Unit 1 IP, Part 1. Theory-Based Research on Marketing Segmentation This content is from Unit 1 IP, Part 2. Cost-Benefit Analysis of Investing in Segmentation Research This content is from Unit 1 IP, Part 2. Results of Focus Group This content is from Unit 2 DB Main Post. 2 SPSS Frequency Tables
- 13. This content is from Unit 2 DB Main Post. Analysis of Focus Group This content is from Unit 2 DB Main Post. Web vs. Store #1 This content is from Unit 2 IP, Part 1. Web vs. Store #2 This content is from Unit 2 IP, Part 1. Rating System This content is from Unit 2 IP, Part 1. Store #1 Image and Target Market Fit This content is from Unit 2 IP, Part 2. Store #2 Image and Target Market Fit This content is from Unit 2 IP, Part 2. Most successful store with rationale This content is from Unit 2 IP, Part 2.
- 14. Support for Improvements This content is from Unit 2 IP, Part 3. Three Improvements for Store #1 This content is from Unit 2 IP, Part 3. Three Improvements for Store #2 This content is from Unit 2 IP, Part 3. Part 1: Research on the Survey This content is from Unit 3 IP, Part 1. Research background on the scales This content is from Unit 3 IP, Part 1. SERVQUAL samples This content is from Unit 3 IP, Part 1. Service Quality and Segmentation This content is from Unit 3 IP, Part 1.
- 15. Chart #1: Gender INSERT CHART HERE Description of chart #1: gender. Insert your written description of the table pasted above. Chart #2: xx INSERT CHART HERE Description of chart #2: xx. Insert your written description of the table pasted above. Chart #3: xx INSERT CHART HERE Description of chart #3: xx. Insert your written description of the table pasted above. Table #4: Factors INSERT TABLE HERE Description of table #4: factors. Insert your written description of the table pasted above. Null/Hypo, Independent Sample T-Test 1, Decision From Unit 2 IP, Part 2 Null/Hypo, Independent Sample T-Test 2, Decision From Unit 2 IP, Part 2 Null/Hypo, Independent Sample T-Test 3, Decision From Unit 2 IP, Part 2
- 16. Null/Hypo, Independent Sample T-Test 4, Decision From Unit 2 IP, Part 2 Null/Hypo, ANOVA 1, Decision From Unit 3 IP, part 3 Null/Hypo, ANOVA 2, Decision From Unit 3 IP, part 3 Null/Hypo, ANOVA 3, Decision From Unit 3 IP, part 3 Null/Hypo, ANOVA 4, Decision From Unit 3 IP, part 3 Compare ANOVA & t-test results From Unit 3 IP, part 3 Hypothesis Test -Correlation #1 Null and alternate hypotheses. Write out a Null & Alternate Hypothesis (alpha = .05). The test. Run the test and paste it in the document The decision rule.
- 17. State the decision rule. Hypothesis Test -Correlation #2 Null and alternate hypotheses. Write out a Null & Alternate Hypothesis (alpha = .05). The test. Run the test and paste it in the document The decision rule. State the decision rule. Hypothesis Test -Regression #1 Null and alternate hypotheses. Write out a Null & Alternate Hypothesis (alpha = .05). The test. Run the test and paste it in the document The decision rule. State the decision rule. Hypothesis Test -Regression #1 Null and alternate hypotheses. Write out a Null & Alternate Hypothesis (alpha = .05).
- 18. The test. Run the test and paste it in the document The decision rule. State the decision rule. Compare Correlation, Regression, ANOVA and t-Test Results From Unit 3 IP, part 3 Findings and Segmentation Applications You now have used qualitative and quantitative tools to assess service quality and segmentation in the stores. How can a marketing manager use these results to build a segmentation strategy in one of the target stores. Part 3 of the Individual Project will be 1 page in length. Conclusion Add some concluding remarks-can be a sentence or two. References NOTE: The reference list starts on a new page after your conclusion. U4 IP SPSS Help.pdf Rules for Forming Hypotheses A (alternative) hypothesis is a statement of what you believe
- 19. based on deductive reasoning. The null hypothesis, which is the opposite of the hypothesis, is tested in hopes that it can be REJECTED, thereby implying the other hypothesis can be supported (NOTICE we do not say true, false or proven). In journal articles, if only one hypothesis is shown, it is usually the HYPOTHESIS. We are really interested in the hypothesis, but the rules of statistics dictate that we test the null hypothesis. You only test concepts that are measured by your Surveys (the FACTORS**) A survey is made up of questions. The questions will either measure a demographic (a label describing a person, thing). Examples would be gender, education, age, tenure, etc. OR They are questions that when put together (either averaged or summed) measure an abstract concept…we call this a scale or factor score (The individual portion of the U4 Group Assignment). When writing hypotheses, you do not compare on a single question, but rather a concept or factor/scale. If you measure a single question in a hypothesis for the project, you will get the whole question wrong. Each hypothesis must contain a comparison of one of the factors in your scale. You can compare two different factors or a factor plus a demographic (for example).
- 20. Wording for Correlations & Regressions: NULL: This is no relationship (correlation) between _____________________ and gender. HYPO: This is a relationship between (correlation) _____________________ and gender. more than one factor compared. WORDING FOR DECISION RULE…. These are not tests, but words to describe the Reject/Do Not Reject Status p-VALUE approach Given that the sig. (xx) is greater than the alpha (.xx), the NULL cannot be rejected therefore there is no support for the HYPO that (paste HYPO here) OR Given that the sig. (xx) is less than the alpha (.xx), the NULL is rejected therefore there is support for the HYPO that (paste HYPO here) Let us NOW look for the wording of the decision rule A TOTALLY DIFFERENT SURVEY IS BEING USED….
- 21. Given that the sig. xx is less than the alpha of .05, the NULL hypothesis is rejected and therefore there is support for the HYPO that (insert HYPO) Given that the sig. xx is greater than the alpha of .05, the NULL hypothesis is not rejected and therefore there is no support for the HYPO that (insert HYPO) Don’t get fancy and start using words like the HYPO is accepted or is true…just stay with these simple phrases…and remember-there are no absolutes in this HYPO testing game…that is why we use the concept of SUPPORT for a hypothesis. CORRELATION: "Flag Significant Correlations"- this is a great tool since it tells you when to reject!! REGRESSION
- 22. FYI- when you run a regression, be sure to request an ANOVA table under options. This way you know when to reject!