SlideShare a Scribd company logo
1 of 10
GraspSQL | SQL Group By
What does 'group by' do:
groups lines in a table
How:
lines with same value in one or more column goes in
the same group
Purpose:
display averages, sums, maximum values for each
group.
GraspSQL | SQL Group By
Quiz:
When grouping by state, how
many groups in this table
When grouping by city, how
many groups in this table
When grouping by revenue, how
many groups in this table
GraspSQL | SQL Group By
In the following example, we will show:
the sum of revenues earned per state.
the number of sales transactions per state.
the amount of the biggest transaction per state.
the amount of the smallest transaction per state.
the average sales transaction amount per state.
GraspSQL | SQL Group By
Example:
When grouping by state,
we select the state
The only other things
we can select
are aggregate functions
GraspSQL | SQL Group By
AVOID:
Selecting a column other than column used for
grouping without an aggregate function:
select state, city, sum(revenue)
from sales
group by state
GraspSQL | SQL Group By
Taking into account only sales from 2014
select state, sum(revenue)
from sales
where year=2014
group by state
GraspSQL | SQL Group By
What is 'where' doing:
Indicates which lines we take into consideration when
grouping (other lines are just ignored)
GraspSQL | SQL Group By
Showing group only if sum revenue for group >
50000
select state, sum(revenue)
from sales
group by state
having sum(revenue)>60000
GraspSQL | SQL Group By
What is 'having' doing:
Indicates which groups are shown, based on aggregate
function value for the group
GraspSQL | SQL Group By
Quiz:
When grouping by state:
To consider only revenues per city
over 10 000 do we use where
revenue = 10000 or having revenue
= 10000 or
To consider only states for which
the total revenue is over 10 000
do we use where revenue = 10000
or having revenue = 10000

More Related Content

Similar to Understand SQL Group By with this concise guide

Calculated Columns and Measures in Power BI.pptx
Calculated Columns and Measures in Power BI.pptxCalculated Columns and Measures in Power BI.pptx
Calculated Columns and Measures in Power BI.pptxSelect Distinct Limited
 
Adding measures to Calcite SQL
Adding measures to Calcite SQLAdding measures to Calcite SQL
Adding measures to Calcite SQLJulian Hyde
 
Level of-detail-expressions
Level of-detail-expressionsLevel of-detail-expressions
Level of-detail-expressionsYogeeswar Reddy
 
Introduction to oracle functions
Introduction to oracle functionsIntroduction to oracle functions
Introduction to oracle functionsNitesh Singh
 
Oracle_Analytical_function.pdf
Oracle_Analytical_function.pdfOracle_Analytical_function.pdf
Oracle_Analytical_function.pdfKalyankumarVenkat1
 
Smart Calculation Building
Smart Calculation BuildingSmart Calculation Building
Smart Calculation BuildingMrunal Shridhar
 
Choosing the Right Charts for Your Boss, Board or Senior Management
Choosing the Right Charts for Your Boss, Board or Senior Management Choosing the Right Charts for Your Boss, Board or Senior Management
Choosing the Right Charts for Your Boss, Board or Senior Management Mekko Graphics
 
Industry analysis tool 2.0
Industry analysis tool 2.0Industry analysis tool 2.0
Industry analysis tool 2.0Joseph Cardoni
 
Building a semantic/metrics layer using Calcite
Building a semantic/metrics layer using CalciteBuilding a semantic/metrics layer using Calcite
Building a semantic/metrics layer using CalciteJulian Hyde
 
Top N and bottom N view on the same worksheet In Tableau
Top N and bottom N view on the same worksheet In TableauTop N and bottom N view on the same worksheet In Tableau
Top N and bottom N view on the same worksheet In TableauRanganna Naik
 

Similar to Understand SQL Group By with this concise guide (20)

DWO -Pertemuan 1
DWO -Pertemuan 1DWO -Pertemuan 1
DWO -Pertemuan 1
 
Calculated Columns and Measures in Power BI.pptx
Calculated Columns and Measures in Power BI.pptxCalculated Columns and Measures in Power BI.pptx
Calculated Columns and Measures in Power BI.pptx
 
Introduction to Oracle Functions--(SQL)--Abhishek Sharma
Introduction to Oracle Functions--(SQL)--Abhishek SharmaIntroduction to Oracle Functions--(SQL)--Abhishek Sharma
Introduction to Oracle Functions--(SQL)--Abhishek Sharma
 
Adding measures to Calcite SQL
Adding measures to Calcite SQLAdding measures to Calcite SQL
Adding measures to Calcite SQL
 
Tableau - crosstab
Tableau - crosstabTableau - crosstab
Tableau - crosstab
 
Group functions
Group functionsGroup functions
Group functions
 
Level of-detail-expressions
Level of-detail-expressionsLevel of-detail-expressions
Level of-detail-expressions
 
Introduction to oracle functions
Introduction to oracle functionsIntroduction to oracle functions
Introduction to oracle functions
 
5. Group Functions
5. Group Functions5. Group Functions
5. Group Functions
 
Oracle_Analytical_function.pdf
Oracle_Analytical_function.pdfOracle_Analytical_function.pdf
Oracle_Analytical_function.pdf
 
Advanced Top N Measures in Power BI
Advanced Top N Measures in Power BIAdvanced Top N Measures in Power BI
Advanced Top N Measures in Power BI
 
Smart Calculation Building
Smart Calculation BuildingSmart Calculation Building
Smart Calculation Building
 
Les05
Les05Les05
Les05
 
Choosing the Right Charts for Your Boss, Board or Senior Management
Choosing the Right Charts for Your Boss, Board or Senior Management Choosing the Right Charts for Your Boss, Board or Senior Management
Choosing the Right Charts for Your Boss, Board or Senior Management
 
SQL Tips Calculate Running Totals.pptx
SQL Tips Calculate Running Totals.pptxSQL Tips Calculate Running Totals.pptx
SQL Tips Calculate Running Totals.pptx
 
Tableau groups vs sets
Tableau groups vs setsTableau groups vs sets
Tableau groups vs sets
 
Industry analysis tool 2.0
Industry analysis tool 2.0Industry analysis tool 2.0
Industry analysis tool 2.0
 
Building a semantic/metrics layer using Calcite
Building a semantic/metrics layer using CalciteBuilding a semantic/metrics layer using Calcite
Building a semantic/metrics layer using Calcite
 
Tableau line chart
Tableau   line chartTableau   line chart
Tableau line chart
 
Top N and bottom N view on the same worksheet In Tableau
Top N and bottom N view on the same worksheet In TableauTop N and bottom N view on the same worksheet In Tableau
Top N and bottom N view on the same worksheet In Tableau
 

Understand SQL Group By with this concise guide

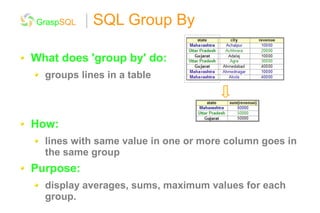
  • 1. GraspSQL | SQL Group By What does 'group by' do: groups lines in a table How: lines with same value in one or more column goes in the same group Purpose: display averages, sums, maximum values for each group.
  • 2. GraspSQL | SQL Group By Quiz: When grouping by state, how many groups in this table When grouping by city, how many groups in this table When grouping by revenue, how many groups in this table
  • 3. GraspSQL | SQL Group By In the following example, we will show: the sum of revenues earned per state. the number of sales transactions per state. the amount of the biggest transaction per state. the amount of the smallest transaction per state. the average sales transaction amount per state.
  • 4. GraspSQL | SQL Group By Example: When grouping by state, we select the state The only other things we can select are aggregate functions
  • 5. GraspSQL | SQL Group By AVOID: Selecting a column other than column used for grouping without an aggregate function: select state, city, sum(revenue) from sales group by state
  • 6. GraspSQL | SQL Group By Taking into account only sales from 2014 select state, sum(revenue) from sales where year=2014 group by state
  • 7. GraspSQL | SQL Group By What is 'where' doing: Indicates which lines we take into consideration when grouping (other lines are just ignored)
  • 8. GraspSQL | SQL Group By Showing group only if sum revenue for group > 50000 select state, sum(revenue) from sales group by state having sum(revenue)>60000
  • 9. GraspSQL | SQL Group By What is 'having' doing: Indicates which groups are shown, based on aggregate function value for the group
  • 10. GraspSQL | SQL Group By Quiz: When grouping by state: To consider only revenues per city over 10 000 do we use where revenue = 10000 or having revenue = 10000 or To consider only states for which the total revenue is over 10 000 do we use where revenue = 10000 or having revenue = 10000