OPM assignment TIPS
Word count
3,000 words +/-10% (excluding graphics, appendices, and references)
-- Task 1 (35 marks), 1050 words
-- Task 2 (25 marks), 750 words
-- Task 3 (40 marks), 1200 words
Deadline 11am, Tuesday 21rd April 2020
If you have any question about your assignment
I will be still around during Easter. You can email me and book an appointment if needed.
Face-to-face meeting
Skype meeting
I will be on business trip (late Mar - early Apr), so I may reply your message slowly due to limited access to internet.
Assignment Format
Report Style
List your observation times/visits
Observation timeTarget supermarket 31 March 2020Sainsbury’s1 April 2020ASDA5 April 2020ASDA9 April 2020Sainsbury’s
Assignment Format
Report Style
List your observation times/visits
Report Structure
Introduction
Section 1, 2, and 3
Subsection 1.1, 1.2; 2.1…….
Conclusion
Appendix (not include in word count)
Remarks: Introduction and conclusion are optional
IMPORTANT
DON’T disturb the staff during your visit
DON’T try to enter the restricted area in the store!
Public area
Instructions of Assignment
Report style. Have a clear headings for Section 1 and Section 2
Structure – include an abstract (a short executive summary)
USE Diagrams to illustrate your ideas.
If you draw your diagrams in MS Words, use “Autoshape”.
If you draw your diagram on the paper, please scan it and attach it to the report.
Use Pictures, and make indications on the pictures if appropriate, see examples in next slide.
Pictures, Diagrams and Tables should be located within the content (Not appendix!)
DON’T only rely on the information in the literature and/or internet. You need to visit the case companies in order to answer the questions.
If you draw your diagrams on the paper, Do not use an iPhone to take a picture and attach it to the report.
Reminder
Please reserve plenty of time to upload your work to the submission point (i.e. don’t submit your work at the last minute).
Please be aware the file size of your report. Your file size may be large since you may include some large photos (i.e. without reducing the resolution and the size of photo)
In the previous year, a very few students uploaded the report to the submission point at the last minute. It might take a long time to upload it to the VLE system due to the file size (delay for a few second, but this is still a late submission)
How to draw diagrams in MSWord
Step 1
Create New Canvas
This is Canvas
Step 2
Insert picture into the Canvas
Step 3
Mark the indication(s) within the Canvas
(please use Autoshape to make the drawings)
Task1 (35 Marks)
What are the major differences in operation management practices between these two supermarkets? You will need to consider the key aspects of operation topics such as layout and flow, process management (draw process mapping of one selected product), inventory management, and lean management. You only need to focus on two selected aspects in y ...
OPM assignment TIPSWord count3,000 words +-10 (exclu.docx
1. OPM assignment TIPS
Word count
3,000 words +/-10% (excluding graphics, appendices, and
references)
-- Task 1 (35 marks), 1050 words
-- Task 2 (25 marks), 750 words
-- Task 3 (40 marks), 1200 words
Deadline 11am, Tuesday 21rd April 2020
If you have any question about your assignment
I will be still around during Easter. You can email me and book
an appointment if needed.
Face-to-face meeting
Skype meeting
I will be on business trip (late Mar - early Apr), so I may reply
your message slowly due to limited access to internet.
Assignment Format
Report Style
List your observation times/visits
Observation timeTarget supermarket 31 March
2020Sainsbury’s1 April 2020ASDA5 April 2020ASDA9 April
2020Sainsbury’s
2. Assignment Format
Report Style
List your observation times/visits
Report Structure
Introduction
Section 1, 2, and 3
Subsection 1.1, 1.2; 2.1…….
Conclusion
Appendix (not include in word count)
Remarks: Introduction and conclusion are optional
IMPORTANT
DON’T disturb the staff during your visit
DON’T try to enter the restricted area in the store!
Public area
Instructions of Assignment
Report style. Have a clear headings for Section 1 and Section 2
Structure – include an abstract (a short executive summary)
USE Diagrams to illustrate your ideas.
If you draw your diagrams in MS Words, use “Autoshape”.
If you draw your diagram on the paper, please scan it and attach
it to the report.
Use Pictures, and make indications on the pictures if
appropriate, see examples in next slide.
Pictures, Diagrams and Tables should be located within the
content (Not appendix!)
DON’T only rely on the information in the literature and/or
internet. You need to visit the case companies in order to
3. answer the questions.
If you draw your diagrams on the paper, Do not use an iPhone
to take a picture and attach it to the report.
Reminder
Please reserve plenty of time to upload your work to the
submission point (i.e. don’t submit your work at the last
minute).
Please be aware the file size of your report. Your file size may
be large since you may include some large photos (i.e. without
reducing the resolution and the size of photo)
In the previous year, a very few students uploaded the report to
the submission point at the last minute. It might take a long
time to upload it to the VLE system due to the file size (delay
for a few second, but this is still a late submission)
How to draw diagrams in MSWord
Step 1
Create New Canvas
4. This is Canvas
Step 2
Insert picture into the Canvas
Step 3
Mark the indication(s) within the Canvas
(please use Autoshape to make the drawings)
Task1 (35 Marks)
What are the major differences in operation management
practices between these two supermarkets? You will need to
consider the key aspects of operation topics such as layout and
flow, process management (draw process mapping of one
selected product), inventory management, and lean management.
You only need to focus on two selected aspects in your
discussion.
Task 1 Tips (1)
Layout and flow
Map the layout diagrams of the supermarkets
Identify the layout types
-- Fixed position layout, functional layout, cell layout, product
layout
Critically evaluate the characteristics of them
-- how they influence the 5 performance objectives: quality,
flexibility, cost, speed, dependability
-- how the flow happens in the layout
-- what are the advantages and disadvantages
5. Cost
Quality
Flexibility
Dependability
Speed
Does the layout match the polar diagram objectives? (optional)
Task 1 Tips (2.1)
Process management (draw process mapping of one selected
product)
Select an important process in the supermarket to evaluate their
flows and steps.
You should apply the process mapping technique to describe the
processes in detail, and state how the activities within the
process relate to each other.
Critically evaluate the flow of the process and try to challenge
the current setting of activities, and find any way to improve the
current process (e.g. reducing unnecessary activities).
6. Task 1 Tips (2.2)
Process management (draw process mapping of one selected
product)
Process analysis
Identify the ‘wastes’ in the shopfloor. Wastes influence the
production lead time, cause a longer time for the customer to
receive the product/service, and even affect the quality of the
product/service.
5 performance objectives
Process Mapping (flow charts)
Can be used to give a detailed understanding prior to
improvement.
The act of recording each stage in the process quickly shows up
poorly organized flows.
Can also clarify improvement opportunities and shed further
light on the internal mechanics or workings of an operation
It highlights problem areas where no procedure exists to cope
with a particular circumstances
Delay (a wait, e.g. for materials)
7. Operation (an activity that directly adds value)
Inspection (a check of some sort)
Transport (a movement of something)
Storage (deliberate storage, as opposed to a delay)
Process mapping symbols derived from ‘Scientific Management’
Decision (exercising discretion)
Process mapping symbols derived from Systems Analysis
Direction of flow
Input or Output from the process
Activity
Beginning or end of process
Process mapping symbols
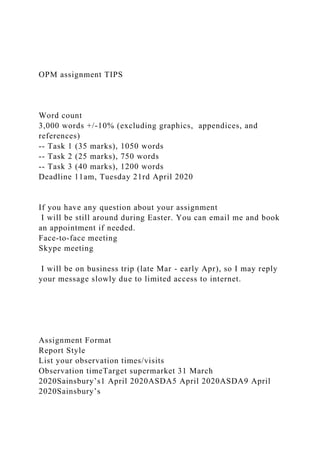
Example of Process Mapping – Sandwich making and selling
process
Exercise – A “make to order” example
Place Production Order
Start
Check BOM
Check Material inventory
8. Enough material?
Material purchasing process
Material
inventory
Assembly1
WIP1
Assembly X
FG
…..
Yes
No
QC
inspection
Delay
Rework
Delivery
to customer
Up to standard?
Yes
No
End
Purchase Material
9. Search the potential supplier list
Start
Select the appropriate supplier according to criteria
Enquiry of required stock from supplier
Enough stock?
Place order
delivery from supplier
Incoming
inspection
Receive stock
Up to standard?
Material
inventory
Return to supplier
End
Yes
No
Yes
No
Process Analysis
Task 1 Tips (2.3)
You should map the diagram more in details
-- Identify the process time of each process step
10. Don’t choose a product which is too simple in process, e.g.
Americano or Espresso
Task 1 Tips (3.1)
Lean management
Push and pull system
Waste
How to eliminate the waste
5S
Kanban
VSM
5 performance objectives
Traditional approach and Lean synchronization
Caused by non-value added movement of people and machines
Unnecessary walking, bending, twisting
Searching through database, files, manuals
Extra clicks or keystrokes
Work in process waiting for input/ information
11. Awaiting Approval
Wait for meeting to start
Waiting for systems to start
WAITING
Waiting for Upstream process to provide inputs
MOTION
What might it look like
Caused by the unnecessary movement of material , information
TRANSPORTATION
Moving documents from place to place in the process
Manual workflows
Office Moves
27
This type of waste occurs whenever we have rework, defects or
audit
Incorrect reports/data entry errors
Information not right the first time
More finished product than the customer needs
Emails/ requests to be read or handled
12. INVENTORY
This waste is work in process or finished product
DEFECTS/ CORRECTION
What might it look like
Caused by unnecessary processes & operations
OVER PROCESSING
Unnecessary hands-off
No decision rights
Complicated approvals
27
Producing more product / information than the customer wants
and before the customer wants it
Printing extra copies of reports
Reports or information nobody uses
Back ups between departments
OVER PRODUCTION
13. What might it look like
27
Kanban System
The Kanban System is a easy mean to control the material flow.
https://www.youtube.com/watch?v=R8dYLbJiTUE (Kanban
video)
Source: www.ebz-beratungszentrum.de
Source: www.shelftaguspply.com
To ensure a clean, orderly, safe and productive workplace.
5S is a Foundation for Improvement
5S
Sustain
整理(せいり、Seiri)
整頓(せいとん、Seiton)
清掃(せいそう、Seisou)
清潔(せいけつ、Seiketsu)
躾(しつけ、Shitsuke)
5S For Improvement
14. Discuss the definition.
1S
Sort
4S
Standardize
3S
Shine
2S
Set
‘Value stream’ mapping focuses on value-adding activities and
distinguishes between value-adding and non-value-adding
activities. It is similar to process mapping but different in four
ways:
It uses a broader range of information than most process maps.
It is usually at a higher level (5–10 activities) than most process
15. maps.
It often has a wider scope, frequently spanning the whole supply
chain.
It can be used to identify where to focus future improvement
activities.
‘Value stream’ mapping
Task 1 Tips (4.1)
Inventory management
Role of inventory
Identify inventories
- Physical inventory
- Queues of customers
- Information in databases
Inventory systems
Inventory types
Task 1 Tips (4.2)
Inventory management
How much to order?
When to order?
How to control the system?
5 performance objectives
16. Examples of inventory held in processes, operations and supply
networks
Single-stage inventory system
Suppliers
e.g. Automotive parts distributor
e.g. Local retail store
Suppliers
Stock
Sales operation
17. Central depot
Distribution
Local distribution point
Sales operation
Two-stage inventory system
Single-stage and two-stage inventory systems
e.g. Television manufacturer
Suppliers
Input stock
18. Stage 1
WIP
Stage 2
WIP
Stage 3
Finished goods stock
A multi-stage inventory system
Four types of inventory
Buffer inventory
Cycle inventory
Anticipating inventory
Pipeline inventory
19. Task 2 (25 marks)
Analyse and discuss the differences in operation strategies
between the two supermarkets, and how their operations
strategies influence the operation settings of both supermarkets.
Task 2 tips (1)
Identify Competitive factors of both Supermarket
Map the Competitive factors to Performance objectives
Do the their operation strategies reflect on operations settings
(activities, layout, resources) in both stores? Give solid
examples (and take pictures for evidence)
How to match the operations strategies with the market
requirements?
What are the advantages and disadvantages?
Others hints: product variety, procedures of operation and
activities, no. of staff, facility layout (types of layout?)
Examples: Different banking services require different
performance objectives (1)
Different banking services require different performance
objectives (2)
Different competitive factors imply different performance
objectives
Competitive factors
If the customers value these ...
20. Performance objectives
Then, the operations will need to excel at these ...
Low price
Cost
High quality
Quality
Fast delivery
Speed
Reliable delivery
Dependability
Innovative products and services
Flexibility (products and services)
Wide range of products and services
Flexibility (mix)
Ability to change the timing or quantity of products and
services
Flexibility (volume and/or delivery)
3
Order Winning, Qualifying, less important factors
Order winners – are those things which directly and
significantly contribute to winning business.
21. Qualifying factors -- are those aspects of competitiveness where
the operation’s performance has to be above a particular level
just to be considered by the customer.
Performance below this ‘qualifying’ level of performance will
possibly disqualify the company from being considered by many
customers.
Less important factors -- They do not influence customers in
any significant way
Task 2 Tips (2)
You will find a lot of interesting “operation settings” in the two
supermarkets.
There must be reasons for the supermarkets to setup these
designs (operation design, layout design). E.g. reducing cost?
Better utilising space? Better utilising human resources? Better
customer service?
The biggest challenge is to link this design and settings into
performance objectives.
If you do not have any clue, Try to spot the differences between
one supermarkret to another supermarket
ALDI example (1)
22. Width
Reduction Area
ALDI example (2)
Portable
ALDI example (3)
ALDI example (4)
Task 3 (40 marks)
The managers of both supermarkets would like to implement
quality management techniques to improve the operations.
Select one of the supermarkets (either Sainsbury’s or ASDA)
and discuss the feasibility and potential benefits of applying the
following quality management techniques. You only need to
focus on two selected quality management techniques in your
discussion.
Gap analysis
Statistical process control
David Garvin’s 8 quality dimensions
23. Fishbone
5 why’s
Task 3 Tips (1)
Feasibility of adopting two selected techniques to one of the
supermarkets: Gap analysis, Statistical process control, David
Garvin’s 8 quality dimensions, Fishbone, 5 why’s.
Study its feasibility (very important)
-- Do you think it is a good idea to use the selected techniques?
-- Are the quality tools useful in identifying the weaknesses in
the operations and/or root cause of quality problem in a cafe?
(Hints Machine performance, staff performance, customer
complaint.)
Task 3 Tips (1)
Please illustrate (use tables/figures/drawings) your ideas about
how to use it and implement it in one of the supermarkets .
The benefit of using the selected techniques
The challenge of applying the selected techniques
-- mindset?
-- sustainability?
Use literature to support your arguments/analysis
Remarks: You can plot a diagram based on some dummy data to
illustrate your idea.
Task 3 Tips (3)
Statistical process control
24. You can discuss which process is worth to use run chart to
investigate the quality over time
You can plot a mean chart and a range chart based on some
dummy data to illustrate your idea.
Hints – quality of the food, quality of the service
Control Chart Advantages
Simple to use and understand
Common language between employees and management
Indicates when the process is in control
Indicates when action is necessary to eliminate SPECIAL
CAUSE variation
Identification of special and common cause variation reduces
confusion and misunderstanding
The perception – Expectation Gap
Gap
Action required to ensure high
perceived quality
Main organizational
responsibility
Gap 3
Operations
Ensure actual product or service conforms to internally
25. specified quality level
Gap 4
Marketing
Ensure that promises made to customers concerning the product
or service can really be delivered
Gap 1
Ensure consistency between internal quality specification and
the expectations of customers
Marketing, operations, product/service development
Gap 2
Ensure internal specification meets its intended concept of
design
Marketing, operations, product/service development
For example, a car may be designed to need servicing every
10,000 kilometres but the customer may expect 15,000-
kilometre service intervals.
For example, the concept of a car might have been for an
inexpensive, energy-efficient means of transportation, but the
inclusion of a climate control system may have both added to its
cost and made it less energy-efficient.
For example, the internal quality specification for a car may be
that the gap between its doors and body, when closed, must not
exceed 7 mm. However, because of inadequate equipment, the
gap in reality is 9 mm.
For example, an advertising campaign for an airline might show
a cabin attendant offering to replace a customer’s shirt on which
food or drink has been spilt, whereas such a service may not in
26. fact be available should this happen
David Garvin’s 8 Quality Dimensions
Dimension 1: Performance
Performance refers to a product's primary operating
characteristics
Does the product perform to its standards? Does the product do
what it says on the box?
Dimension 2: Features
Features are additional characteristics that enhance the appeal
of the product or service to the user.
What additional benefits will be added to the product? Will they
be they tangible or non-tangible benefits. For example this
could be after sales service, or guarantees.
Dimension 3: Reliability
Reliability is the likelihood that a product will not fail within a
specific time period
Is the product consistent. Will it perform well over its lifetime
and perform consistently. Many brands have developed trust
with customers because of the issue of reliability.
David Garvin’s 8 Quality Dimensions (2)
Dimension 4: Durability
27. Durability measures the length of a product’s life.
How durable is your product. Will it last with daily use?
Dimension 5: Conformance
Conformance is the precision with which the product or service
meets the specified standards
Does your product meet with any agreed internal and national
specifications? For example, safety regulations and laws.
Dimension 6: Serviceability
Serviceability is the speed with which the product can be put
into service when it breaks down
Is the product easy to service. Does the organisation offer
enough service support.
David Garvin’s 8 Quality Dimensions (3)
Dimension 7: Aesthetics
How a product looks, feels, sounds, tastes, or smells. Aesthetics
is largely a matter of personal judgment and a reflection of
individual preference; it is a highly subjective dimension
Is the product appealing to the eye? Design is important for
many products; the colour picked indicates certain things.
Dimension 8: Perceived Quality
Perceived Quality is the quality attributed to a good or service
based on indirect measures., e.g. made in France
Reputation. Consumers do not always have complete
information about a product's or service's attributes; indirect
28. measures or perceived quality may be their only basis for
comparing brands..
What sort of quality perception does the marketing team want to
convey in their marketing message? Will price charged reflect
the quality of the product? What brand name is going to be used
and does this convey any sort of quality perception.
Structure of a cause and effect (fishbone) diagram
Effect
Category of causes
Category of causes
Category of causes
Category of causes
Category of causes
Category of causes
Principle cause
29. Principal cause
Principle cause
Principle cause
Principle cause
Principle cause
Principle cause
Principle cause
Principle cause
Detailed causes
Detailed causes
Detailed causes
Detailed causes
Detailed causes
Detailed causes
Detailed causes
Root effect arrow
30. Root cause
5Whys: an effective problem-solving technique – example 1
Why is our client, unhappy?
Because we did not deliver our services when we said we
would.
Why were we unable to meet the agreed-upon timeline or
schedule for delivery?
The job took much longer than we thought it would.
Why did it take so much longer?
Because we underestimated the complexity of the job.
Why did we underestimate the complexity of the job?
Because we made a quick estimate of the time needed to
complete it, and did not list the individual stages needed to
complete the project.
Why didn't we do this?
Because we were running behind on other projects. We clearly
need to review our time estimation and specification
procedures.
Link the fishbone to 5 Whys ?
6. Establish which are the most likely causes. Circle these and
develop them further by asking 5 Whys to reach root cause
31. 7. Substantiate each “Why” step with real data to confirm. This
may take some time depending on data availability but will
prove to be entirely worthwhile in resolving any doubt within or
external to the team and in justifying possible expenditure
8. Agree corrective actions and begin trials.
Data
Data
5thWhy
32. Data
Data
Data
3rdWhy
2ndWhy
Root Cause
4thWhy
1stWhy
Cause
Cause
Cause
Cause
HUMAN
Process StepMinutesValue-Added?
Dealer Faxes Orderno
Paper Order Createdno
Order Sits in Fax Inbox120no
Internal Mail Delivers Fax60no
Order Sits in Clerk's Inbox60no
Clerk Processes Order5no
Worker Picks Order20yes
Inspector Checks Order2no
Transport Firm Delivers Order120yes
Dealer Receives Orderno
Total Process Minutes:387
Total Value-Added Minutes:140
Percent Value-Added Time:36.18%
1a.)HoursPagesProductivity
(pages/hour)Marci15201.33Jack8151.88The output is the
number of written report pages. The input is the number of
hours spent on research and writing. This is a single-factor
productivity measure.b.)The limitations of using productivity
measures to evaluate their performance is that the quality of the
work is not assessed, only the number of pages per hour. The
33. instructor may use other measures including the depth of
analysis, completeness of ideas,
2WEEKOUTPUT (IN UNITS)LABOR HOURSPRODUCTIVITY
(UNITS/HOUR)OUTPUT (IN UNITS)LABOR
HOURSPRODUCTIVITY
(UNITS/HOUR)11,8502009.2521,3611509.0732,12215014.1542
,63825010.5552,59925010.4062,8673009.56AVERAGE:10.50W
eek 3 seems unusual as it is almost 40% higher than the average
units/hour productivity level. There seems to be high
variability in the production process.
3YEARTOTAL SALESPHONE REP COSTSWEB SITE
COSTSProductivity (Sales/Phone Rep $)Productivity
(Sales/Web Site $)Productivity (Sales/Total
$)1999$4,790,000$200,000$50,000$23.95$95.80$19.162000$5,
750,000$210,000$65,000$27.38$88.46$20.912001$6,900,000$2
21,000$85,000$31.22$81.18$22.552002$8,280,000$230,000$11
0,000$36.00$75.27$24.352003$9,930,000$245,000$145,000$40.
53$68.48$25.462004$11,920,000$255,000$190,000$46.75$62.7
4$26.79AVERAGE:$34.30$78.66$23.20a.)The productivity of
each dollar spent on phone rep costs has increased each year
during the six year period.b.)The productivity of each dollar
spent on web site costs has decreased each year.c.)The
limitation of the single-factor productivity measures are that
they assume there is a 1:1 relationship between the output and
input of interest that can be managed. Considering just labor
costs (phone reps) may be inappropriate, especially when
labord.)The sales per dollar spent on total cost (phone rep plus
web site) has increased each year during the six year period.
This leads to the conclusion that the overall efficiency of sales
is improving.
4Required (Seconds)Performance
(Seconds)EfficiencyLes607085.71%Other performance
measures that might be important include the number of errors
(quality), other tasks Les may be able to complete in addition to
this form, etc.
5CUSTOMERACTUAL TIME REQUIRED TO PERFORM
34. ROUTINE MAINTENANCE (hours)STANDARD TIME TO
PERFORM ROUTINE MAINTENANCE
(hours)EFFICIENCYABC
Company1.82.0111.11%Preztel2.42.083.33%SCR
Industries1.92.0105.26%BeetleBob1.82.0111.11%AVERAGE:10
2.70%The rep's average efficiency is 102.70%. According to
this measure of her performance, she exceeds the efficiency
standard for performing routine maintenance.
6a.)Standard Time to Replace a Fender (hours):Actual Time
Taken to Replace a Fender
(hours):Efficiency2.54.062.50%Hourly Insurance Reimbursed
Rate:Standard Time to Replace a Fender (hours):Total $
Reimbursed LaborHourly Insurance Reimbursed
Rate:$502.5$125Hourly Labor Pay Rate:Actual Time Taken to
Replace a Fender (hours):Total $ Costs LaborHourly Labor Pay
Rate:$354.0$140No, Gibson's will not make money on the job.
They will lose $15.b.)Total $ Reimbursed LaborHourly Labor
Pay Rate:Time Required to Break Even Replacing a Fender
(hours):Hourly Labor Pay Rate:$125$353.57Standard Time to
Replace a Fender (hours):Time Required to Break Even
Replacing a Fender (hours):Efficiency Required to Break Even
Replacing a Fender:2.53.5770%
7TIME WAITING IN LINETIME HAVING EYES
TESTEDTIME HAVING PICTURE TAKENPERCENT VALUE-
ADDED TIME452310.0%The key assumption here is that time
spent wating offers no value. In other words, if a person could
enter the license bureau and immediately have his eyes checked
and picture taken, he could be out the door in 5 minutes.
8a.)RIDEAVERAGE WAITING TIMELENGTH OF
RIDETOTAL PROCESS TIMEPERCENT VALUE-ADDED
TIMEMagical Mushroom30104025.00%Haunted Roller
Coaster4054511.11%b.)RIDEAVERAGE WAITING
TIMELENGTH OF RIDETOTAL PROCESS TIMEPERCENT
VALUE-ADDED TIMEMagical
Mushroom30104025.00%Haunted Roller
Coaster055100.00%Total:30154533.33%
35. 9Process StepMinutesValue-Added?Dealer Faxes OrdernoPaper
Order CreatednoOrder Sits in Fax Inbox120noInternal Mail
Delivers Fax60noOrder Sits in Clerk's Inbox60noClerk
Processes Order5noWorker Picks Order20yesInspector Checks
Order2noTransport Firm Delivers Order120yesDealer Receives
OrdernoTotal Process Minutes:387Total Value-Added
Minutes:140Percent Value-Added Time:36.18%Answers can
vary, depending on how the student interprets "value-added."
For example, some students would argue that inspecting orders
is necessary to assure correct orders. Others would argue that if
the workers picked the order correctly, this wouldn't
10a.)Process StepMinutesValue-Added?Dealer Faxes
OrderyesPaper Order CreatedyesWorker Picks
Order20yesInspector Checks Order2noTransport Firm Delivers
Order120yesDealer Receives OrderyesTotal Process
Minutes:142Total Value-Added Minutes:140Percent Value-
Added Time:98.59%<--- NOTE: The percent value added will
automatically update as the "yes" and "no" in cells C2:C11 are
changed.b.)The impact on the number of lost orders would be
tremendous, as the only known lost orders in the previous
process occurred in the process before the order picking
activity. Customer satisfaction would increase dramatically as
the number of orders lost w
Dealer Faxes Order
Worker Picks Order
In Stock?
Clerk notifies dealer and passes order on to plant
Inspector Checks Order
Transport Firm Delivers Order
Dealer Receives Order
YES
NO
11Process StepMinimum Cycle Time (Seconds)Longest Cycle
Time (Seconds)Customer Places OrderAttendant Takes the
Order3040Attendant Gathers Food30120Attendant Takes the
Money3040Customer Receives FoodTotal Cycle Time:90200
36. Attendant Takes the Order
Customer Receives Food
Customer Places Order
Attendant Gathers and Bags the Order
Attendant Takes the Money
12Process StepMinimum Cycle Time (Seconds)Longest Cycle
Time (Seconds)Customer Places OrderAttendant Takes the
Order3040One Attendant Gathers Food While Other Attendant
Takes the Money30120Customer Receives FoodTotal Cycle
Time:60160Potential problems that could arise by splitting the
process across two individuals include introducing
communication issues that cause some orders to be wrong, space
constraints of two attendants working in the same space, and
lower utilization while one
Attendant (1) Takes the Order
Customer Receives Food
Customer Places Order
Attendant (2) Gathers and Bags the Order
Attendant (1) Takes the Money
13a.)Rework will occur in this process whenever a customer is
sent new forms to complete. This happens because whenever
the customer returns the forms, they must be checked again for
any issues. Delays in the process occur when the agent tries
over 2 days tob.)Recommended changes to the process would
include an online application process that would check the
application and not allow submission until all problems with the
form were corrected. Sales representatives could be available
for customers to call if th
Customer Mails in Completed Form
Any Issues
Customer is Advised of Final Decision
YES
NO
Agent Corrects Forms with Customer
(5 - 30 Minutes)
Need Initials
37. YES
NO
Customer is Mailed New Forms and Mails Them back
(5 - 7 Days)
Loan Officers Process Loan
(2 - 3 Days)
(3 - 5 Days)
Batch Waits for Monday
(0 - 5 Days)
Application
waits 1 to 2 days
CaseStudyQuestion 1.)The total time of the process is between 5
and 15 days for an order to be delivered. Only the production
time of 4 days is value added time. This percentage is between
80% and 26.6%. The remainder of the time consists of delays
while the order waits foQuestion 2.)Under the current process,
Ellison is not capable of consistently meeting the 10 day lead
time requirement of CMX.Question 3.)Defining the issue would
consist of mapping out the current process and defining exactly
what it is we are interested in -- consistently meeting CMX's
delivery leadtime requirement of 10 days or less. The
improvements would include changing the process t
Ed Stevens Receives and Acknowledges Order
Order is Delivered at CMX
CMX Submits Order
Rosemary Wilkins Receives Order and Schedules Production
Order Produced
(4 Days)
Order Waits for Meeting
(0 - 2 Days)
Order Waits for Monday
(2 - 4 Days)
Order Sits in Ed's Inbox
(0 - 1 Day)
Order Waits for Delivery
(1 - 5 Days)
38. I’m currently work at the bank and I was lucky to interview my
coworker Mr. Ortiz at work. He came from Africa, started
school in Carolina, and have been working at the bank for 20
years.
Interviewer: Hello, Mr. Ortiz, how are you and where are you
from?
Interviewee: I am good, and I came from Africa.
Interviewer: Mr. Ortiz, what can you remember about your
childhood?
Interviewee: I can remember several things, mostly the journey
that we took from Africa Egypt to this place. I cannot recall the
years better, but then I was very young.
Interviewer: Mr. Ortiz, where did you live, and where did you
go to school?
Interviewee I came here very young, and since in Africa, there
were no schools I started my school in Carolina, where I was
taken to a black school called St Mary. Here there were only
black kids and so here is where my life in school started.
Interviewer: What can you remember best about your parents?
Interviewee: my parents were perfect since they supported me
fully, especially when I started schooling. Other black parents
never took their kids to school since they complained a lot
about money, but my parents worked very hard and used their
little pay to support me.
Interviewer: What did you and your siblings do in your spare
time?
Interviewee: mostly in our free time me and my two brothers
spent time playing together and sometimes tried to learn English
since we talked in our mother language when we came.
Interviewer: Were you an obedient child or a mischievous
child?
39. Interviewee: I was very obedient both at home and even in
school. I had several prizes from school for better conduct
there. This extended everywhere since anyone above my age
could tell me to do something, and I did not look back.
Interviewer: what type of clothes did the children wear then?
Interviewee: most of the children just worn clothes like today,
but today there are extensions of what was done then. Fashion
only changes, but it was not so different from those years.
Interviewer: Did your family have any unique traditions, such
as things that they did on holidays or birthdays?
Interviewee: we celebrated our birthdays each time. My parents,
as I told you earlier, did work hard to make sure that we lived a
better life.
Interviewer: what about heirlooms? Is there anything handed to
you from generation to generation?
Interviewee: there are many things that our father kept on
reminding us, and that is the African culture back in Egypt. He
also told us to share with our kids, who could later pass it on.
Interviewer: When did you leave home?
Interviewee: I left home after I was through with high school
and left for higher education. I was amongst the best in our
district, and so I managed to join the University of Chicago, and
that was the only time I left home.
Interviewer: How did your life change? Did you feel grown-up?
Were you a little scared?
Interviewee: my life changed a lot, and so I knew that things
were going to be different. Apart from leaving home, I had
never left for any other state. I felt I had not fully grown to be
away from my family, but with time I managed it. I was so
scared since the school had many whites and since they were the
years of segregation I was scared much since I did not know.
Interviewer: what historical events have taken place during your
lifetime? The main historical event that took place was the
second world war and the cold war.
Interviewer: Do you know were there wars then, natural
disasters, or political changes?
40. Interviewee: Yes, my dad told me there was much war that was
going on by that time, most notably the second world war that
took place in the years of 1939-1945. Although the US was not
actively in the war, it received much pressure from the neighbor
countries as well as attacks. Natural disasters that were there
was spread of a particular disease that killed many people. I
cannot remember what the name was, but it killed many people
worldwide. There were political changes that took place where
activists urged for freedom and being given equal rights just as
the other races.
Interviewee: I was mainly affected by the black activists' work.
It made the whites to hate us. We received even more
segregation both from the government institutions and from the
public. Most of us in the universities felt it even more since we
were very few. Another problem was that African-Americans
also tortured people who came from Africa.
Interviewer: How old were you when you immigrated to the
United States?
Interviewee: I was very young back then. I was around ten years
old.
Interviewer: What were your parents do for a living? Did you
help them out?
Interviewee: my father worked in a small company that was
around the home. My mother had a small shop and a grocery.
Sometimes I could help her sell. This were the times that I was
free.
Interviewer: Was your family financially stable?
Interviewee: it was not stable when we were growing up since
my father did not earn a lot .and yet we spent a lot in school.
Interviewer: What was your first job? How old were you at that
time? How did you get that job?
Interviewee: my first job was working in a supermarket as a
cashier. By this time, I was 22 years, and I started working at
the bank when I was 23 years.
Interviewer: Have you thought about changing your job?
Interviewee: I haven’t thought about this question yet. If so, I
41. have to start my career again.
Interviewer: what different jobs have you had in your life?
Interviewee: I have done several jobs but mainly in
supermarkets. I worked as a cashier for the very first time then
worked as an accountant in another supermarket.
Interviewer: whom in your family do you resemble?
Interviewee: I exactly look like my mother.
Interviewer: did you know your grandparents?
Interviewee: I did not know any of my grandparents.
Interviewer: where did they live?
Interviewee: they lived in the southern part of Egypt.
Interviewer: what stories can you tell about them?
Interviewee: my father rarely talked about them, and so I knew
little about them. The thing I knew was that my grandfather was
a businessman and participated in the trans-Atlantic trade.
Interviewer: thank you very much for your time Mr. Ortiz.
Interviewee: You are welcome, thank you for your time too you
made me remember a lot.
Interviewee: thank you for the information I am sorry if there is
something you remembered and kind of was a pain to you.
Interviewee: no, I am fine.
Module Code
MAN00024M
Module
Operations and Project Management
Module Leader
Xiao Lin
Assessment
Open
42. Maximum Word Count
3000
Release Date
Week 2 Spring Term
Submission Date
11am Tuesday 28th April 2020
Weighting
100%
Important information
A penalty of FIVE marks will be deducted for late submissions
that are made up to and including the first hour of the deadline.
Submissions that are more than one hour late but within the first
24 hours of the deadline will incur a penalty of TEN marks.
After the first 24 hours have passed, 10 marks will be deducted
for every 24 hours (or part thereof) that the submission is late
for a total of 5 days. After 5 days it is treated as a non-
submission and given a mark of zero. The consequences of non-
submission are serious and can include de-registration from the
University.
If you are unable to complete your open assessment by the
submission date indicated above because of Exceptional
Circumstances you can apply for an extension. If unforeseeable
and exceptional circumstances do occur, you must seek support
and provide evidence as soon as possible at the time of the
occurrence. Applications must be made before the deadline to
be considered.
Full details of the Exceptional Circumstances Policy and claim
form can be found here:
https://www.york.ac.uk/students/studying/progress/exceptional-
circumstances
If you submit your open assessment on time but feel that your
43. performance has been affected by Exceptional Circumstances
you may submit an Exceptional Circumstances Affecting
Assessment claim form by 11am, Tuesday 28th April 2020. If
you do not submit by the deadline indicated without good
reason your claim will not be considered.
Please take proper precautions to safeguard your work and
remember to make backup copies of your data. The University
provides all its students with storage space on the University
server and you should save and back up any work in progress on
this server on a regular basis. Computer failure and theft of
your equipment or storage media are not considered exceptional
circumstances and extensions cannot be granted for work lost
for these reasons.
Word count requirements
The word count for this assignment is 3000 words.
You must state on the front of your assignment the number of
words used and this will be checked.
The main text for this assignment must be word-processed in
Arial, font 12, double spacing, minimum 2cm margins all
around.
You must observe the word count specified in this assignment
brief. The School has a policy of accepting variations to the
recommended word count of plus or minus 10%.
What does this mean for you?
Markers will mark your work up to the word count maximum
plus 10% and then will stop marking; therefore all words which
are in excess of the word count plus 10% will not be marked.
44. Where your word count is more than 10% below that specified,
it is likely that this will result in a lack of analytical depth or
relevant content, which will be reflected in the mark assigned.
What is in the word count?
The word count includes:
- the main text, including in-text reference citations and
quotations.
The word count does notinclude:
- Appendices.
These may be used to include supporting data, which may be too
detailed or complex to include as a Table. They are not a device
to incorporate material, which would otherwise cause you to
exceed the word limit.
- Title page
- Contents page
- Abstract/executive summary
- Tables, figures, legends
- Reference lists
- Acknowledgements
Margins:
2.54 all the way round – TOP, LEFT, BOTTOM and RIGHT.
Font:
Please use Arial, which is a plain, evenly spaced sans serif font.
Font size should be 12.
45. Headings and Emphasis:
Avoid underling and italics. Use bold instead.
AVOID TEXT IN CAPITAL LETTERS.
For headings, you can use a larger font size in bold, lower case.
Layout:
Use left-justified with ragged right edge.
Line spacing: single.
Use bullet points and numbering rather than continuous prose.
· Bullet point is set 1cm from margin. Text is 1cm from bullet
point.
Numbering format:
1. Tab 1cm.
a. Tab 1cm.
i. Tab 1cm.
Assignment Content
In this assignment, you are to write a research report of a
comparative study on the operation management practices of
two supermarkets, Sainsbury’s (Foss Bank, YO31 7JB) and
ASDA (77 Layerthorpe, YO31 7UZ). You will need to include
the following discussions in the report.
46. Remarks: You should visit both supermarkets to complete the
evaluation tasks.
You should include relevant literature to support
your arguments.
Task 1
What are the major differences in operation management
practices between these two supermarkets? You will need to
consider the key aspects of operation topics such as layout and
flow, process management (draw process mapping of one
selected product), inventory management, and lean management.
You only need to focus on two selected aspects in your
discussion.
[35 marks]
Task 2
Analyse and discuss the differences in operation strategies
between the two supermarkets, and how their operations
strategies influence the operation settings of both supermarkets.
[25 marks]
Task 3
The managers of both supermarkets would like to implement
quality management techniques to improve the operations.
Select one of the supermarkets (either Sainsbury’s or ASDA)
and discuss the feasibility and potential benefits of applying the
following quality management techniques. You only need to
focus on two selected quality management techniques in your
discussion.
47. · Gap analysis
· Statistical process control
· David Garvin’s 8 quality dimensions
· Fishbone
· 5 why’s
[40 marks]
THE YORK MANAGEMENT SCHOOL
Student number:
Module title:
Generic criteria
Module specific learning outcomes relevant to this assessment
G1
Argument
S1
Assess the impact of operations on competitiveness
G2
Structure
S2
Have a multi-disciplinary understanding of operations
management theories and models
G3
Use of sources
S3
Apply appropriate evaluation techniques/tools to analyse
operations management problems
48. G4
Referencing
S4
Propose relevant operations management practice(s) to improve
operations processes for a given business context, and justify its
appropriateness.
G5
Presentation
Comments on assessment criteria
Suggestions for improvement
Date:
Signature 1st marker
Initials 2nd marker
49. Page 5 of 7
Mark Matrix for Operations and Project Management 2019-2020
CRITERIA
WEIGHT
Fail <49%
50-59%
60-69%
≥70%
Achieved
Out of
Task 1
Understanding of the operations of the retail supermarket
/15
Description of the operation design is irrelevant.
50. A generic description of the operation design is provided, but
discussion of the strategic fit is lacked.
A clear description of the operation design is provided and the
strategic fit is explained.
A clear description of the operation design is provided, and a
critical review of the strategic fit is provided.
Understanding how characteristics of the operation affect the “5
performance objectives”
/20
Irrelevant characteristics /objectives.
Has a fair understanding of characteristics and general
discussion of the objectives.
Has a good understanding of the characteristics.
The linkages between characteristics and performance are well
argued and integrated but lacking in critical reflection.
Has an excellent understanding of the characteristics.
The linkages between characteristics and performance are well
argued and with critical reflection.
Task 2
Analyse and discuss the differences of operation settings in two
51. stores
/10
Irrelevant analysis or just analyse one of the store.
Generally discuss the differences of operation settings in both
stores, but lack of details.
Critically evaluate and clearly discuss the differences of
operation settings in both stores.
Critically evaluate and clearly discuss the differences of
operation settings in both stores with solid evidence support.
Analyse and discuss how their operations strategies influence
the operation settings
/15
Irrelevant analysis or just analyse one of the store.
Generally discuss how the operation strategy reflects on the
settings of operation.
Critically evaluate and clearly discuss how the operation
strategy reflects on the settings of operation.
Critically evaluate and clearly discuss how the operation
strategy reflects on the settings of operation with solid evidence
support.
Task 3
Evaluation of feasibility and potential benefits of adopting OM
techniques
52. /40
Irrelevant OM management techniques are suggested.
Evaluate the feasibility to adopt the selected OM management
techniques and discuss the benefits, but lack of supportive
arguments.
Critically evaluate the feasibility to adopt OM management
techniques, and discuss the benefits with supportive arguments.
Critically evaluate the feasibility, and the impact of adopting
OM techniques with supportive arguments. Show in-depth
understanding of the selected OM management techniques (e.g.
the mechanisms and the limitations).
Final Mark
/100
Provisional mark subject to approval by the Board by Examiners
Page 2 of 7