Varma's carbon footprint
•
0 likes•733 views

Varma has analysed the carbon footprint of its investments, specifically its listed equity and corporate bond investments, and its real estate investments. The calculation covers EUR 16 billion, i.e. 39% of Varma’s EUR 41.3 billion investment portfolio, and reflects the situation at the end of 2015.

Recommended
Recommended
More Related Content
What's hot
What's hot (20)
Similar to Varma's carbon footprint
Similar to Varma's carbon footprint (20)
More from Työeläkeyhtiö Varma
More from Työeläkeyhtiö Varma (20)
Recently uploaded
Recently uploaded (20)
Varma's carbon footprint
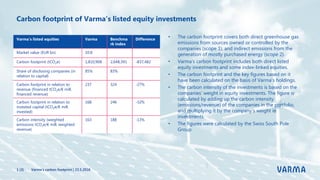
- 1. Carbon footprint of Varma’s listed equity investments Varma’s carbon footprint | 23.5.20161 (3) • The carbon footprint covers both direct greenhouse gas emissions from sources owned or controlled by the companies (scope 1), and indirect emissions from the generation of mostly purchased energy (scope 2). • Varma’s carbon footprint includes both direct listed equity investments and some index-linked equities. • The carbon footprint and the key figures based on it have been calculated on the basis of Varma’s holdings. • The carbon intensity of the investments is based on the companies’ weight in equity investments. The figure is calculated by adding up the carbon intensity (emissions/revenue) of the companies in the portfolio, and multiplying it by the company’s weight in investments. • The figures were calculated by the Swiss South Pole Group. Varma’s listed equities Varma Benchma rk index Difference Market value (EUR bn) 10.8 Carbon footprint (tCO2e) 1,810,908 2,648,391 -837,482 Share of disclosing companies (in relation to capital) 85% 83% Carbon footprint in relation to revenue (financed tCO2e/€ mill. financed revenue) 237 324 -27% Carbon footprint in relation to invested capital (tCO2e/€ mill. invested) 168 246 -32% Carbon intensity (weighted emissions tCO2e/€ mill. weighted revenue) 163 188 -13%
- 2. Carbon footprint of Varma’s listed corporate bond investments • The calculation covers direct listed corporate bond investments, some index-linked corporate bonds and some unlisted corporate bonds. • The carbon footprint covers both direct greenhouse gas emissions from sources owned or controlled by the companies (scope 1), and indirect emissions from the generation of mostly purchased energy (scope 2). • The calculation is an approximation, as there is no standard concerning the criteria for the allocation of emissions and the definition of debt. • In Varma’s carbon footprint calculation, the corporate bond owned by Varma is proportioned to the company’s overall debt, and the emissions are allocated to Varma on the basis of this proportion. • The carbon footprint figures are high in relation to equities, since the companies’ overall debt is usually smaller than the market value of the equities. Varma’s carbon footprint | 23.5.20162 (3) Varma’s listed corporate bonds Varma Benchmark index Differenc e Market value (EUR bn) 3.0 Carbon footprint (tCO2e) 2,576,104 3,363,833 -787,729 Share of disclosing companies (in relation to capital) 86% 72% Carbon footprint in relation to revenue (financed tCO2e/€ mill. financed revenue) 244 446 -45% Carbon footprint in relation to invested capital (tCO2e/€ mill. invested) 865 1,129 -23% Carbon intensity (weighted emissions tCO2e/€ mill. weighted revenue) 171 333 -49%
- 3. Carbon footprint of Varma’s direct real estate investments Varma’s carbon footprint | 23.5.20163 (3) Varma’s direct real estate investments Varma Market value of the real estate portfolio included in the calculation (EUR bn) 2.2 Flats’ share of the market value 29% Business premises’ share of the market value 71% Share of the market value of the sites included in the calculation of the entire direct real estate portfolio 66% Carbon footprint (tCO2) 58,050 Flats’ share of the carbon footprint 18% Business premises’ share of the carbon footprint 82% Carbon footprint in relation to gross square metres (CO2 kg/gross m2) 33.8 Carbon footprint of flats in relation to gross square metres (CO2 kg/gross m2) 27.2 Carbon footprint of business premises in relation to gross square metres (CO2 kg/gross m2) 35.6