
Recommended
Recommended
More Related Content
What's hot
What's hot (20)
Viewers also liked
Viewers also liked (20)
Similar to Groundwater remediation project
Similar to Groundwater remediation project (20)
More from Turlough Guerin
More from Turlough Guerin (20)
Groundwater remediation project
- 1. DESIGN, CONSTRUCTION AND OPERATION OF A FUNNEL AND GATE IN-SITU PERMEABLE REACTIVE BARRIER FOR REMEDIATION OF PETROLEUM HYDROCARBONS IN GROUNDWATER TERRY McGOVERN1 , TURLOUGH F. GUERIN2∗ , STUART HORNER1 and BRENT DAVEY3 1 SRS Australia Pty. Ltd., Environmental Consultants, Werribee, Victoria, Australia; 2 Shell Engineering, NSW State Office, P.O. Box 26, Rosehilly, New South Wales 2142, Australia; 3 Prpic Davey Consulting, Murrumbeena, Victoria, Australia (∗ author for correspondence, e-mail: turlough.guerin@shell.com.au, phone: 61-417-124453) (Received 27 November 2000; accepted 4 April 2001) Abstract. A white spirit spill at a factory site located in a residential area of south eastern Australia led to contamination of shallow groundwater that fed into a nearby river. The contaminated ground- water contained toluene, ethyl benzene, and xylene and n-alkanes in the C6 –C36 fraction range. A funnel and gate permeable reactive barrier was designed and built, based on preliminary pilot scale tests using peat as the medium for the gate and the work conducted is presented as a case study. The technical effectiveness of the funnel and gate, over the 10 month operating period in which data was collected, indicates that peat represents an effective material for use in the gate component of funnel and gate remedial systems. The application of the funnel and gate technology represented a substantial saving to the client and was effective in preventing ongoing pollution of the nearby river. The construction of the funnel and gate system also incurred the minimum disturbance to the public access areas between the facility and the river. Keywords: case study, dissolved phase, efficiency, groundwater, passive remediation, peat, per- meable barriers, petroleum hydrocarbons, remediation, sparging 1. Introduction Treatment walls, or permeable reactive barriers, first reported by McMurty and Elton (1985), involve construction of permanent, semi-permanent, or replaceable units across the flow path of a dissolved phase contaminant plume (Starr and Cherry, 1994; Vidic and Pohland, 1996). As the contaminated groundwater moves passively through the treatment wall, contaminants are removed by physical, chem- ical and/or biological processes, including precipitation, sorption, oxidation/reduc- tion, fixation, or degradation. These barriers may contain agents that are placed either in the path of contaminant plumes to prevent further migration or immedi- ately downgradient of the contaminant source to prevent plume formation (Vidic and Pohland, 1996). Water, Air, and Soil Pollution 136: 11–31, 2002. © 2002 Kluwer Academic Publishers. Printed in the Netherlands.
- 2. 12 T. McGOVERN ET AL. Several methods have been developed for the installation of permeable treat- ment walls (Eykholt and Sivavec, 1995; Steimle, 1995). The majority of experience with installation of these walls is with relatively shallow emplacements (<10 m) using standard geotechnical design and construction approaches, although a few technologies for deeper installations have been identified. In the simplest case, a trench of the appropriate width can be excavated to intercept the contaminated strata and backfilled with reactive material. This method would normally be limited to shallow depths in stable geologic materials. The major advantages of permeable treatment wall technology over other ground- water remediation approaches are the reduced operation and maintenance (O&M) costs and the enhanced technical efficacy, particularly compared with pump-and- treat approaches (Thomas and Ward, 1995; Clark et al., 1997). Other than ground- water monitoring, the major factor affecting O&M costs is the need for periodic removal of precipitates from reactive media or periodic replacement-rejuvenation of the affected sections of the permeable wall. The key issues associated with the design of a treatment wall include the selection of the reactive media (chemistry, particle size distribution, proportion and composition of admixtures), residence time in the reaction zone, and the reaction zone size for optimum life span, as well as the effect of the reaction zone medium on groundwater quality and the ultimate fate of a treatment wall, which may impact upon its disposal. Selection of the reactive media is based on the type (i.e., organic vs. inorganic) and concen- tration of groundwater contaminants to be treated, groundwater flow velocity and water quality parameters, and the available reaction mechanisms for the removal of contaminants (i.e., sorption, precipitation, and biodegradation). There are disadvantages in using permeable treatment wall technology. A criti- cism that the life expectancy of the reactive media in a treatment wall may degrade with time has been addressed by developing a construction approach whereby the reactive media is placed in the subsurface in removable cassettes (Day et al., 1999). Another criticism is the high capital costs in setting up such systems and the highly specificity of barrier wall materials towards particular contaminants. Typically, treatment wall system design is based on the results of treatability or effectiveness studies that can incorporate both batch reaction tests and laboratory- or field-scale column experiments (Rael et al., 1995). Batch tests are conducted to obtain initial measures of media reactivity (i.e. degradation half-life, sorption kinetics and capacity) that form the basis of the treatment wall design. Column tests are typically conducted by packing a vertical column with the reactive medium and passing the contaminated groundwater through the column until steady-state performance of the reactor is obtained. Flow velocities are adjusted to simulate groundwater velocity and reactor residence time. In addition, the impact of the treatment wall on groundwater quality can be assessed from these studies. The life span of sorption and precipitation barriers is limited by the ultimate capacity of the medium to facilitate appropriate removal reactions. Once the ultimate capacity of the medium is exhausted, contaminant breakthrough will occur, and this has
- 3. DESIGN, CONSTRUCTION AND OPERATION OF A FUNNEL AND GATE 13 previously been observed with peat used to remove dissolved and free phase and petroleum hydrocarbons from water (Stehmeier, 1989). In addition, contaminant release or resolubilisation may occur. The funnel and gate system is an application of a permeable reactive barrier for in situ treatment of dissolved phase contamination (Starr and Cherry, 1994). Such systems consist of low hydraulic conductivity cut-off walls (e.g. 1 × 10⁻⁶ cm s−1 ) with one or more gaps that contain permeable reaction zones. Cutoff walls (the funnel) modify flow patterns so that groundwater primarily flows through high conductivity gaps (the gates). The type of cutoff walls most likely to be used in cur- rent practice are slurry walls, sheet piles, or soil admixtures applied by soil mixing or jet grouting. At the current time there are relatively few published reports on the full-scale design and operation of funnel and gate systems and related systems for dissolved phase petroleum hydrocarbons (Bowles et al., 2000; Schad and Schulze, 2000) with even fewer reporting the use of peat (Kao and Wang, 2000). The current article presents the findings of a case study on the use of a funnel and gate system in Australia. 2. Background A white spirit petroleum hydrocarbon spill occurred at a factory facility in South Eastern Australia in December 1997. This volatile petroleum hydrocarbon was used routinely as a solvent at the facility (Table I). A leaking underground storage tank (UST) caused a quantity of the white spirit (∼2000–3000 L) to leak through the scoria fill material in which the UST was located, into the soil of the upper embankment at the rear of the facility. A quantity of the white spirit emerged at the base of the slope, discharging into a spoon drain, and then via a culvert, flowed into the nearby river. A proportion of the leaked white spirit was absorbed by the soil in the embankment and an amount entered the groundwater underlying the site (Figures 1 and 2). 3. Study Objective The aim of the remedial works conducted in this study was to intercept the dis- solved phase plume of petroleum hydrocarbons present in the shallow aquifer moving toward the river, using a funnel and gate permeable barrier, and reduce con- centrations to less than regulatory limits. A funnel and gate system was considered to be the most cost-effective way for treating petroleum hydrocarbon contaminated groundwater and preventing further contamination of the river. In the proposed re- mediation strategy, contaminated groundwater flow would be directed towards the gate which would then be subject to two treatment processes, applied in sequence, within the funnel and gate system. The processes applied were (1) air sparging, as
- 4. 14 T. McGOVERN ET AL. Figure 1. Plan of study area showing main facility area, location of spill area (dark shading), funnel and gate system and nearby river.
- 5. DESIGN, CONSTRUCTION AND OPERATION OF A FUNNEL AND GATE Figure 2. Transect through study area (refer to B–B on Figure 1). 15
- 6. 16 T. McGOVERN ET AL. TABLE I Composition of White Spirita Component Name % (v/v) C6 –C9 Benzene 0.07% Toluene 0.04% Ethyl benzene 1.10% Total xylene 20% Total C6 –C9 ∼23% C10 –C14 n-Alkanes 77% C15 –C28 n-Alkanes <1% C29 –C36 n-Alkanes <1% a CAS number is 8052-41-3. White spirit is a dry cleaning solvent, also known as mineral spirits or Stoddard solvent and is a colorless liquid with a kerosene-like odor. previously described (Pankow et al., 1993), and (2) absorption and biodegradation within a mixture of blended peats as previously highlighted (Cohen et al., 1991; Couillard, 1994). The development of the remediation strategy for the site and treatment of the contaminated groundwater after the white spirit spill is outlined in Table II. 4. Site Description and Methodology 4.1. S ITE LAYOUT AND GEOLOGY The area between the rear of the facility and the nearby river consists of a relatively steep (∼45◦ ) embankment, which is bisected by a cycle path of approximately 2 m width. A spoon drain runs parallel to the western side of the access track, terminating approximately 20 m north of the northern boundary of the site in a culvert, which runs under the cycle path and discharges directly to the nearby river. The facility occupies relatively level ground, exhibiting a lesser incline towards the river. On site structures consist of a large 2 storey building, the lower floor of which is used for hide tanning activities. A tank farm is located in the north eastern corner of the premises, consisting of four underground storage tanks, which are devoted to either fresh or used white spirit (Figure 1). The geology of the site consists of basement siltstones and sandstones of the upper Silurian Dargile Formation, the upper profile of which has weathered to a tan-orange mottled sandy clay. These sediments are visible in outcrops at several locations along the banks of the nearby river. Variably weathered lavas of the Qua- ternary Newer Basalts formation overlie the Silurian sediments in the eastern half
- 7. DESIGN, CONSTRUCTION AND OPERATION OF A FUNNEL AND GATE 17 TABLE II Development of the remediation strategy after the White Spirit spill Key activity Date Tasks Control and containment December 1997 Boom and sorbents placed in river to capture of spill spilled solvent leaving the site Removal of leaking tanks Initial characterization December 1997– Sampling of soil and groundwater of soil and groundwater February 1998 Developed model of contamination contamination and its at the site extent Selection of remediation March 1998 Selection of funnel and gate option strategy April 1998 Feasibility study to determine optimum configuration of peat Identified options for remediating petroleum hydrocarbon contaminated soil Implementation of March–May 1998 Installation of funnel and gate remediation strategy Remediation of contaminated soil excavated from the site Monitoring July 1998– Initial 10 month groundwater May 1999 sampling and analysis program was conducted to assess effectives of funnel and gate system Review of effectiveness March 1998– Soil remediation was validated by sampling of remediation strategy August 1998 and analysis of the recirculating air during bioventing, and sampling and analysis of the soil in the biovented piles for BTEX and n-alkanes September 2000– Three monthly groundwater sampling and Onwards analysis program is planned of the site, as identified in monitoring wells (MW) 9 and 10. Varying thicknesses of fill comprise the upper and lower embankments which is of a highly heterogeneous nature.
- 8. 18 T. McGOVERN ET AL. 4.2. S ITE HYDROGEOLOGY A highly localised, shallow perched water table is present in the fill material which comprises the embankment between the factory and the nearby river. The regional watertable is expected to be located at approximately the same depth as the level of the river. Residual clays from the weathered Silurian siltstones tend to be imper- meable, and as such perched water tends to be located at the fill-natural sandy clay interface. 4.3. AQUIFER TESTING Aquifer recovery tests were carried out on monitoring wells MW1, MW2, MW3, MW4, MW5, MW6, MW7, and MW8 on 20 November 1998. The procedure involved the removal of a known volume of groundwater from the well and mon- itoring the subsequent recovery with time. The hydraulic properties of the fill material were investigated (by slug test) to determine the hydraulic conductivity of this material. The Hvorslev method (Fetter, 1988) was used to calculate the hydraulic conductivity in the immediate proximity to each well tested. 4.4. C ONSTRUCTION OF FUNNEL AND GATE SYSTEM A volume of ∼1600 m3 of petroleum hydrocarbon contaminated soil was excavated as part of establishing the funnel and gate system. This was placed in 3 biovented piles at the facility (refer to biobanks in Figure 1). Details of the remediation of this soil are not given in this report. The funnel and gate system was comprised of an impervious barrier membrane (i.e. the funnel), directing groundwater into the treat- ment area (i.e. the gate). The gate consisted of a sparging unit upgradient of a blend of peat materials. The funnel component, designed to intercept the contaminant plume before it entered the nearby river, consisted of a 0.75 mm thick High- Density Polyethylene (HDPE) impervious barrier membrane positioned vertically in the cut-off trench to capture and redirect incident groundwater over the length of the spill area, parallel to the nearby river. The gate was composed of sequential treatment systems comprising a sparging unit emplaced in basaltic scoria, followed by blended peat materials. The funnel was designed to intercept groundwater flow from areas directly downgradient of the spill site, as well as adjacent areas in which lateral migration of the plume may be occurring. The dimensions of the funnel trench are 27 m long × 5 m deep × 0.6 m wide, excavated to a level of 0.5 m below the fill-natural siltstone interface. 4.4.1. Gate Construction A stepwise procedure was undertaken so as to ensure the final integrity of the gate and prevent the collapse of the riverbank. This was achieved in the following manner. Chain mesh fencing (2 m × 15 m long section) was laid flat along the river-embankment interface and fastened to the ground using 1.5 m long steel star
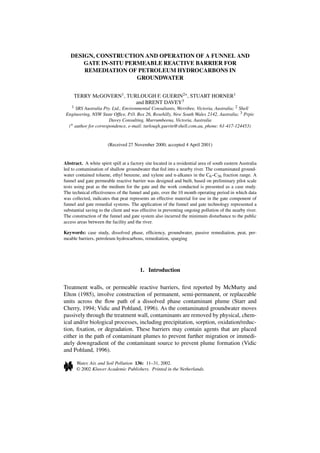
- 9. DESIGN, CONSTRUCTION AND OPERATION OF A FUNNEL AND GATE 19 Figure 3. Transect through the funnel and gate system (as built) (refer to Section A–A, Figure 2). pickets to aid long term stability. Sheet piling was inserted into the embankment parallel to the river bank, at a distance of approximately 4.0 m from the river, dividing the areas to be excavated for both components of the gate system. The area designated for the peat (between the river bank and the sheet piling) was excavated to a depth of 0.5 m below the siltstone-fill interface, and infilled with peat to a depth of 0.5 m below surface. The remaining volume was filled with natural soil overlying a layer of A15 Type Bidim Geofabric to prevent fine soil particles mixing with and clogging the peat and scoria filtration media. The area was then sown with grass seed in order to promote bank stability. Excavated soil was removed for bioventing. Subsequent to the emplacement of the peat, soil adjacent to the opposite side of the sheet piling was excavated to a depth of 0.5 m below the fill-natural siltstone strata interface, and a horizontal sparging tube and scoria was emplaced. Thirty cubic meters of peat (on a wet volume basis of estimated at 40% moisture) was used in the gate. 4.4.2. Sparging Component of Gate The section of the gate that initially encounters influent groundwater consists of a volume (∼5 m3 ) of porous basaltic scoria. The scoria was emplaced over a sub- merged, perforated air sparging pipe, creating fine air bubbles, which permeate the water column within the gate, delivering oxygen to enhance biodegradation. Air was supplied to the system by a 12-cfm compressor, supplying air at 0.9 m3 hr−1 . Soil gas and air concentrations of petroleum hydrocarbons were monitored at the site using a Foxboro TVA 1000A Flame Ionization Detector (FID) and a Photo- Ionization Detector (PID) unit. A transect diagram through the gate is given in Figure 3.
- 10. 20 T. McGOVERN ET AL. 4.4.3. Peat Composition and Implications for Contaminant Remediation After the groundwater was sparged (as it passed through the scoria as described above), the groundwater then passed through a peat mixture, immediately down- gradient of the sparging system. Previous studies indicate the high sorptive ca- pacities of humic materials (such as peat) for petroleum hydrocarbons (Kao and Borden, 1997). Peats with low fibre contents and high lignin pyrolysis material and ash content have been shown to be the most effective peats to remove free and dissolved phase petroleum hydrocarbons from groundwater (Cohen et al., 1991). The ability to both adsorb dissolved and free phase petroleum hydrocarbons from groundwater, and provide a catalytic surface on which microbial activity can occur, indicated the suitability of peat for use in groundwater treatment (Cohen et al., 1991). Cohen et al., (1991) have indicated that a wide range of peats is effective in removal of petroleum hydrocarbon contamination from water, with rates of re- moval efficiency between 63 and 97%. Using this information, a locally available peat, known commercially as Biogreen Humic Reed Sedge, with low fibre and high humic content was selected for use onsite. 4.4.4. Peat Blending and Implications for Hydraulic Conductivity An important consideration in the design and construction of funnel and gate sys- tems is that the treatment media be of an equal or greater hydraulic conductiv- ity than that of the surrounding substrate, to allow incident groundwater to be channeled through the treatment aperture. This is particularly important as pre- vious studies have shown that the variability of the saturated hydraulic conduct- ivity of peat can be as high as 10 orders of magnitude, depending on the type of peat. Accordingly, hydraulic conductivity tests were performed on a variety of peat/sphagnum peat/cocoa fibre blends, in order that an optimal mixture, with respect to sorptive capacity, air circulation and hydraulic conductivity, be achieved. Tests were conducted using the ‘falling head test’ method (Schwartz and Domen- ico, 1997). Equipment consisted of a column of packed, saturated peat. The fall in hydraulic head over time (K) was measured from a manometer tube, and substi- tuted in the following equation: K = 2.3(aL/A(t1 − t0 )) log10 h0 / h1 , where a = cross sectional area of the stand pipe, L = length of sample, A = cross sectional area of sample tube, (t1 − t0 ) = elapsed time required for a head fall from h1 to h0 , h0 = starting height of water in the manometer tube, h1 = end height of water in the manometer tube.
- 11. DESIGN, CONSTRUCTION AND OPERATION OF A FUNNEL AND GATE 21 A blend of 70% peat (Biogreen Humic Reed Sedge), 20% sphagnum peat and 10% cocoa fibre was selected for use. This mix contained the maximum percentage of the peat with the highest sorptive capacity (Biogreen Humic Reed Sedge), without reducing the hydraulic conductivity to below that encountered in the surrounding fill materials. 5. Monitoring Well Installation, Sampling and Analysis Effective funnel and gate design ensures sufficient residence time of contaminants within the treatment zone as well as downgradient substrata permeability, which prevents contaminated water from ‘banking up’ and circumventing the funnel and gate. Testing of the funnel and gate was achieved via two groundwater monitoring wells, one emplaced immediately upgradient of the gate, and another downgradient of the gate area infilled with peat. By comparing influent and effluent concentra- tions of n-alkanes and BTEX compounds, it has been possible to determine the effectiveness of the funnel and gate system for removing dissolved phase petro- leum hydrocarbon contamination. The monitoring system was set up such that any break-throughs of petroleum hydrocarbons (through the gate) could be detected. Furthermore the bores at the site were arranged so that any petroleum hydrocarbons escaping the gate (by going around the funnel) would be detected. A total of 14 monitoring wells were installed at the site. All monitoring wells were fully screened from the watertable to the end of the boreholes. Since the estab- lishment of the monitoring network in May 1998, the wells have been sampled on a fortnightly basis for a period of 5 months, followed by a less intensive sampling re- gime up to September 2000, as agreed to by the local regulatory authorities. Stand- ing water levels were measured prior to well purging and sampling on all occasions. All groundwater samples were analysed for n-alkanes (by GC-FID method, US EPA 8021B), and BTEX using the purge and trap method (US EPA Method 5030). All soil and groundwater samples were collected in Teflon (PTFE)-lined screw cap glass jars and keep on ice in coolers (∼4 ◦ C) and sent for analysis within 24 hr of collection. Recoveries for spiked n-alkanes varied from 75–100% in groundwater samples. Recoveries for BTEX were 85–100% in groundwater samples. Laborat- ory duplicates reported variation for n-alkane fractions and BTEX of 5–25% in groundwater samples.
- 12. 22 T. McGOVERN ET AL. TABLE III Volumetric budget summary for the steady state calibration simulation Flux Description/origin Volume (L day−1 ) Into model Recharge 76 Bank seepage 3539 Out of model Constant heads (river-seepage) 3591 % Discrepancy 0.65 6. Results and Discussion 6.1. WATER TABLE LEVEL AND HYDRAULIC CONDUCTIVITY TESTS The water table configuration remained relatively constant throughout the monit- oring period. The groundwater flow lines were observed to flow toward the east, approximately perpendicular to the bank of the river. Figure 4 illustrates the config- uration of the water table (m AHD) on 7 October 1998. Variations in the water table were observed with monitoring wells MW1, MW2, and MW3 illustrating similar temporal changes. These wells are furthest from the nearby river, located at the base of the slope. Closer to the river the water table variation is significantly less, indicating that the water table close to the river is being controlled by the water level in the river itself. Those wells located furthest from the river were expected to reflect rainfall (recharge) water table response relationships. As expected, the wells nearest the slope fluctuate the most in response to rainfall events, suggesting recharge is occurring from the slope to the west, most likely as interface drainage. The results of the subsurface conductivity tests are presented in Table IV. As expected the material was found to have extremely variable hydraulic properties. Measurement of the conductivity of the fill material was in some instances erro- neous as the well screens extended through two lithologies, the clay overlying the siltstone and the fill material itself. The large variability of the fill material suggests that the majority of groundwater and contaminant migration through this material will be occurring along preferential flow paths. This is likely to result in faster migration times and a larger spread of the plume.
- 13. DESIGN, CONSTRUCTION AND OPERATION OF A FUNNEL AND GATE 23 Figure 4. Measured and interpolated piezometric surface on 7 October 1998 (units in m). 6.2. E STIMATES OF GROUNDWATER VOLUMES AND PETROLEUM HYDROCARBON MASS ENTERING FUNNEL AND GATE SYSTEM From modelling conducted, the concentrations of ethyl benzene and xylene in the groundwater discharging to the river (ignoring mixing zones) would exceed the relevant criteria, 250 and 620 µg L−1 , respectively, within 6–12 months and would continue to exceed these criteria for a period in excess of 6 yr. The modelling estimated that the width of the discharge face (capture zone) was estimated at ∼20 m.
- 14. 24 T. McGOVERN ET AL. TABLE IV Measured hydraulic conductivity of subsurface Monitoring well Values (m day−1 ) MW01 0.18 MW02 1.63 × 10⁻⁸ MW03 1.26 × 10⁻⁵ MW04 0.0001 MW05 0.0046 MW06 0.0001 MW07 0.025 MW08 0.68 The maximum concentrations of n-alkanes and the total of benzene, toluene, ethyl benzene and xylenes (BTEX) present in groundwater from bore wells across the site were 1000 and 25 mg L−1 , respectively. These values were reported between December 1997 and December 1998. The average concentration of n-alkanes in groundwater over the period from December 1997 to August 1999, was 26 mg L−1 of n-alkanes, and the value for BTEX was considerably lower at <0.05 mg L−1 . The predicted amount of petro- leum hydrocarbons likely to be intercepted by the proposed funnel and gate system are conservative estimates designed to encompass the worst case scenario. Based on a median hydraulic conductivity of 0.4 m day−1 (estimated from the site data), the median volume of groundwater entering the gate was estimated to be ∼6 m3 day−1 . The maximum volume of water entering the gate, based on a conservative estimate, was expected to be ∼43 m3 day−1 . Assuming the average concentration of petroleum hydrocarbons in groundwater was 26 mg L−1 , the maximum mass of petroleum hydrocarbons entering the funnel and gate was calculated to be 1.1 kg day−1 , and a median value of 160 g day−1 . Assuming a median removal capacity of 20 kg t−1 peat (dry weight basis), as determined from previous studies with a range of peats tested for absorbing mono aromatic hydrocarbons (Cohen et al., 1991), it was expected that the petroleum hydrocarbons in the groundwater entering into the funnel and gate (i.e. 1.1 kg day−1 ), would be treated by the system (as designed) for up to ∼210 days before break through of petroleum hydrocarbons. This period would be longer at 1448 days, assuming 160 g day−1 of petroleum hydrocarbons in the influent, entering the gate. These estimates, derived from Cohen et al. (1991), are conservative because they do not take into account a highly active microbial population which would
- 15. DESIGN, CONSTRUCTION AND OPERATION OF A FUNNEL AND GATE 25 be contributing to the apparent absorption (i.e. removal) process in the gate at the current site. Previous studies have shown that such microbial populations are readily established in peat when oil is added (Jack et al., 1994). These estimates do, however, provide some indication of the size and design of the gate required for removing the dissolved phase petroleum hydrocarbons. At 306 days, the overall performance of the funnel and gate has been satisfactory. Further monitoring will reveal the effectiveness of the design (see Implications section of this article). 6.3. P ETROLEUM HYDROCARBON REMOVAL EFFICIENCIES Initial contaminant concentrations determined from samples collected on 1 July 1999, i.e day ‘zero’, in the well upgradient of the funnel and gate (referred to as MW 13) were equivalent to those downgradient (of the funnel and gate treatment) (referred to as MW 14) (Table V). The expected decrease of n-alkanes and toluene, ethyl benzene, and xylene concentrations across the funnel and gate system was not apparent in this initial round of sampling and analysis. No benzene was detected in either MW 13 or MW 14 over the 10 month monitoring period. Subsequent monitoring from groundwater monitoring wells MW 13 and MW 14, conducted over the following 10 month period that has been reported, indicated a substantial and consistent reduction of petroleum hydrocarbon contaminants in the ground- water due to passage through the funnel and gate system. Concentrations of both n-alkanes and toluene, ethyl benzene, and xylene, have substantially decreased in concentration between MW 13 (upgradient) and MW 14 (downgradient) of the funnel and gate. The removal efficiencies for the as-built funnel and gate system varied from 63 to 96% for the monoaromatic hydrocarbons, toluene, ethyl benzene, and xy- lene. Removal efficiencies for C6 –C9 , C10 –C14 , and C15 –C28 n-alkane fractions were 69.7, 81.1 and 67.2%, respectively. The lowest removal efficiencies were for the C29 –C36 n-alkane fraction at 54%. The overall efficiency for the funnel and gate system was 72% during the 10 month period over which data was collected (Table VI). Removal efficiencies tended to decrease at 188 and 306 days with respect to toluene, ethyl benzene, and xylene and the C6 –C9 n-alkane fraction. Further sampling and analysis in the future will ascertain whether this represents a trend in decreasing performance of the funnel and gate. The apparent increase in concentrations of both the n-alkanes and toluene, ethyl benzene and xylenes in the upgradient well at day 245 correlate with a preceding heavy rain in days before the samples were taken at that monitoring time. Previous studies have shown that peats from various sources can remove 63– 97% dissolved phase benzene, toluene, and xylenes from contaminated ground- water in laboratory studies and this data was used in the selection of peat for the current study (Cohen et al., 1991), and the same range has been obtained in the current study. Kao and Borden (1997), reporting efficiencies of BTEX removal from laboratory groundwater undergoing remediation with a briquet-peat barrier
- 16. 26 TABLE V BTEX groundwater monitoring data from upgradient and downgradient of dissolved phase plume (µg L−1 ) Days Toluene Ethyl benzene Xylene C6 –C9 C10 –C14 C15 –C28 C29 –C36 UG DG UG DGa UGb DG UG DG UG DG UG DG UG DG 0 1 1 6 280 990 250 410 1100 370 100 190 10 120 150 8 1 1 15 310 2600 110 2900 50 100 200 100 4 63 17 34 1 1 18 530 7400 60 2200 2300 950 1900 710 4 120 32 41 44 2 1 320 1900 130 780 560 440 100 100 1 170 62 48 310 3 1 170 3100 80 3500 400 100 320 100 2 151 26 58 40 2 1 780 3200 110 6600 340 630 50 80 3 9 1 153 15 1 1 230 2000 60 580 150 500 180 120 1 38 16 188 2 1 1 20 2400 20 750 780 480 100 100 2 2 16 215 17 1 1 270 2700 30 3500 270 410 140 0 1 <1 <1 T. McGOVERN ET AL. 245 1 1 110 940 2800 270 3000 440 510 150 120 16 840 250 274 1 1 1 340 1400 30 1700 530 730 150 0 1 75 11 306 1 1 5 100 2200 80 3100 410 740 100 100 6 10 18 Mean 36.2 1.3 13.4 358 2724 110 2418 611 497 308 143 4.3 145 54.5 U95 % C.I. 50.7 1.6 16 773 3642 173 4397 1176 823 416 164 5.5 388 65.3 a Referring to upgradient bore (Bore MW 13). b Referring to down gradient (Bore MW 14).
- 17. TABLE VI Efficiency of the funnel and gate system Statistic Toluene Ethyl Xylene C6 –C9 b C10 –C14 b C15 –C28 b C29 –C36 b Overall benzene efficiency (%)c Upper 95% C.I. 96.9 65.4 83.2 77.6 67.7 81.3 60.5 76.1 Average 96.3 68.3 62.5 69.2 77.6 79.5 53.5 72.4 Modal average 95.4 64.1 75.0 69.7 81.1 67.2 61.8 73.5 a Not detected. b n-Alkanes. c Efficiency (%) of removal = (contaminant in groundwater in downgradient well)/(contaminant groundwater in upgradient well) × 100. DESIGN, CONSTRUCTION AND OPERATION OF A FUNNEL AND GATE 27
- 18. 28 T. McGOVERN ET AL. system, stated values of 86, 71, 43 and 28% for toluene, ethylbenzene, m-xylene and o-xylene, respectively. The removal efficiencies reported in the current field study were therefore considerably higher than those reported in previous laboratory studies. In another laboratory study, a peat column decreased petroleum hydro- carbon concentrations in an oily water mixture by 100 fold at 30 000–70 000 mg L−1 (Stehmeier, 1989). However, with a much lower dissolved phase concentration of 5 mg L−1 , the peat column was ineffective at removing the petroleum hydro- carbons (Stehmeier, 1989). The literature values therefore vary considerably for petroleum hydrocarbon removal effectiveness. These previous studies reinforce the importance of testing local peat types prior to deploying peat at full-scale. The downgradient monitoring well reported concentrations of toluene, ethyl benzene, and xylene and n-alkanes in the range C6 –C36 below the surface water guidelines for these pollutants demonstrating that the funnel and gate system is also meeting the regulatory requirements, for the shallow groundwater entering the river (Table VII; see row with SEPP values). All the guideline values that were reviewed were met with respect to the specific contaminants of concern in the groundwater from the site. The remediation will be considered completed when the downgradient effluent is consistently reporting toluene, ethyl benzene, and xylene and n-alkanes in the range C6 –C36 below the surface water guidelines, over a period of approximately 1 yr (with quarterly reporting). 7. Implications This case study has described the effectiveness of an application of the funnel and gate technology at a contaminated site in South Eastern Australia. The implications from the success of the funnel and gate permeable barrier reported in the current study are: 1. Technical effectiveness. The technical effectiveness of the funnel and gate, over the 10 month operating period in which data was collected, indicates that peat represents an effective material for use in the gate component of funnel and gate remedial systems. Though efficiencies were not high for all contaminants, further ongoing monitoring will allow more definite conclusions to be drawn regarding the selective degradation capacities of the peat for each of the con- taminants tested. The use of sparging apparatus at the base of the gate would have contributed to the technical effectiveness of the funnel and gate system. 2. Cost effectiveness. The costs incurred for this project were ∼71 500 USD (equiv- alent to ∼130 000 AUD) which included the construction of the funnel and gate system and bioremediation of the contaminated soil. Alternatively, the costs of treating the groundwater by a pump and treat method were estimated at ∼USD 83 500 or 160 000 AUD (capital costs) and ∼USD 0.2 m−3 (∼5500 USD or ∼10 000 AUD) for annual operational costs and a total cost of ∼95 000 USD
- 19. DESIGN, CONSTRUCTION AND OPERATION OF A FUNNEL AND GATE 29 TABLE VII Summary of investigation levels of contaminants in surface waters (µg L−1 ) Beneficial use Benzene Toluene Ethyl Xylene C6 –C9 C10 –C14 benzene Production of edible 120a , 140b 250 250 380b – – fish and crustaceaa Recreation 470c – – – 10000d 10000d Aesthetic objectives – – – – 10000d 10000d SEPP groundwater – 250 250 – – – qualityg Protection of aquatic 300 300 140 380 –e –e ecosystems Groundwater ingestion – 5 1000 700 10000 –f –f residentialf Freshwater aquatic 300 300 – – – – ecosystemsh a US Code of Federal Register (Anonymous, 1994a). b Dutch guidelines (RIVM, 1994). c US Code of Federal Register (Anonymous, 1994b). d Historical Australian and New Zealand guidelines (ANZECC, 1992). e A dash indicates that ‘Information needed to select threshold concentrations is incomplete’. This document states that the NSW Clean Waters Act (1970) and Clean Waters Regulations (1972) require licenced discharges to be visually free of oil and grease (∼10 000 µg L−1 ) (Anonymous, 1994c). f ASTM look up tables (ASTM, 1995). g SEPP or State Environmental Protection Policy is the legal instrument by which the en- vironmental regulators in the State of Victoria (Australia) can enforce clean up targets (refer http://www.epa.vic.gov.au/wp/wp_sepp.htm). h These are the current Australian groundwater quality guidelines and are not enforceable targets per se (NEPC, 1999). (170 000 AUD). The application of the funnel and gate technology therefore represented a substantial saving to the client and was effective in prevent- ing ongoing pollution of the nearby river. The construction of the funnel and gate system also incurred the minimum disturbance to the public access areas between the facility and the river. 3. Further research. Ongoing technical effectiveness of the funnel and gate bar- rier will be conducted over the longer term, by monitoring at 3 month intervals to ensure continued effectiveness of the funnel and gate system. This is import- ant as previous laboratory studies have shown that BTEX removal efficiencies
- 20. 30 T. McGOVERN ET AL. decrease with time (Stehmeier, 1989; Cohen et al., 1991). The key areas re- commended for further research are as follows: • Determining the effect of peat on the quality of the groundwater could also be checked to ensure that there are no deleterious effects of the peat on the effluent groundwater. • Further research could be conducted to determine the mechanisms by which the petroleum hydrocarbons are removed from the groundwater and to monitor any deleterious effects on removal efficiencies from any potential increase in the biomass associated with any microbial growth in the peat within the gate. • The bulk density of peat has also previously been shown to influence the effectiveness of petroleum hydrocarbon removal from water (Stehmeier, 1989) and further research could be conducted to optimise this effect for full-scale studies. • Disposal of peat after the project is completed. Testing of the peat from the gate should be conducted at completion of remediation. This should be designed to determine if the petroleum hydrocarbons are irreversibly or reversibly bound to the peat, and to determine any risks associated with the used peat. This will have implications for disposal options. References Anonymous: 1994a, ‘Water Quality Criteria: Human Health Partial Body Contact’, U.S. Govern- ment. Anonymous: 1994b, ‘Water Quality Criteria Human Health Fish Consumption’, U.S. Government. Anonymous: 1994c, ‘Guidelines for Assessing Service Station Sites’, Sydney, NSW, Australia, NSW EPA, 31 pp. ANZECC: 1992, Australian Water Quality Guidelines for Fresh and Marine Waters, Summary of Water Quality Guidelines for Recreational Waters, Australian New Zealand Environment Conservation Council and National Health and Medical Research Council. ASTM: 1995, ‘Guide for Risk Based Corrective Action Applied at Petroleum Release Sites’, West Conshohocksen, PA, ASTM Committee E50 on Environmental Assessment, 51 pp. Bowles, M. W., Bently, L. R, Hoyne, B. and Thomas, D. A.: 2000, ‘In situ ground water remediation using the trench and gate system’, Ground Water 38, 172–181. Clark, D. K., Darling, D. F., Hineline, T. L. and Hayden, P. H.: 1997, Field Trial of the Biowall Tech- nology at a Former Manufactured Gas Plant Site. 29th Mid-Atlantic Industrial and Hazardous Waste Conference, Presentation by Stearns and Wheler, LLC, Cazenovia, NY, U.S.A. Cohen, A. D., Rollings, M. S., Zunic, W. M. and Durig, J. D.: 1991, ‘Effects of chemical and phys- ical differences in peats on their ability to extract hydrocarbons from water’, Water Resources Research 25, 1047–1060. Couillard, D.: 1994, ‘The use of peat in wastewater treatment’ Water Research 28, 1261–1274. Day, S. R., O’Hannesin and Marsden, L.: 1999, ‘Geotechnical techniques for the construction of reactive barriers, J. Hazard. Mat. B, 285–297. Eykholt, G. R. and Sivavec, T. M.: 1995, Contaminant Transport Issues for Reactive-Permeable Barriers, New York, NY, ASCE, pp. 1608–1621.
- 21. DESIGN, CONSTRUCTION AND OPERATION OF A FUNNEL AND GATE 31 Fetter, C. W.: 1988, Applied Hydrology, Oshkosh, Wisconsin, Merill Publishing Company, 592 pp. Jack, T. R., Francis, M. M. and Stehmeier, L. G.: 1994, ‘Disposal of slop oil and sludges by biodegradation’, Res. Microbiol. 145, 49–52. Kao, C. M. and Borden, R. C.: 1997, ‘Enhanced TEX biodegradation in nutrient briquet-peat barrier system’, J. Environ. Engin. (New York) 123, 18–24. Kao, C. M. and Wang, C. C.: 2000, ‘Control of BTEX migration by intrinsic bioremediation at a gasoline spill site’, Water Res. 34, 3413–3423. McMurty, D. C. and Elton, R. O.: 1985, ‘New approach to in situ treatment of contaminated groundwaters’, Environ. Progr. 4, 168–170. NEPC: 1999, National Environmental Protection Measure – Schedule B, (1) Guidelines on the Invest- igations Levels for Soil and Groundwater, Adelaide, Australia, NEPC (National Environmental Protection Council), 11 pp. Pankow, J., Johnson, R. L. and Cherry, J. A.: 1993, ‘Air sparging in gate wells in cutoff walls and trenches for control of plumes of volatile organic compounds (VOCs)’, Ground Water 31, 654– 663. Rael, J., Shelton, S. and Dayaye, R.: 1995, ‘Permeable barriers to remove benzene: Candidate media evaluation’, J. Environ. Engin. 121, 411–415. RIVM: 1994, Environmental Quality Objectives in The Netherlands – A Review of Environmental Quality Objectives and Their Policy Frame Work in The Netherlands, Amsterdam, RIVM (Risk Assessment and Environmental Quality Division, Directorate for Chemicals, External Safety and Radiation Protection, Ministry of Housing, Spatial Planning and Environment, The Netherlands). Schad, H. and Schulze, B.: 2000, Funnel and Gate at a Former Manufactured Gas Plant Site in Karlesruhe, Germany: Design and Construction. Remediation of Chlorinated and Recalcitrant Compounds – Chemical Oxidation and Reactive Barriers, Monterey, California, Battelle Press, pp. 315–322. Schwartz, F. A. and Domenico, P. A.: 1997, Physical and Chemical Hydrogeology, New York, NY, John Wiley & Sons, 640 pp. Starr, R. C. and Cherry, J.: 1994, ‘In situ remediation of contaminated groundwater: The funnel and gate system’, Ground Water 32, 465–476. Stehmeier, L. G.: 1989, Development of an Oclanosorb (TM) (peat) Filter for Separating Hydrocar- bons from Bilge Water, Calgary, CA, Nova Husky Research Corporation, 12 pp. Steimle, R.: 1995, In Situ Remediation Technology Status Report: Treatment Walls, Washington, DC, US EPA, 31 pp. Thomas, J. M. and Ward, C. H.: 1995, Ground Water for Bioremediation, New York, NY, Geotechnical Special Publication, ASCE, pp. 1456–1466. Vidic, R. D. and Pohland, F. G.: 1996, Treatment Walls, Pittsburgh, PA, Ground Water Remediation Technologies Analysis Center, 38 pp.