Microstructure Informatics
•Download as PPTX, PDF•
2 likes•1,179 views

Presentation given for the Structural Materials Seminar in the Materials Department at University of California Santa Barbara on December 7, 2012

Recommended
More Related Content
What's hot
What's hot (14)
Viewers also liked
Viewers also liked (20)
More from Tony Fast
More from Tony Fast (11)
Microstructure Informatics
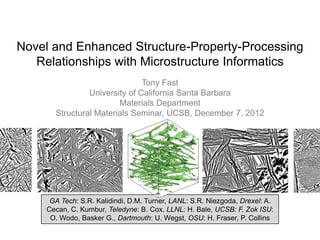
- 1. Novel and Enhanced Structure-Property-Processing Relationships with Microstructure Informatics Tony Fast University of California Santa Barbara Materials Department Structural Materials Seminar, UCSB, December 7, 2012 GA Tech: S.R. Kalidindi, D.M. Turner, LANL: S.R. Niezgoda, Drexel: A. Cecan, C. Kumbur, Teledyne: B. Cox, LLNL: H. Bale, UCSB: F. Zok ISU: O. Wodo, Basker G., Dartmouth: U. Wegst, OSU: H. Fraser, P. Collins
- 2. Materials Genome Initiative for Global Competitiveness DIGITAL DATA Informatics • Data Transparency • Data Sharing • Data Transfer • Data Retrieval • Data Analysis “Advanced data-sharing techniques at all stages of the development continuum will be the driving force behind the Initiative and help build the scholarly record.” Materials Genome Initiative for Global Competitiveness, June 2011.
- 3. From Materials Selection to Microstructure (μS) Informatics… Materials selection relies on effective material descriptors. H. Fraser, OSU. U. Wegst, Dartmouth H. Bale, LLNL • Advances in characterization and computational materials science are contributing to the materials data deluge.
- 4. μInformatics workflow is a system A robust paradigm to address dimensionality challenges in materials science Future Work Each module is self-contained μInformatics is material and hierarchy independent statistical framework aimed to distill rich physical data into tractable forms that facilitate structural taxonomies and bi-direction structure-property-processing homogenization and localization relationships. It provides a foundation for rigorous microstructure sensitive materials design.
- 5. Image Segmenting extracts important features of the μS A necessary evil in data-driven materials science Virtual Metallic Image Segmentation uses image processing and DSP methods to minimize the human interaction necessary to analyze digital images. Most problems are subjective and ill-posed. Aluminum in Epoxy Hough transform Methods Raw Segmented (EM/MPM) @ bluequartz.net Kalidindi, S.R., S.R. Niezgoda, and A.A. Salem, Microstructure informatics using Ceramic Matrix Composite higher-order statistics and efficient data-mining protocols. JOM, 2011. 63(4): p. 34-41.
- 6. The primitive basis converts any μS to a digital signal Informatics benefit from a generalized higher-order microstructure description H H Primitive Basis Function h h h h Salient Descriptors m v s s ms 1, 0 ms 1 h 1 h 1 First-Order Higher-Order n m6 0 s white / solid n m1 ms n n m3 m h Local conformation n m2 s Discrete 1 s black / pore of pixels n m5 ~ Extensible to any number ~h ms h h m s 0 m s 1 t1 m s N t N h of discrete phases ~ s s , s , s Gradients contain local conformation Continuous f s h h2 ms 1 f s ms ~ ~h ms h ms 0 ms 1 ms h h2 Other Basis Functions: Legendre, Generalized Spherical Harmonics, Chebyshev
- 7. Statistical distributions are the crux of μInformatics Distributions capture traditional effective statistical measures The rich internal structure of the material is the microstructure. However, the μS provides statistical, not deterministic material information. B. C. A. A. 2-pt Correlation Function – Statistical correlations between random points in space/time which reveal systematic patterns in the microstructure B. Chord Length Distribution – length and orientation of chords in a heterogeneous medium C. Interfacial Surface Distribution - The principal curvatures of interfacial surfaces in the μS. Chen et al., Morphological and topological analysis of coarsened nanoporous gold by x-ray nanotomography, Advanced Physics Letters 2010.
- 8. The Microstructure as a stochastic process Distributions provide a framework to effectively compare microstructures Microstructure HT1.1 HT1.2 Difference - = The direct comparison of the μS is useless due to the lack of origin. Autocorrelation - = (+) Provide a ground truth and metric space for comparison, or there is a natural origin (+) Autocorrelation contains all of the information in its respective μS. (+) Amenable to homogenization and localization relationships (-) Very large dimensionality
- 9. Data-mining modules are the vehicle for linkages Dimensionality reduction, classification, and regression Regression methods allow the salient microstructure features to be connected with homogenized and localized properties in static and evolving materials. (Structure-Property and Structure-Processing) Clustering and classification provide methods to automatically identify microstructures with certain performance or structural criterion. Ideal for searching the intrinsically large space of microstructures. Dimension reduction converts large dimensional data (D) to a reduced space (d) based upon specific characteristics of the data Maaten, et al., Dimension Reduction: A Comparative Review, Tilburg centre for Creative Computing, Tilburg University, 2009.
- 10. k-Means clustering for automatic feature recognition Quantitative data-mining techniques k-Means Clustering: A data-mining approach that creates cluster partitions based on the means of clusters to automatically classify datapoints. Class in practice may indicate processing history, material system, tendency to failure (e.g. rank). Sensitivity – metric for accurate classification Specificity – metric for accurate nonclassification Range between 0 and 1 K-means Clustering, Wikipedia
- 11. Linear dimension reduction with PCA Dimension reduction to deal with big data Principal Component Analysis: Reduced embedding of linearly independent variables that correspond to decreasing levels of variance starting with the highest (Dd) PCA (most DR methods) require a natural origin for the data-points PCA is typical for linear systems and exploratory data analysis. Many nonlinear techniques exist. Principal Component Analysis, Wikipedia
- 12. μS informatics is a versatile framework that relies on workflows Plug-n-play operations with modules provide solutions for diverse problems μInformatics is a growing suite of modular functions that when combined into a workflow system provide solutions to traditional empirical relationships and emerging big data in materials science. μInformatics can be seamlessly applied to 1-D, 2-D,3- D, and 4-D physical datasets generated empirically and/or computationally. Improved homogenization relationships for diffusivity in porous media (sProp) Experiments First-Order Signal Autocorrelation PCA Regression Localization meta-model for the evolution of a binary alloy (sProc) Simulation First-Order Signal N/A Regression Localization meta-model for medium contrast dual phase composites (sProp) 400 Simulation Higher-Order Signal N/A Regression μS Taxonomy of α-β Ti (s-s) 130 Experiments First-Order Signal Autocorrelation PCA Data-Mining μS Taxonomy of Organic Blends in Solar Cells (s-s) First-Order Signal Autocorrelation 1100 Simulations PCA K-means Higher-Order Signal N-pt Statistics
- 13. Data-driven structural diffusion coefficients in fuel cells Experiments Simulation First-Order Signal Autocorrelation N/A PCA Regression Regression FIB-SEM XCT Tortuosity quantifies the topology of the porous medium in a matter. How curved of tortuous are the pores? Diffusivity is the ability of a substance (electrons, liquid, gas) to diffuse through a medium.
- 14. Data-driven structural diffusion coefficients in fuel cells Experiments Simulation First-Order Signal Autocorrelation N/A PCA Regression Regression FIB-SEM XCT RVE’s from the experimental data are input into a Fickian diffusion model to evaluate the diffusivity. GDL Diffusivity Each point is one RVE ~1e6 variables MPL Diffusivity Data-driven fitting outperforms traditional fitting methods and extends the reach of the fit to both the GDL and MPL layers.
- 15. The Materials Knowledge System Extracting compact knowledge from boat loads of information Stress, strain, evolution Many Inputs and Many Outputs Repetitive simulation is demanding Simulation produces a lot of data, but what is determined about the system? How can information about new structures be extracted? What knowledge is gained?
- 16. The Materials Knowledge System Extracting compact knowledge from boat loads of information DSP representation of local structure-local response Localization relationship and its influence coefficients Influence coefficients capture the combined point effects of the MS configuration on the local response Strong implications on multi-scale modeling
- 17. An evolutionary meta-model for phase separation Simulation First-Order Signal N/A Regression A Materials Knowledge System for structure-processing relationships 2 df c a 2 ca D ca K ca dc a Phase separation guided by a negative energy gradient Cahn Hilliard Relationship evolved by way of Euler forward Double well potential free energy curve Simulated using Phase Field Model (PFM) Concentration is continuous between spinodal points [.15, .23] - Bounds of microstructure Interested in structure evolution of spinodal structure Cahn JW. On spinodal decomposition. Acta Metallurgica 1961;9:795.
- 18. IC provide accurate simulation results Simulation First-Order Signal N/A Regression Iterations of PFM used to calibrate coefficients Discretization contains 125 discrete points on a 20x20 spatial domain Time derivative of concentration is captured extremely accurately by MKS method
- 19. IC are amenable to numerical integration Simulation First-Order Signal N/A Regression • From an initial starting structure, ONE set of influence coefficients can be used to evolve the material structure Time Derivative Attenuated Error MSE Error
- 20. Influence coefficients can be used to scale the simulation Simulation First-Order Signal N/A Regression Original Scaled 63 63 at at Ø Padding
- 21. Scaled linkages are provide accurate predictions Simulation First-Order Signal N/A Regression 20x20: 100x100:
- 22. Scaled IC allow for scaled evolution simulations Simulation First-Order Signal N/A Regression Time Derivative MSE Error
- 23. Meta-modeling of moderate contrast strain fields in composites 400 Simulation Higher-Order Signal N/A Regression A Materials Knowledge System for Structure-Property relationships FEM ε=5e-4 E1 E2 Contrast (nonlinearity) – Young’s modulus ratio First-order microstructure descriptors are ineffective for high contrast Results are presented for uniaxial 1-1 strain Calibrating coefficients for other modes is trivial Random distribution of phases in 21x21x21 microstructure
- 24. Influence coefficients accurately capture the response fields 400 Simulation Higher-Order Signal N/A Regression E1 E1 5 10 E2 E2 HOIC of increasing order captures local information better Drastic improvement of linkages of FOIC Accuracy has a strong dependence on nonlinearity Cross Validation (omitted) yields agreement between training and validation sets. Case 1: First Order Case 2 – 7: Second Order Case 8-9: Seventh Order
- 25. Scalability of the influence coefficients 400 Simulation Higher-Order Signal N/A Regression 153 influences coefficients have finite memory and decay to zero at larger distances FEM required 45 min on supercomputer MKS required 15 seconds on a desktop computer MKS – NlogN(N) Case 9: Seventh-Order to First Neighborhood and Second-Order to Sixth Neighborhoods
- 26. Microstructure taxonomy of α-βTitanium 130 Experiments First-Order Signal Autocorrelation PCA Data-Mining H., Fraser, OSU PCA Embedding Each point in the PCA indicate ONE μS, or ~6e6 variables. Microstructures generated by similar heat treatments naturally cluster together in the reduced embedding. Kalidindi, S.R., S.R. Niezgoda, and A.A. Salem, Microstructure informatics using higher-order statistics and efficient data-mining protocols. JOM, 2011. 63(4): p. 34-41.
- 27. μS Taxonomy of Continuous Material States An Application to Organic Blends in Solar Cells Many Topologies 11 Distinct Topologies 10% FAST PHASE SEPARATION 90% SLOW GRAIN COARSENING FINAL STRUCTURES Use data driven techniques to classify the final topology before the Isosurfaces of atomic fraction End Goal simulation is complete. i.e. Reduce Redundancy, Time Savings 1100 Datasets Develop Microstructure Taxonomies of the Final Structures First Goal i.e. Build Utilities for Continuous Materials Features First-Order Signal Autocorrelation 1100 Simulations PCA K-means Higher-Order Signal N-pt Statistics Olga Wodo and Baskar Ganapathysubramanian at ISU.
- 28. Microstructure taxonomy of binary organic blends 1100 Simulations First-Order Signal Autocorrelation PCA K-means Each point describes 21^3 variables and each color is a different topology Binning and microstructure features effect the clustering quality Hard clustering in the PCA space allows the final topologies to be classified qualitatively
- 29. Microstructure taxonomy of binary organic blends 1100 Simulations Higher-Order Signal N-pt Statistics PCA K-means Different choices of local state descriptions lead to different levels of clustering
- 30. Quantitative Measures of Clustering 1100 Simulations Higher-Order Signal N-pt Statistics PCA K-means Sensitivity and specificity analysis of PCA embedding Class A Class B AF – Atomic Fraction FG – First Gradient Class C SG – Second Gradient FG FG AF AF SG SG Sensitivity (Classification) and specificity (Nonclassification) provide a valuation on the usefulness of difference embeddings to automatically search the space of microstructures.
- 31. PCA embedding can be used to visualize 3-D processing history μInformatics collectively can visualize SPP linkages Each path is defined by the spinodal decomposition and grain coarsening simulation. The paths are created by a reduced embedding of the N-pt statistics of 21x21x21 periodic microstructures.
- 32. PCA embedding can be used to visualize 3-D processing history μInformatics can collectively visualize bidirectional SPP linkages Structure-Property Homogenization Structure-Processing MKS Processing History Structure-Property Localization Using a stochastic framework, μInformatics provides an agile framework that allows data science to address the problems of scale in emerging materials science problems. contact: tony.fast@gmail.com
Editor's Notes
- Where is the wisdom we have lost in knowledge? Where is the knowledge we have lost in information?- T.S. Eliot (1934)
- Informatics is the science of processing, storing, and retrieving data; information science.
- From Materials informatics we can develop atlases that facilitate materials selection in rich design problems. Thanks to the incredible work of the materials science community who are developing techniques that are capable of capturing rich heterogeneous 3d information like the tri beam, robomet, and microct we are able to generate rich microstructure information.On the opposite side of the coin though, there is a data deluge that must be coped with to leverage the rich the three and four dimensional information being acrued. Microstrcutre informatics is a suite of Big Data utilities that can cope with and address these emerging challenges.To realize these concepts we must modify the framework by which we look at material properties by looking statistically at the microstructure.
- In the grand scheme of Microstructure Informatics we are presenting a workflow to address the emerging big data conceptsMicrostructure informatics is a workflow that operates on physical data to extract important features in structure-structure, structure-property and structure-processing linkages.Microstructure Informatics is agile and scalable in the sense that if codes can be easily inserted and tested that are tailored toward a particular data format.
- Expectation-maximization/maximization of the posterior marginalsBlueQuartz Software specializes in creating custom software tools that make complex algorithms approachable.Custom Software Development for the Scientist and ResearcherOur tools are always cross platform in order to allow the most flexibility to your code base. Let us help you bring your current or next project to more systems with greater ease.Our custom solutions have given our customers the ability to explore their data faster and with more flexibility than previous solutions have provided.
- The importance of the higher-order descriptors will be illustrated later on in the presentation in improving informaticsBasis function to define the “salient features”Continuous microstructures are defined using the primitive basis wherein bounded microstructure features are discretized into bins and the microstructure function is defined by the above constraint. To extend the higher-order discrete description to continuous states we have a problem of scale.To circumvent this we have developed a generalized higher-order microstructure function that is applicable to both discrete and continuous states.
- Large DimensionalityGive an example of the dimensionalityTraditional Microstructure measures
- Ground truth allows image data to be related to real features and materials on the ground. The collection of ground-truth data enables calibration of remote-sensing data, and aids in the interpretation and analysis of what is being sensed.Discuss displacement in the image as changing differenceBetter comparitive measurePixel by pixel differenceGill GallegoesJohn ElmerDale
- For a datapoint, if the class is correctly identified then it is a true positive. If a class is not chosen and it is not in that class then it is a true negative. If the correct class is not found then it is a false negative. If an incorrect class is chosen then it is a false positive.
- MVE extractedMicro porous layer predicted better than gas diffusion layer in literatureTortuosity parameter is defined as a measure of hindrance to diffusion due to the shape of the connected pore networks in the microstructure. In the case of cylindrical pores, the concept of tortuosity is geometrically well defined as the ratio of the diffusion path to the Euclidian distance traveled
- MVE extractedMicro porous layer predicted better than gas diffusion layer in literatureTortuosity parameter is defined as a measure of hindrance to diffusion due to the shape of the connected pore networks in the microstructure. In the case of cylindrical pores, the concept of tortuosity is geometrically well defined as the ratio of the diffusion path to the Euclidian distance traveled
- Micro porous layer predicted better than gas diffusion layer in literature
- No different than a filter
- In the first case study we will look at how we can supplant costly evolutionary models with anefficients MKS framework
- Micro porous layer predicted better than gas diffusion layer in literature
- Isosurface of Topologies
- Mention change with binning
- Mention change with binning
- MAKE A DIAGRAM TO EXPLAIN VISUALIZATION