1 1 09 Supply And Demand # Of Units Under Contract And Sold
- 1. RE/MAX Homes & Investments
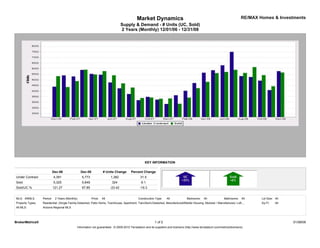
Market Dynamics
Supply & Demand - # Units (UC, Sold)
2 Years (Monthly) 12/01/06 - 12/31/08
KEY INFORMATION
Dec-06 Dec-08 # Units Change Percent Change
Under Contract 4,391 5,773 1,382 31.5
Sold 5,325 5,649 324 6.1
Sold/UC % 121.27 97.85 -23.42 -19.3
MLS: ARMLS Period: 2 Years (Monthly) Price: All Construction Type: All Bedrooms: All Bathrooms: All Lot Size: All
Property Types: Residential: (Single Family-Detached, Patio Home, Townhouse, Apartment, Twin/Semi-Detached, Manufactured/Mobile Housing, Modular / Manufactured, Loft,... Sq Ft: All
All MLS: Arizona Regional MLS
BrokerMetrics® 1 of 2 01/08/09
Information not guaranteed. © 2009-2010 Terradatum and its suppliers and licensors (http://www.terradatum.com/metrics/licensors).
- 2. RE/MAX Homes & Investments
Market Dynamics
Supply & Demand - # Units (UC, Sold)
2 Years (Monthly) 12/01/06 - 12/31/08
FOR SALE UNDER CONTRACT SOLD EXPIRED NEW LISTINGS
Time Period # Properties Average DOM # Properties Average DOM # Properties Average DOM # Properties Average DOM # Properties
Dec-08 69,472 125 5,773 79 5,649 77 8,099 158 11,761
Nov-08 69,081 120 4,085 70 4,427 68 7,292 151 12,456
Oct-08 69,446 117 4,926 66 5,415 71 7,902 149 14,678
Sep-08 68,195 117 5,250 72 6,132 72 8,185 153 14,295
Aug-08 67,217 119 5,332 75 5,612 81 7,946 155 13,588
Jul-08 69,836 119 7,490 85 5,892 91 8,934 151 13,528
Jun-08 70,420 120 6,296 94 5,700 99 9,401 160 13,558
May-08 72,447 120 5,854 97 5,599 97 8,928 152 13,062
Apr-08 72,214 118 5,636 98 4,813 103 8,887 151 13,827
Mar-08 72,177 119 4,714 101 4,258 99 8,446 154 13,521
Feb-08 70,827 117 4,020 100 3,413 104 8,099 149 13,069
Jan-08 70,983 117 3,621 109 2,867 108 9,209 144 16,059
Dec-07 68,805 125 2,846 109 3,339 103 10,761 162 8,976
Nov-07 72,103 115 3,233 99 3,315 95 8,988 141 11,670
Oct-07 74,241 111 3,480 96 3,422 97 10,265 140 14,262
Sep-07 72,751 109 3,185 95 3,377 94 9,489 139 12,921
Aug-07 72,968 105 3,735 96 4,308 92 9,567 134 14,844
Jul-07 71,109 104 4,239 96 4,685 94 8,795 133 13,890
Jun-07 71,001 101 4,765 92 5,402 90 9,103 134 14,335
May-07 70,324 99 5,452 90 5,772 90 8,349 130 14,822
Apr-07 68,629 97 5,527 88 5,475 90 7,654 128 15,269
Mar-07 66,570 96 5,882 90 5,906 92 7,344 133 16,606
Feb-07 61,945 99 5,302 92 4,884 95 6,511 133 13,709
Jan-07 60,565 100 5,395 97 4,352 93 6,760 130 15,947
Dec-06 57,505 107 4,391 92 5,325 87 8,669 139 8,650
2 of 2
BrokerMetrics® 01/08/09
Information not guaranteed. © 2009-2010 Terradatum and its suppliers and licensors (http://www.terradatum.com/metrics/licensors).