SlideShare a Scribd company logo
1 of 8
Download to read offline
The International Journal Of Engineering And Science (IJES)
|| Volume || 4 || Issue || 4 || Pages || PP.73-80 || 2015 ||
ISSN (e): 2319 – 1813 ISSN (p): 2319 – 1805
www.theijes.com The IJES Page 73
A Model for Assessment of Power System Outages on Nigerian
Transmission Network.
Ganiyu A. Ajenikoko1
, Ogunmakinde. Jimoh Ogunwuyi2
1,
Department of Electronic & Electrical Engineering, Ladoke Akintola University of Technology, P.M.B. 4000,
Ogbomoso, Nigeria.
2,
Department of Electrical & Electronics Engineering, Osun State Polytechnic, Iree, Osun State, Nigeria.
------------------------------------------------------------ABSTRACT---------------------------------------------------------
A power outage is a short or long-term loss of the electric power to an area such as faults at power stations,
damage to electric transmission lines, substation or other parts of the power system.The Nigerian national grid
is characterized by frequent outages due to aging of equipment/ lines leading to frequent conductor jumper cuts,
frequent earth faults resulting from reduction in overhead clearance and refuse burning and circuit breaker
problems. This paper develops a polynomial model for the assessment of power system outages on the Nigerian
transmission network using curve fitting tools analysis. Data from the transmission network of the national grid
were collected and used as input parameters for the computation of the statistical parameters to develop the
power system outage model for the network. The results of the work showed that the statistical mean and median
of the total outages were 73.11and 203.50 respectively even though February was the modal month with an
outage of 373 due to frequent interruptions experienced by customers during this month. Forced outages on the
transmission network recorded the highest value of 44.8% while 32.5% were due to urgent outages and 22.7%
were due to planned outages suggesting that the resistance of the network is very low resulting in very low
efficiency and disruption in the lives of the citizenry. The result of the work also showed that the polynomial
model developed for the assessment of the power system outages is of order 5 whose order increases as more
outages are recorded on the transmission network. Ageing of equipment, lightning, vandalization and poor
maintenance culture have been identified as some of the causes of power outages on the transmission network.
The analysis of the paper can be used to emphasize that in order to ensure safety and security of the
transmission network, there is the need for a proper protection of the transmission lines system.
Keywords: Power outages, Transmission lines, Planned outages, Forced outages, Urgent outages, Ageing of
equipment, Vandalization, Interruptions.
---------------------------------------------------------------------------------------------------------------------------------------
Date of Submission: 04-April-2015 Date of Accepted: 30-April-2015
---------------------------------------------------------------------------------------------------------------------------------------
I. INTRODUCTION
The power stations in Nigeria are hydro and thermal plants. Electricity network in Nigeria comprises of
11,000km transmission lines (330 kV and 132 kV), 24000 km of sub-transmission lines (33 kV), 1900 km of
distribution lines (11 kV) and 22,500 substations. It has only one major loop system involving Benin – ikeja
west – Ayede – 0s0gbo and Benin. (Stott et al, 2013) The absence of loops is responsible for the weak and
unreliable power system in the country. The single line diagram of the existing 28buses 330 kV Nigerian
transmission network is shown in Figure 1 and identification of the buses are shown in Table 1.
Birni kebbi Kainji GS Kano Jos Gombe
196km
Kaduna
230km
96km
Shiroro
244km
157km
251km
Katampe
(Abuja)
Ajaokuta
137 km 96 km
New Haven
Onitsha
138 km
25 km
Afam
Aladja
Calabar
107 km
Delta IV
Delta II
32 km
63 km
Aladja
Sapele
50km
Benin
Aes
16km
Aja
Egbin
Akangba
62km
Ikeja
West17km
115km
137km
Aiyede
252km
Osogbo
Jebba GS
8km Jebba TS
18km
310km
144km
264km
280km
Figure 1: The National Grid System.
A Model For Assessment Of Power…
www.theijes.com The IJES Page 74
Table 1: Identification of the buses..
Electric power is generated and sent over transmission lines to substations which reduce the voltage level
for distribution to end – users Power outages can result from seasonal storms which often combine the furies of
wind, rain, snow or ice. The more severe weather events usually cause the greatest damage to electric power
transmission and distribution infrastructure as damage can result from trees or branches falling on electricity
lines (Tinney et al, 2005). Power outages can affect manufacturing operations mainly through down time as
workers are idled..It can damage equipment and production processes and also disrupt many other electric
power dependent activities (Zollenkopf 2001).
High winds especially when combined with precipitation from seasonal storms, can cause damage to electricity
utility systems, resulting in service interruptions to large number of electricity consumers, while most such
power outages are caused by damage from trees and tree limits falling on local electricity distribution lines,
which carry bulk power over long distances. Depending on the severity of the storm and resulting impairment,
power outages can last a few hours or extend to periods of several days. This in turn can have real economic
effects as power outages can impact businesses, through lost orders and damage to perishable goods and
inventories (Grainger and Stevenson 2004).
Types of power outages.
Power outages are categorized into three phenomena relating to the duration and effect of the outage.
A transient fault is a momentary loss of power which is caused by a temporary fault on a power line. In this
case, power is automatically restored once a fault is cleared. A blown-out or a sag is a drop in voltage in an
electrical power supply which can cause poor performance of the equipment or even incorrect operation
(Shoults 2004, Mehta and Madent 2006)...
A black-out refers to the total loss of power to an area and is the most severe form of power outage that
can occur. Outages may last from a few minutes to a few weeks depending on the nature of the black-out and
the configuration of the electrical network(Donald et al 2013, Bruce and Allen, 2006).
Mitigation of power outage frequency.
There are four mitigation networks namely:
Increasing the critical number of failures causing cascading blackouts which decreases the frequency of the
smaller blackouts and increase that of larger blackouts.
Increasing individual power line maximum load which increases the frequency of smaller blackouts and
decreases that of larger blackouts (Stott et al 2013, Momoh 2001).
A Model For Assessment Of Power…
www.theijes.com The IJES Page 75
Combination of increasing critical number and maximum load of lines which have a significance on
either side of blackout..The resulting minor reduction in the frequency of blackouts is projected not to worth the
cost of the implementation. Increasing the excess power available on the grid decreases the frequency of smaller
blackouts and increases that of larger blackout (Clements et al 2014, Preston et al 2007, Pabio 2001) ..
II. MATERIALS AND METHOD.
In this research paper, the following procedural steps were taken:
i. The statistical parameters such as mean, median, mode, standard deviation and variance were
identified.
ii. Data were collected on the transmission power outage based on annual reports for the study using the
utility logbooks.
iii. The power outages in the network were analyzed and the indentified statistical parameters were
computed.
iv. A power system outage model is developed using Curve fitting tools.
III. DISCUSSION OF RESULTS.
Figure 1 shows the variation of the planned outages versus the time from 2001 to 2005 (for each of the
five years study period).In the months of January, June and November of year 2001, there was no planned
outage at all due to the proper functioning of the equipment. The planned outages fluctuated between 1 outage in
April 2001 and 8 outages in August in the same year, thus the total recorded planned outage was 35 in the year..
In year 2002, a least planned outage of 2 was recorded in March and June as a result of fewer numbers of
interruptions experienced by the customers attached to the affected feeders. Planned outages were recorded in
January, February and December due to the overloading of the transformers. The number of planned outages
fluctuated over the months with a least planned outages of 2 in March, June and August, even though, a peak
outage of 14 was recorded in January, February and December. There was a total of 101 planned outages which
represents a high percentage increase in the planned outage as compared to 2001 due to poor maintenance
culture on the transmission line equipment.
In 2003 the month of April recorded a least planned outages of 2 while in September of this same year,
a total planned outages of 15 were recorded which appeared to be the highest in that year because many of the
transformers on the lines were experiencing overloading which led to very low voltages. In 2004, the number of
planned outages fluctuated appreciably with a least planned outages of 10 recorded in June due to lesser number
of interruptions experienced by all the customers attached to these feeders in the month. There were 23 planned
outages in October which appeared to be the highest in that year. In the year, there were 190 planned outages
recorded implying that the maintenance culture on the equipment declined as more outages were noticed and
recorded in 2004 unlike in 2003 where the number of planned outages was 90. In 2005, December recorded the
least planned outages which could be due to the adequate and efficient maintenance culture as well as the
determination to keep the machines/equipment in good working conditions before the beginning of the
following year. In February and November, a largest planned outages of 20 were recorded. The first 20 outages
recorded in February 2005 was due to prolonged interruptions experienced in this month while in November, the
20 planned outages was as a result of decline in the maintenance culture on the system equipment. The total
number of planned outages in 2005 was 181 which was a decline in planned outages as compared to the
previous year. It is observed that throughout the five years used as case studies, the month of April recorded the
least planned outages of 36 which could be due to appropriate and adequate maintenance culture on the system
equipment in this month. September has a highest planned outages of 67 throughout the study period due to
failure to clear most of the prolonged faults on the feeders.
14 planned outages were recorded in January, February and December because of the overloading of
the transformers. The number of planned outages fluctuated over the months of the year with a least planned
outage of 2 recorded in March, June and August and a peak outage of 14 recorded in January, February and
December. There was a total of 101 planned outages which represents an appreciable increase in the planned
outage as compared to 2001 due to poor maintenance culture on the transmission line equipment. The statistical
mean, median and the mode for planned outages during the five years study period are 49.8, 50 and 67
respectively even though the modal month was September.
The relationship between the forced outages and the time for the five years study period is shown in
Figure 2. In 2001, a total of 244 forced outages were recorded out of which only 3 were recorded in July
because most of the equipment were functioning effectively and with adequate maintenance during the month
and 38 forced outages were recorded in February which could be traced to transmission line constraints on the
feeders during this month.
In 2002, only 5 forced outages were noted in May and 35 forced outages were recorded in June and December
which could be traced to vandalization of the lines.
A Model For Assessment Of Power…
www.theijes.com The IJES Page 76
In 2003, only 4 forced outages were recorded in March while 42 forced outages were recorded in
December. The maintenance culture on the system equipment declined appreciably and many interruptions were
experienced by all the customer attached to the feeders.
In 2004, there were 15 forced outages in April while in June, there were 30 forced outages even through, the
forced outages fluctuated throughout the year .The statistical mean, median and mode for the forced outages
were 98.3, 88.5 and 192 respectively even though, February was the modal month.
The variation of the urgent outages with time is shown in Figure 3.
In 2001, the least urgent outage was 8 and this occurred in June, August and December while the highest urgent
outages of 19 were recorded in February due to shunt reactor problems experienced this month.
In 2002, there were 18 urgent outages in April and 7 outages in August as a result of corrective maintenance
practices on the transmission lines.
In 2003, the urgent outages recorded in February, June, August and October were 125, 27, 8 and 3 outages
respectively representing a drastic fall in outages over the year because the distribution transformers were well
protected and very long and fragile lines were re-enforced to improve the voltage stability and efficiency of the
network..
In 2005, the recorded urgent outages in February and June were 21 and 2 outages respectively because
of the prolonged interruptions experienced on the lines in February suggesting that the resistance of the network
was very low and resulting in very low efficiency and disruption in the lives of the citizenry.
Frequent outages which are due to aging of equipment / lines are some of the characteristics of Nigeria
transmission network. These result in frequent conductor/jumper cuts, frequent earth faults and circuit breaker
problems.
The statistical parameters (mean, median and mode) for urgent outages were 71.6, 61 and 192 even
though, February was the modal month.
The total planned outages vary with time on monthly basis as illustrated in Figure 4. During the five years study
period: a total of 40 planned outages were recorded in June which is more than half of the total planned outages
recorded and this is evident from the figure.
Figure 5 shows the graphical representation of how the total forced outages vary with time on monthly basis. A
total of 120 forced outages were recorded in June during the five years study period.
Figure 6 illustrates the variation of total urgent outages with time on monthly basis. A total of 190 urgent
outages were recorded in February throughout the five years study period. This is the maximum total urgent
outages recorded.
The relationship between the planned outages and the time in years is illustrated in Figure 7.
Figure 8 shows how the forced outages vary with time on a yearly basis while the variation of the urgent outages
with time on a yearly basis is also illustrated in Figure 9.
The relationship between each of the three outages (planned, forced and urgent) and time on monthly basis is
shown in Figure 10.
It is evident from the figure that a total of 190 urgent outages were recorded in February, 50 forced outages were
recorded in October and 55 planned outages were recorded in November.
Figure 11 shows the variation of combined outages with time on monthly basis. During the five years study
period, a total of 210 outages were recorded in March as evident from the figure.
The model developed for the assessment of the transmission network is
y = 0.080x5
– 2.668x4
+ 32.33x3
- 171.0x2
+ 351x + 75.04, R2
= 0.965
Where y = total outages,
x = time
R2
= coefficient of determination.
R2
shows the extent of the relationship between the total outages recorded on the transmission network and the
time. The model is a polynomial of order 5 whose order increases as more outages are recorded on the
transmission network.
IV. CONCLUSION.
A polynomial model of order 5 has been developed for the assessment of power outages on the Nigeria
transmission network. The analysis of the work showed that out of a total of 2632 outages recorded on the 132
kV and 330 kV transmission networks, forced outages recorded the highest value of 44.8% while 32.5% were
due to urgent outages and the rest were due to planned outages suggesting the need for a proper protection of the
transmission line systems.
A Model For Assessment Of Power…
www.theijes.com The IJES Page 77
Figure 1: Planned outages Versus Time for 5years
Figure 2: Forced Outages versus Time for 5years
Figure 3: Urgent Outages versus Time for 5years
0
5
10
15
20
25
Jan Feb Mar Apr May Jun Jul Aug Sep Oct Nov Dec
2001
2002
2003
2004
2005
0
5
10
15
20
25
30
35
40
45
Jan Feb Mar Apr May Jun Jul Aug Sep Oct Nov Dec
2001
2002
2003
2004
2005
0
20
40
60
80
100
120
140
Jan Feb Mar Apr May Jun Jul Aug Sep Oct Nov Dec
2001
2002
2003
2004
2005
Plannedoutages
Time (Month)
ForcedOutages
Time (Month)
Time (Month)
UrgentOutages
A Model For Assessment Of Power…
www.theijes.com The IJES Page 78
Figure 4: Total Planned Outages versus Time in Months
Figure 5: Total Forced Outages versus Time in Months
Figure 6: Total Urgent Outages versus Time in Months
0
10
20
30
40
50
60
70
80
Jan Feb Mar Apr May Jun Jul Aug Sep Oct Nov Dec
0
20
40
60
80
100
120
140
160
Jan Feb Mar Apr May Jun Jul Aug Sep Oct Nov Dec
0
50
100
150
200
250
Jan Feb Mar Apr May Jun Jul Aug Sep Oct Nov Dec
TotalPlannedOutages
TotalForcedOutages
TotalUrgentOutages
Time (Months)
A Model For Assessment Of Power…
www.theijes.com The IJES Page 79
Figure 7: Planned Outages versus Time in Years
Figure 8: Forced Outages versus Time in Years
Figure 9: Urgent Outages versus Time in Years
0
50
100
150
200
2001 2002 2003 2004 2005
0
50
100
150
200
250
300
2001 2002 2003 2004 2005
0
50
100
150
200
250
300
350
2001 2002 2003 2004 2005
PlannedOutagesForcedOutageUrgentOutage
A Model For Assessment Of Power…
www.theijes.com The IJES Page 80
Figure 10: Planned, Forced and Urgent Outages versus Time (Months)
Figure 11: Total outages versus time (months)
REFERENCES
[1] Bruce F and Allen J. W (2006):”Power generation, operation and Control,” John Wiley and Sons Inc, Second Edition, Pp 44-64.
[2] Clements K.A, Lam B.P, David J, Lawrence Y and Reppen N.D (2014): ”Computation of upper and lower bounds on reliability
indices for bulk power system,” IEEE T-PAS, Vol. 103, No. 8, Pp. 2318 – 2324.
[3] Donald G, Fink T and Wayne H B (2013):”Standard Handbook for Electrical Engineers,” McGrew Hill International Edition, Pp
98-104.
[4] Grainger J. J and Stevenson W.D (2004):” Power system analysis,”McGraw-Hill, New York, 5th
Editions, Pp. 591 – 620.
[5] Mehta V.K and Madent R(2006):”Principles of Power system.” Chand and Co Ltd New Delhi, Third Edition, Pp 87-95.
[6] Momoh A.J (2001) “Power System: Application of Optimization Principles,” Marcel Delker Inc, 3rd
Editions, Pp 31 – 37
[7] Pablo A.S (2001):”Electrical Power Distribution,” Fourth Edition, Chand and Co Ltd New Delhi, Pp 23-36.
[8] Preston E, Grady M and Baughman M(2007): ” A new planning model for assessment of the effects of transmission capacity
constraints on the reliability of generation supply for large non equivalence electric network,” IEEE T-PAS, Vol. 12, No. 3, Pp.
1367 – 1373.
[9] Shoults R.R (2004):”Application of fast linear AC power flow to contingency simulation and optimal control of power systems,”
Ph.D. Dissertation, The University of Taxes at Arlington, Arlington, Pp 65-86.
[10] Stott B Tinney W.F and Sparsity R(2013): “Oriented compensation methods for modified network solution,” IEEE T-PAS, Vol.
102, No. 5, Pp. 1050 – 1060.
[11] Tinney W.F, ,Brandwajn W.B and Chan S.M(2005):”Sparse vector methods,” IEEE T-PAS, Vol. 104, No. 2, Pp. 295 – 301.
[12] Zollenkopf K (2001):”Basic computational algorithm and programming techniques”; A paper from large sparse sets of linear
equations. Pp 75 – 96.
0
50
100
150
200
250
Jan Feb Mar Apr May Jun Jul Aug Sep Oct Nov Dec
Totalplanned
Total Forced
Total Urgent
0
50
100
150
200
250
300
350
400
Jan Feb Mar Apr May Jun Jul Aug Sep Oct Nov Dec
Totaloutages
Time [month]
Time (Month)
TotalOutages

More Related Content

What's hot

L030101066072
L030101066072L030101066072
L030101066072theijes
 
Islanding Detection and Controlled Islanding in Emerging Power Systems Key Is...
Islanding Detection and Controlled Islanding in Emerging Power Systems Key Is...Islanding Detection and Controlled Islanding in Emerging Power Systems Key Is...
Islanding Detection and Controlled Islanding in Emerging Power Systems Key Is...IRJET Journal
 
Power failure presentation
Power failure presentationPower failure presentation
Power failure presentationSatyendra Arora
 
ESTIMATION AND COMPARISION OF COST OF COAL POWER GENERATION WITH EXTERNAL COS...
ESTIMATION AND COMPARISION OF COST OF COAL POWER GENERATION WITH EXTERNAL COS...ESTIMATION AND COMPARISION OF COST OF COAL POWER GENERATION WITH EXTERNAL COS...
ESTIMATION AND COMPARISION OF COST OF COAL POWER GENERATION WITH EXTERNAL COS...Ankur Tyagi
 
Analysis and Implementation of Power Quality Enhancement Techniques Using Cus...
Analysis and Implementation of Power Quality Enhancement Techniques Using Cus...Analysis and Implementation of Power Quality Enhancement Techniques Using Cus...
Analysis and Implementation of Power Quality Enhancement Techniques Using Cus...ijtsrd
 
Improving power distribution efficiency on power lines
Improving power distribution efficiency on power linesImproving power distribution efficiency on power lines
Improving power distribution efficiency on power linesAlexander Decker
 
Development of a Cost Effective Power Generation System: An Overview
Development of a Cost Effective Power Generation System: An OverviewDevelopment of a Cost Effective Power Generation System: An Overview
Development of a Cost Effective Power Generation System: An Overviewijeei-iaes
 
A Review on Power Flexibility, Generation and Distribution System
A Review on Power Flexibility, Generation and Distribution SystemA Review on Power Flexibility, Generation and Distribution System
A Review on Power Flexibility, Generation and Distribution Systemijtsrd
 
An Energy Fraud Detection Scheme for Power Utilities
An Energy Fraud Detection Scheme for Power UtilitiesAn Energy Fraud Detection Scheme for Power Utilities
An Energy Fraud Detection Scheme for Power UtilitiesIJERA Editor
 
Matlab Implementation of Power Quality Improvement Based on Fast Dynamic Control
Matlab Implementation of Power Quality Improvement Based on Fast Dynamic ControlMatlab Implementation of Power Quality Improvement Based on Fast Dynamic Control
Matlab Implementation of Power Quality Improvement Based on Fast Dynamic Controlijtsrd
 
IRJET- Analysis of Demand Side Management of Distribution Systems
IRJET-  	  Analysis of Demand Side Management of Distribution SystemsIRJET-  	  Analysis of Demand Side Management of Distribution Systems
IRJET- Analysis of Demand Side Management of Distribution SystemsIRJET Journal
 
Mitigation of Power Quality Problems Using Custom Power Devices: A Review
Mitigation of Power Quality Problems Using Custom Power Devices: A ReviewMitigation of Power Quality Problems Using Custom Power Devices: A Review
Mitigation of Power Quality Problems Using Custom Power Devices: A Reviewijeei-iaes
 
GRID INTERCONNECTION OF RENEWABLE ENERGY SOURCES AT DISTRIBUTION LEVEL WITH P...
GRID INTERCONNECTION OF RENEWABLE ENERGY SOURCES AT DISTRIBUTION LEVEL WITH P...GRID INTERCONNECTION OF RENEWABLE ENERGY SOURCES AT DISTRIBUTION LEVEL WITH P...
GRID INTERCONNECTION OF RENEWABLE ENERGY SOURCES AT DISTRIBUTION LEVEL WITH P...Pradeep Avanigadda
 
Ch 2 energy conservation act and its features
Ch 2 energy conservation act and its featuresCh 2 energy conservation act and its features
Ch 2 energy conservation act and its featuresKartik Mahajan
 
In tech demand-management_and_wireless_sensor_networks_in_the_smart_grid
In tech demand-management_and_wireless_sensor_networks_in_the_smart_gridIn tech demand-management_and_wireless_sensor_networks_in_the_smart_grid
In tech demand-management_and_wireless_sensor_networks_in_the_smart_gridAWe Shinkansen
 

What's hot (17)

L030101066072
L030101066072L030101066072
L030101066072
 
Islanding Detection and Controlled Islanding in Emerging Power Systems Key Is...
Islanding Detection and Controlled Islanding in Emerging Power Systems Key Is...Islanding Detection and Controlled Islanding in Emerging Power Systems Key Is...
Islanding Detection and Controlled Islanding in Emerging Power Systems Key Is...
 
Power failure presentation
Power failure presentationPower failure presentation
Power failure presentation
 
ESTIMATION AND COMPARISION OF COST OF COAL POWER GENERATION WITH EXTERNAL COS...
ESTIMATION AND COMPARISION OF COST OF COAL POWER GENERATION WITH EXTERNAL COS...ESTIMATION AND COMPARISION OF COST OF COAL POWER GENERATION WITH EXTERNAL COS...
ESTIMATION AND COMPARISION OF COST OF COAL POWER GENERATION WITH EXTERNAL COS...
 
Analysis and Implementation of Power Quality Enhancement Techniques Using Cus...
Analysis and Implementation of Power Quality Enhancement Techniques Using Cus...Analysis and Implementation of Power Quality Enhancement Techniques Using Cus...
Analysis and Implementation of Power Quality Enhancement Techniques Using Cus...
 
Power scenerio in india
Power scenerio in indiaPower scenerio in india
Power scenerio in india
 
Improving power distribution efficiency on power lines
Improving power distribution efficiency on power linesImproving power distribution efficiency on power lines
Improving power distribution efficiency on power lines
 
Development of a Cost Effective Power Generation System: An Overview
Development of a Cost Effective Power Generation System: An OverviewDevelopment of a Cost Effective Power Generation System: An Overview
Development of a Cost Effective Power Generation System: An Overview
 
A Review on Power Flexibility, Generation and Distribution System
A Review on Power Flexibility, Generation and Distribution SystemA Review on Power Flexibility, Generation and Distribution System
A Review on Power Flexibility, Generation and Distribution System
 
An Energy Fraud Detection Scheme for Power Utilities
An Energy Fraud Detection Scheme for Power UtilitiesAn Energy Fraud Detection Scheme for Power Utilities
An Energy Fraud Detection Scheme for Power Utilities
 
06011696
0601169606011696
06011696
 
Matlab Implementation of Power Quality Improvement Based on Fast Dynamic Control
Matlab Implementation of Power Quality Improvement Based on Fast Dynamic ControlMatlab Implementation of Power Quality Improvement Based on Fast Dynamic Control
Matlab Implementation of Power Quality Improvement Based on Fast Dynamic Control
 
IRJET- Analysis of Demand Side Management of Distribution Systems
IRJET-  	  Analysis of Demand Side Management of Distribution SystemsIRJET-  	  Analysis of Demand Side Management of Distribution Systems
IRJET- Analysis of Demand Side Management of Distribution Systems
 
Mitigation of Power Quality Problems Using Custom Power Devices: A Review
Mitigation of Power Quality Problems Using Custom Power Devices: A ReviewMitigation of Power Quality Problems Using Custom Power Devices: A Review
Mitigation of Power Quality Problems Using Custom Power Devices: A Review
 
GRID INTERCONNECTION OF RENEWABLE ENERGY SOURCES AT DISTRIBUTION LEVEL WITH P...
GRID INTERCONNECTION OF RENEWABLE ENERGY SOURCES AT DISTRIBUTION LEVEL WITH P...GRID INTERCONNECTION OF RENEWABLE ENERGY SOURCES AT DISTRIBUTION LEVEL WITH P...
GRID INTERCONNECTION OF RENEWABLE ENERGY SOURCES AT DISTRIBUTION LEVEL WITH P...
 
Ch 2 energy conservation act and its features
Ch 2 energy conservation act and its featuresCh 2 energy conservation act and its features
Ch 2 energy conservation act and its features
 
In tech demand-management_and_wireless_sensor_networks_in_the_smart_grid
In tech demand-management_and_wireless_sensor_networks_in_the_smart_gridIn tech demand-management_and_wireless_sensor_networks_in_the_smart_grid
In tech demand-management_and_wireless_sensor_networks_in_the_smart_grid
 

Viewers also liked

Data Mining Applied To Construct Risk Factors For Building Claim on Fire Insu...
Data Mining Applied To Construct Risk Factors For Building Claim on Fire Insu...Data Mining Applied To Construct Risk Factors For Building Claim on Fire Insu...
Data Mining Applied To Construct Risk Factors For Building Claim on Fire Insu...theijes
 
First mitotic division: criterion for selection of potential IVF embryo – A ...
	First mitotic division: criterion for selection of potential IVF embryo – A ...	First mitotic division: criterion for selection of potential IVF embryo – A ...
First mitotic division: criterion for selection of potential IVF embryo – A ...theijes
 
Mathematical Calculation toFindtheBest Chamber andDetector Radii Used for Mea...
Mathematical Calculation toFindtheBest Chamber andDetector Radii Used for Mea...Mathematical Calculation toFindtheBest Chamber andDetector Radii Used for Mea...
Mathematical Calculation toFindtheBest Chamber andDetector Radii Used for Mea...theijes
 
Techno-Economic and Environmental Impact Analysis of A Passive Solar Cooker f...
Techno-Economic and Environmental Impact Analysis of A Passive Solar Cooker f...Techno-Economic and Environmental Impact Analysis of A Passive Solar Cooker f...
Techno-Economic and Environmental Impact Analysis of A Passive Solar Cooker f...theijes
 
Models for predicting body dimensions needed for furniture design of junior s...
Models for predicting body dimensions needed for furniture design of junior s...Models for predicting body dimensions needed for furniture design of junior s...
Models for predicting body dimensions needed for furniture design of junior s...theijes
 
Natural radiation levels and health hazard indices of soil in Owerri Nigeria
Natural radiation levels and health hazard indices of soil in Owerri NigeriaNatural radiation levels and health hazard indices of soil in Owerri Nigeria
Natural radiation levels and health hazard indices of soil in Owerri Nigeriatheijes
 
Identification of Some of Low Temperature Waste Heat Utilization Potentials i...
Identification of Some of Low Temperature Waste Heat Utilization Potentials i...Identification of Some of Low Temperature Waste Heat Utilization Potentials i...
Identification of Some of Low Temperature Waste Heat Utilization Potentials i...theijes
 
B031102010017
B031102010017B031102010017
B031102010017theijes
 
Real Time Monitoring And Controlling System
Real Time Monitoring And Controlling SystemReal Time Monitoring And Controlling System
Real Time Monitoring And Controlling Systemtheijes
 
Design for Additive Manufacturing – DFAM
Design for Additive Manufacturing – DFAMDesign for Additive Manufacturing – DFAM
Design for Additive Manufacturing – DFAMtheijes
 
K031101070076
K031101070076K031101070076
K031101070076theijes
 
Geospatial School Bus Routing
Geospatial School Bus RoutingGeospatial School Bus Routing
Geospatial School Bus Routingtheijes
 
A0311020109
A0311020109A0311020109
A0311020109theijes
 
Experimental Study of Load Bearing Capacity of Foundations with Different Ver...
Experimental Study of Load Bearing Capacity of Foundations with Different Ver...Experimental Study of Load Bearing Capacity of Foundations with Different Ver...
Experimental Study of Load Bearing Capacity of Foundations with Different Ver...theijes
 
Determination of Erodibility Index (K) Of Soil in Michael Okpara University o...
Determination of Erodibility Index (K) Of Soil in Michael Okpara University o...Determination of Erodibility Index (K) Of Soil in Michael Okpara University o...
Determination of Erodibility Index (K) Of Soil in Michael Okpara University o...theijes
 
Biocoagulation Activity of Moringa oleifera Seeds for Water Treatment
Biocoagulation Activity of Moringa oleifera Seeds for Water TreatmentBiocoagulation Activity of Moringa oleifera Seeds for Water Treatment
Biocoagulation Activity of Moringa oleifera Seeds for Water Treatmenttheijes
 
J031102080084
J031102080084J031102080084
J031102080084theijes
 
The Effects of Population Growth on Economic Growth in Nigeria
The Effects of Population Growth on Economic Growth in NigeriaThe Effects of Population Growth on Economic Growth in Nigeria
The Effects of Population Growth on Economic Growth in Nigeriatheijes
 
Morphometric analysis of a Semi Urban Watershed, trans Yamuna, draining at Al...
Morphometric analysis of a Semi Urban Watershed, trans Yamuna, draining at Al...Morphometric analysis of a Semi Urban Watershed, trans Yamuna, draining at Al...
Morphometric analysis of a Semi Urban Watershed, trans Yamuna, draining at Al...theijes
 

Viewers also liked (19)

Data Mining Applied To Construct Risk Factors For Building Claim on Fire Insu...
Data Mining Applied To Construct Risk Factors For Building Claim on Fire Insu...Data Mining Applied To Construct Risk Factors For Building Claim on Fire Insu...
Data Mining Applied To Construct Risk Factors For Building Claim on Fire Insu...
 
First mitotic division: criterion for selection of potential IVF embryo – A ...
	First mitotic division: criterion for selection of potential IVF embryo – A ...	First mitotic division: criterion for selection of potential IVF embryo – A ...
First mitotic division: criterion for selection of potential IVF embryo – A ...
 
Mathematical Calculation toFindtheBest Chamber andDetector Radii Used for Mea...
Mathematical Calculation toFindtheBest Chamber andDetector Radii Used for Mea...Mathematical Calculation toFindtheBest Chamber andDetector Radii Used for Mea...
Mathematical Calculation toFindtheBest Chamber andDetector Radii Used for Mea...
 
Techno-Economic and Environmental Impact Analysis of A Passive Solar Cooker f...
Techno-Economic and Environmental Impact Analysis of A Passive Solar Cooker f...Techno-Economic and Environmental Impact Analysis of A Passive Solar Cooker f...
Techno-Economic and Environmental Impact Analysis of A Passive Solar Cooker f...
 
Models for predicting body dimensions needed for furniture design of junior s...
Models for predicting body dimensions needed for furniture design of junior s...Models for predicting body dimensions needed for furniture design of junior s...
Models for predicting body dimensions needed for furniture design of junior s...
 
Natural radiation levels and health hazard indices of soil in Owerri Nigeria
Natural radiation levels and health hazard indices of soil in Owerri NigeriaNatural radiation levels and health hazard indices of soil in Owerri Nigeria
Natural radiation levels and health hazard indices of soil in Owerri Nigeria
 
Identification of Some of Low Temperature Waste Heat Utilization Potentials i...
Identification of Some of Low Temperature Waste Heat Utilization Potentials i...Identification of Some of Low Temperature Waste Heat Utilization Potentials i...
Identification of Some of Low Temperature Waste Heat Utilization Potentials i...
 
B031102010017
B031102010017B031102010017
B031102010017
 
Real Time Monitoring And Controlling System
Real Time Monitoring And Controlling SystemReal Time Monitoring And Controlling System
Real Time Monitoring And Controlling System
 
Design for Additive Manufacturing – DFAM
Design for Additive Manufacturing – DFAMDesign for Additive Manufacturing – DFAM
Design for Additive Manufacturing – DFAM
 
K031101070076
K031101070076K031101070076
K031101070076
 
Geospatial School Bus Routing
Geospatial School Bus RoutingGeospatial School Bus Routing
Geospatial School Bus Routing
 
A0311020109
A0311020109A0311020109
A0311020109
 
Experimental Study of Load Bearing Capacity of Foundations with Different Ver...
Experimental Study of Load Bearing Capacity of Foundations with Different Ver...Experimental Study of Load Bearing Capacity of Foundations with Different Ver...
Experimental Study of Load Bearing Capacity of Foundations with Different Ver...
 
Determination of Erodibility Index (K) Of Soil in Michael Okpara University o...
Determination of Erodibility Index (K) Of Soil in Michael Okpara University o...Determination of Erodibility Index (K) Of Soil in Michael Okpara University o...
Determination of Erodibility Index (K) Of Soil in Michael Okpara University o...
 
Biocoagulation Activity of Moringa oleifera Seeds for Water Treatment
Biocoagulation Activity of Moringa oleifera Seeds for Water TreatmentBiocoagulation Activity of Moringa oleifera Seeds for Water Treatment
Biocoagulation Activity of Moringa oleifera Seeds for Water Treatment
 
J031102080084
J031102080084J031102080084
J031102080084
 
The Effects of Population Growth on Economic Growth in Nigeria
The Effects of Population Growth on Economic Growth in NigeriaThe Effects of Population Growth on Economic Growth in Nigeria
The Effects of Population Growth on Economic Growth in Nigeria
 
Morphometric analysis of a Semi Urban Watershed, trans Yamuna, draining at Al...
Morphometric analysis of a Semi Urban Watershed, trans Yamuna, draining at Al...Morphometric analysis of a Semi Urban Watershed, trans Yamuna, draining at Al...
Morphometric analysis of a Semi Urban Watershed, trans Yamuna, draining at Al...
 

Similar to A Model for Assessment of Power System Outages on Nigerian Transmission Network

The Effects of Technical and Non Technical Losses on Power Outages in Nigeria
The Effects of Technical and Non Technical Losses on Power Outages in NigeriaThe Effects of Technical and Non Technical Losses on Power Outages in Nigeria
The Effects of Technical and Non Technical Losses on Power Outages in NigeriaDr. Hachimenum Amadi
 
The Effects of Technical and Non-Technical Losses on Power Outages in Nigeria
The Effects of Technical and Non-Technical Losses on Power Outages in NigeriaThe Effects of Technical and Non-Technical Losses on Power Outages in Nigeria
The Effects of Technical and Non-Technical Losses on Power Outages in NigeriaDr. Hachimenum Amadi
 
IRJET- Electric Power Distribution Network Performance Assessment based o...
IRJET-  	  Electric Power Distribution Network Performance Assessment based o...IRJET-  	  Electric Power Distribution Network Performance Assessment based o...
IRJET- Electric Power Distribution Network Performance Assessment based o...IRJET Journal
 
RELIABILITY EVALUATION OF A WIND POWER PLANT IN THE MID REGION OF KARNATAKA S...
RELIABILITY EVALUATION OF A WIND POWER PLANT IN THE MID REGION OF KARNATAKA S...RELIABILITY EVALUATION OF A WIND POWER PLANT IN THE MID REGION OF KARNATAKA S...
RELIABILITY EVALUATION OF A WIND POWER PLANT IN THE MID REGION OF KARNATAKA S...IRJET Journal
 
Performance investigation of electricial power supply to owerri for higher pr...
Performance investigation of electricial power supply to owerri for higher pr...Performance investigation of electricial power supply to owerri for higher pr...
Performance investigation of electricial power supply to owerri for higher pr...eSAT Publishing House
 
Performance investigation of electricial power supply to owerri for higher pr...
Performance investigation of electricial power supply to owerri for higher pr...Performance investigation of electricial power supply to owerri for higher pr...
Performance investigation of electricial power supply to owerri for higher pr...eSAT Journals
 
Influencing Factors on Power Losses in Electric Distribution Network
Influencing Factors on Power Losses in Electric Distribution NetworkInfluencing Factors on Power Losses in Electric Distribution Network
Influencing Factors on Power Losses in Electric Distribution NetworkIJAEMSJORNAL
 
B0314011017
B0314011017B0314011017
B0314011017theijes
 
Evaluation of losses in distribution networks of selected industrial cities i...
Evaluation of losses in distribution networks of selected industrial cities i...Evaluation of losses in distribution networks of selected industrial cities i...
Evaluation of losses in distribution networks of selected industrial cities i...Dr. Hachimenum Amadi
 
Blackout white paper_by_ieee_pes_ad_comm_final_082504
Blackout white paper_by_ieee_pes_ad_comm_final_082504Blackout white paper_by_ieee_pes_ad_comm_final_082504
Blackout white paper_by_ieee_pes_ad_comm_final_082504Shraddha Dwivedi
 
IRJET- Overloading Detection in Residentional Area
IRJET- Overloading Detection in Residentional AreaIRJET- Overloading Detection in Residentional Area
IRJET- Overloading Detection in Residentional AreaIRJET Journal
 
Effectiveness of energy sector quality management systems in response to elec...
Effectiveness of energy sector quality management systems in response to elec...Effectiveness of energy sector quality management systems in response to elec...
Effectiveness of energy sector quality management systems in response to elec...ELIJAH ONYANGO STANDSLAUSE ODHIAMBO
 
(U fouo) dhs infrastructure protection note- most significant tactics against...
(U fouo) dhs infrastructure protection note- most significant tactics against...(U fouo) dhs infrastructure protection note- most significant tactics against...
(U fouo) dhs infrastructure protection note- most significant tactics against...RepentSinner
 
(U fouo) dhs infrastructure protection note- most significant tactics against...
(U fouo) dhs infrastructure protection note- most significant tactics against...(U fouo) dhs infrastructure protection note- most significant tactics against...
(U fouo) dhs infrastructure protection note- most significant tactics against...AnonDownload
 
System Operational Challenges from the Energy Transition
System Operational Challenges from the Energy TransitionSystem Operational Challenges from the Energy Transition
System Operational Challenges from the Energy TransitionPower System Operation
 
Assessment of Energy Losses and Cost Implications in the Nigerian Distributio...
Assessment of Energy Losses and Cost Implications in the Nigerian Distributio...Assessment of Energy Losses and Cost Implications in the Nigerian Distributio...
Assessment of Energy Losses and Cost Implications in the Nigerian Distributio...Dr. Hachimenum Amadi
 
Influence choice of the injection nodes of energy source on on-line losses of...
Influence choice of the injection nodes of energy source on on-line losses of...Influence choice of the injection nodes of energy source on on-line losses of...
Influence choice of the injection nodes of energy source on on-line losses of...IJMER
 
Study on transmission energy losses and finding the hazards using what if ana...
Study on transmission energy losses and finding the hazards using what if ana...Study on transmission energy losses and finding the hazards using what if ana...
Study on transmission energy losses and finding the hazards using what if ana...eSAT Publishing House
 

Similar to A Model for Assessment of Power System Outages on Nigerian Transmission Network (20)

The Effects of Technical and Non Technical Losses on Power Outages in Nigeria
The Effects of Technical and Non Technical Losses on Power Outages in NigeriaThe Effects of Technical and Non Technical Losses on Power Outages in Nigeria
The Effects of Technical and Non Technical Losses on Power Outages in Nigeria
 
The Effects of Technical and Non-Technical Losses on Power Outages in Nigeria
The Effects of Technical and Non-Technical Losses on Power Outages in NigeriaThe Effects of Technical and Non-Technical Losses on Power Outages in Nigeria
The Effects of Technical and Non-Technical Losses on Power Outages in Nigeria
 
IRJET- Electric Power Distribution Network Performance Assessment based o...
IRJET-  	  Electric Power Distribution Network Performance Assessment based o...IRJET-  	  Electric Power Distribution Network Performance Assessment based o...
IRJET- Electric Power Distribution Network Performance Assessment based o...
 
Line loss
Line lossLine loss
Line loss
 
RELIABILITY EVALUATION OF A WIND POWER PLANT IN THE MID REGION OF KARNATAKA S...
RELIABILITY EVALUATION OF A WIND POWER PLANT IN THE MID REGION OF KARNATAKA S...RELIABILITY EVALUATION OF A WIND POWER PLANT IN THE MID REGION OF KARNATAKA S...
RELIABILITY EVALUATION OF A WIND POWER PLANT IN THE MID REGION OF KARNATAKA S...
 
Performance investigation of electricial power supply to owerri for higher pr...
Performance investigation of electricial power supply to owerri for higher pr...Performance investigation of electricial power supply to owerri for higher pr...
Performance investigation of electricial power supply to owerri for higher pr...
 
Performance investigation of electricial power supply to owerri for higher pr...
Performance investigation of electricial power supply to owerri for higher pr...Performance investigation of electricial power supply to owerri for higher pr...
Performance investigation of electricial power supply to owerri for higher pr...
 
Software Based Transmission Line Fault Analysis
Software Based Transmission Line Fault AnalysisSoftware Based Transmission Line Fault Analysis
Software Based Transmission Line Fault Analysis
 
Influencing Factors on Power Losses in Electric Distribution Network
Influencing Factors on Power Losses in Electric Distribution NetworkInfluencing Factors on Power Losses in Electric Distribution Network
Influencing Factors on Power Losses in Electric Distribution Network
 
B0314011017
B0314011017B0314011017
B0314011017
 
Evaluation of losses in distribution networks of selected industrial cities i...
Evaluation of losses in distribution networks of selected industrial cities i...Evaluation of losses in distribution networks of selected industrial cities i...
Evaluation of losses in distribution networks of selected industrial cities i...
 
Blackout white paper_by_ieee_pes_ad_comm_final_082504
Blackout white paper_by_ieee_pes_ad_comm_final_082504Blackout white paper_by_ieee_pes_ad_comm_final_082504
Blackout white paper_by_ieee_pes_ad_comm_final_082504
 
IRJET- Overloading Detection in Residentional Area
IRJET- Overloading Detection in Residentional AreaIRJET- Overloading Detection in Residentional Area
IRJET- Overloading Detection in Residentional Area
 
Effectiveness of energy sector quality management systems in response to elec...
Effectiveness of energy sector quality management systems in response to elec...Effectiveness of energy sector quality management systems in response to elec...
Effectiveness of energy sector quality management systems in response to elec...
 
(U fouo) dhs infrastructure protection note- most significant tactics against...
(U fouo) dhs infrastructure protection note- most significant tactics against...(U fouo) dhs infrastructure protection note- most significant tactics against...
(U fouo) dhs infrastructure protection note- most significant tactics against...
 
(U fouo) dhs infrastructure protection note- most significant tactics against...
(U fouo) dhs infrastructure protection note- most significant tactics against...(U fouo) dhs infrastructure protection note- most significant tactics against...
(U fouo) dhs infrastructure protection note- most significant tactics against...
 
System Operational Challenges from the Energy Transition
System Operational Challenges from the Energy TransitionSystem Operational Challenges from the Energy Transition
System Operational Challenges from the Energy Transition
 
Assessment of Energy Losses and Cost Implications in the Nigerian Distributio...
Assessment of Energy Losses and Cost Implications in the Nigerian Distributio...Assessment of Energy Losses and Cost Implications in the Nigerian Distributio...
Assessment of Energy Losses and Cost Implications in the Nigerian Distributio...
 
Influence choice of the injection nodes of energy source on on-line losses of...
Influence choice of the injection nodes of energy source on on-line losses of...Influence choice of the injection nodes of energy source on on-line losses of...
Influence choice of the injection nodes of energy source on on-line losses of...
 
Study on transmission energy losses and finding the hazards using what if ana...
Study on transmission energy losses and finding the hazards using what if ana...Study on transmission energy losses and finding the hazards using what if ana...
Study on transmission energy losses and finding the hazards using what if ana...
 

Recently uploaded

Partners Life - Insurer Innovation Award 2024
Partners Life - Insurer Innovation Award 2024Partners Life - Insurer Innovation Award 2024
Partners Life - Insurer Innovation Award 2024The Digital Insurer
 
Artificial Intelligence: Facts and Myths
Artificial Intelligence: Facts and MythsArtificial Intelligence: Facts and Myths
Artificial Intelligence: Facts and MythsJoaquim Jorge
 
Connector Corner: Accelerate revenue generation using UiPath API-centric busi...
Connector Corner: Accelerate revenue generation using UiPath API-centric busi...Connector Corner: Accelerate revenue generation using UiPath API-centric busi...
Connector Corner: Accelerate revenue generation using UiPath API-centric busi...DianaGray10
 
Workshop - Best of Both Worlds_ Combine KG and Vector search for enhanced R...
Workshop - Best of Both Worlds_ Combine  KG and Vector search for  enhanced R...Workshop - Best of Both Worlds_ Combine  KG and Vector search for  enhanced R...
Workshop - Best of Both Worlds_ Combine KG and Vector search for enhanced R...Neo4j
 
Mastering MySQL Database Architecture: Deep Dive into MySQL Shell and MySQL R...
Mastering MySQL Database Architecture: Deep Dive into MySQL Shell and MySQL R...Mastering MySQL Database Architecture: Deep Dive into MySQL Shell and MySQL R...
Mastering MySQL Database Architecture: Deep Dive into MySQL Shell and MySQL R...Miguel Araújo
 
Handwritten Text Recognition for manuscripts and early printed texts
Handwritten Text Recognition for manuscripts and early printed textsHandwritten Text Recognition for manuscripts and early printed texts
Handwritten Text Recognition for manuscripts and early printed textsMaria Levchenko
 
How to Troubleshoot Apps for the Modern Connected Worker
How to Troubleshoot Apps for the Modern Connected WorkerHow to Troubleshoot Apps for the Modern Connected Worker
How to Troubleshoot Apps for the Modern Connected WorkerThousandEyes
 
Tata AIG General Insurance Company - Insurer Innovation Award 2024
Tata AIG General Insurance Company - Insurer Innovation Award 2024Tata AIG General Insurance Company - Insurer Innovation Award 2024
Tata AIG General Insurance Company - Insurer Innovation Award 2024The Digital Insurer
 
GenAI Risks & Security Meetup 01052024.pdf
GenAI Risks & Security Meetup 01052024.pdfGenAI Risks & Security Meetup 01052024.pdf
GenAI Risks & Security Meetup 01052024.pdflior mazor
 
Apidays New York 2024 - The value of a flexible API Management solution for O...
Apidays New York 2024 - The value of a flexible API Management solution for O...Apidays New York 2024 - The value of a flexible API Management solution for O...
Apidays New York 2024 - The value of a flexible API Management solution for O...apidays
 
TrustArc Webinar - Stay Ahead of US State Data Privacy Law Developments
TrustArc Webinar - Stay Ahead of US State Data Privacy Law DevelopmentsTrustArc Webinar - Stay Ahead of US State Data Privacy Law Developments
TrustArc Webinar - Stay Ahead of US State Data Privacy Law DevelopmentsTrustArc
 
Boost PC performance: How more available memory can improve productivity
Boost PC performance: How more available memory can improve productivityBoost PC performance: How more available memory can improve productivity
Boost PC performance: How more available memory can improve productivityPrincipled Technologies
 
Axa Assurance Maroc - Insurer Innovation Award 2024
Axa Assurance Maroc - Insurer Innovation Award 2024Axa Assurance Maroc - Insurer Innovation Award 2024
Axa Assurance Maroc - Insurer Innovation Award 2024The Digital Insurer
 
TrustArc Webinar - Unlock the Power of AI-Driven Data Discovery
TrustArc Webinar - Unlock the Power of AI-Driven Data DiscoveryTrustArc Webinar - Unlock the Power of AI-Driven Data Discovery
TrustArc Webinar - Unlock the Power of AI-Driven Data DiscoveryTrustArc
 
Scaling API-first – The story of a global engineering organization
Scaling API-first – The story of a global engineering organizationScaling API-first – The story of a global engineering organization
Scaling API-first – The story of a global engineering organizationRadu Cotescu
 
Data Cloud, More than a CDP by Matt Robison
Data Cloud, More than a CDP by Matt RobisonData Cloud, More than a CDP by Matt Robison
Data Cloud, More than a CDP by Matt RobisonAnna Loughnan Colquhoun
 
[2024]Digital Global Overview Report 2024 Meltwater.pdf
[2024]Digital Global Overview Report 2024 Meltwater.pdf[2024]Digital Global Overview Report 2024 Meltwater.pdf
[2024]Digital Global Overview Report 2024 Meltwater.pdfhans926745
 
What Are The Drone Anti-jamming Systems Technology?
What Are The Drone Anti-jamming Systems Technology?What Are The Drone Anti-jamming Systems Technology?
What Are The Drone Anti-jamming Systems Technology?Antenna Manufacturer Coco
 
Understanding Discord NSFW Servers A Guide for Responsible Users.pdf
Understanding Discord NSFW Servers A Guide for Responsible Users.pdfUnderstanding Discord NSFW Servers A Guide for Responsible Users.pdf
Understanding Discord NSFW Servers A Guide for Responsible Users.pdfUK Journal
 
Advantages of Hiring UIUX Design Service Providers for Your Business
Advantages of Hiring UIUX Design Service Providers for Your BusinessAdvantages of Hiring UIUX Design Service Providers for Your Business
Advantages of Hiring UIUX Design Service Providers for Your BusinessPixlogix Infotech
 

Recently uploaded (20)

Partners Life - Insurer Innovation Award 2024
Partners Life - Insurer Innovation Award 2024Partners Life - Insurer Innovation Award 2024
Partners Life - Insurer Innovation Award 2024
 
Artificial Intelligence: Facts and Myths
Artificial Intelligence: Facts and MythsArtificial Intelligence: Facts and Myths
Artificial Intelligence: Facts and Myths
 
Connector Corner: Accelerate revenue generation using UiPath API-centric busi...
Connector Corner: Accelerate revenue generation using UiPath API-centric busi...Connector Corner: Accelerate revenue generation using UiPath API-centric busi...
Connector Corner: Accelerate revenue generation using UiPath API-centric busi...
 
Workshop - Best of Both Worlds_ Combine KG and Vector search for enhanced R...
Workshop - Best of Both Worlds_ Combine  KG and Vector search for  enhanced R...Workshop - Best of Both Worlds_ Combine  KG and Vector search for  enhanced R...
Workshop - Best of Both Worlds_ Combine KG and Vector search for enhanced R...
 
Mastering MySQL Database Architecture: Deep Dive into MySQL Shell and MySQL R...
Mastering MySQL Database Architecture: Deep Dive into MySQL Shell and MySQL R...Mastering MySQL Database Architecture: Deep Dive into MySQL Shell and MySQL R...
Mastering MySQL Database Architecture: Deep Dive into MySQL Shell and MySQL R...
 
Handwritten Text Recognition for manuscripts and early printed texts
Handwritten Text Recognition for manuscripts and early printed textsHandwritten Text Recognition for manuscripts and early printed texts
Handwritten Text Recognition for manuscripts and early printed texts
 
How to Troubleshoot Apps for the Modern Connected Worker
How to Troubleshoot Apps for the Modern Connected WorkerHow to Troubleshoot Apps for the Modern Connected Worker
How to Troubleshoot Apps for the Modern Connected Worker
 
Tata AIG General Insurance Company - Insurer Innovation Award 2024
Tata AIG General Insurance Company - Insurer Innovation Award 2024Tata AIG General Insurance Company - Insurer Innovation Award 2024
Tata AIG General Insurance Company - Insurer Innovation Award 2024
 
GenAI Risks & Security Meetup 01052024.pdf
GenAI Risks & Security Meetup 01052024.pdfGenAI Risks & Security Meetup 01052024.pdf
GenAI Risks & Security Meetup 01052024.pdf
 
Apidays New York 2024 - The value of a flexible API Management solution for O...
Apidays New York 2024 - The value of a flexible API Management solution for O...Apidays New York 2024 - The value of a flexible API Management solution for O...
Apidays New York 2024 - The value of a flexible API Management solution for O...
 
TrustArc Webinar - Stay Ahead of US State Data Privacy Law Developments
TrustArc Webinar - Stay Ahead of US State Data Privacy Law DevelopmentsTrustArc Webinar - Stay Ahead of US State Data Privacy Law Developments
TrustArc Webinar - Stay Ahead of US State Data Privacy Law Developments
 
Boost PC performance: How more available memory can improve productivity
Boost PC performance: How more available memory can improve productivityBoost PC performance: How more available memory can improve productivity
Boost PC performance: How more available memory can improve productivity
 
Axa Assurance Maroc - Insurer Innovation Award 2024
Axa Assurance Maroc - Insurer Innovation Award 2024Axa Assurance Maroc - Insurer Innovation Award 2024
Axa Assurance Maroc - Insurer Innovation Award 2024
 
TrustArc Webinar - Unlock the Power of AI-Driven Data Discovery
TrustArc Webinar - Unlock the Power of AI-Driven Data DiscoveryTrustArc Webinar - Unlock the Power of AI-Driven Data Discovery
TrustArc Webinar - Unlock the Power of AI-Driven Data Discovery
 
Scaling API-first – The story of a global engineering organization
Scaling API-first – The story of a global engineering organizationScaling API-first – The story of a global engineering organization
Scaling API-first – The story of a global engineering organization
 
Data Cloud, More than a CDP by Matt Robison
Data Cloud, More than a CDP by Matt RobisonData Cloud, More than a CDP by Matt Robison
Data Cloud, More than a CDP by Matt Robison
 
[2024]Digital Global Overview Report 2024 Meltwater.pdf
[2024]Digital Global Overview Report 2024 Meltwater.pdf[2024]Digital Global Overview Report 2024 Meltwater.pdf
[2024]Digital Global Overview Report 2024 Meltwater.pdf
 
What Are The Drone Anti-jamming Systems Technology?
What Are The Drone Anti-jamming Systems Technology?What Are The Drone Anti-jamming Systems Technology?
What Are The Drone Anti-jamming Systems Technology?
 
Understanding Discord NSFW Servers A Guide for Responsible Users.pdf
Understanding Discord NSFW Servers A Guide for Responsible Users.pdfUnderstanding Discord NSFW Servers A Guide for Responsible Users.pdf
Understanding Discord NSFW Servers A Guide for Responsible Users.pdf
 
Advantages of Hiring UIUX Design Service Providers for Your Business
Advantages of Hiring UIUX Design Service Providers for Your BusinessAdvantages of Hiring UIUX Design Service Providers for Your Business
Advantages of Hiring UIUX Design Service Providers for Your Business
 

A Model for Assessment of Power System Outages on Nigerian Transmission Network

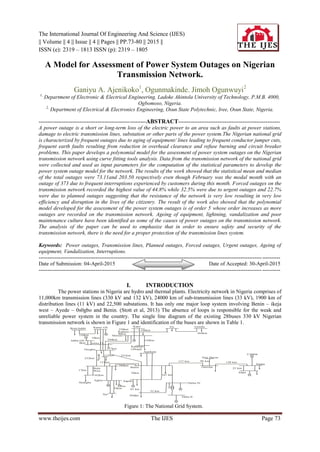
  • 1. The International Journal Of Engineering And Science (IJES) || Volume || 4 || Issue || 4 || Pages || PP.73-80 || 2015 || ISSN (e): 2319 – 1813 ISSN (p): 2319 – 1805 www.theijes.com The IJES Page 73 A Model for Assessment of Power System Outages on Nigerian Transmission Network. Ganiyu A. Ajenikoko1 , Ogunmakinde. Jimoh Ogunwuyi2 1, Department of Electronic & Electrical Engineering, Ladoke Akintola University of Technology, P.M.B. 4000, Ogbomoso, Nigeria. 2, Department of Electrical & Electronics Engineering, Osun State Polytechnic, Iree, Osun State, Nigeria. ------------------------------------------------------------ABSTRACT--------------------------------------------------------- A power outage is a short or long-term loss of the electric power to an area such as faults at power stations, damage to electric transmission lines, substation or other parts of the power system.The Nigerian national grid is characterized by frequent outages due to aging of equipment/ lines leading to frequent conductor jumper cuts, frequent earth faults resulting from reduction in overhead clearance and refuse burning and circuit breaker problems. This paper develops a polynomial model for the assessment of power system outages on the Nigerian transmission network using curve fitting tools analysis. Data from the transmission network of the national grid were collected and used as input parameters for the computation of the statistical parameters to develop the power system outage model for the network. The results of the work showed that the statistical mean and median of the total outages were 73.11and 203.50 respectively even though February was the modal month with an outage of 373 due to frequent interruptions experienced by customers during this month. Forced outages on the transmission network recorded the highest value of 44.8% while 32.5% were due to urgent outages and 22.7% were due to planned outages suggesting that the resistance of the network is very low resulting in very low efficiency and disruption in the lives of the citizenry. The result of the work also showed that the polynomial model developed for the assessment of the power system outages is of order 5 whose order increases as more outages are recorded on the transmission network. Ageing of equipment, lightning, vandalization and poor maintenance culture have been identified as some of the causes of power outages on the transmission network. The analysis of the paper can be used to emphasize that in order to ensure safety and security of the transmission network, there is the need for a proper protection of the transmission lines system. Keywords: Power outages, Transmission lines, Planned outages, Forced outages, Urgent outages, Ageing of equipment, Vandalization, Interruptions. --------------------------------------------------------------------------------------------------------------------------------------- Date of Submission: 04-April-2015 Date of Accepted: 30-April-2015 --------------------------------------------------------------------------------------------------------------------------------------- I. INTRODUCTION The power stations in Nigeria are hydro and thermal plants. Electricity network in Nigeria comprises of 11,000km transmission lines (330 kV and 132 kV), 24000 km of sub-transmission lines (33 kV), 1900 km of distribution lines (11 kV) and 22,500 substations. It has only one major loop system involving Benin – ikeja west – Ayede – 0s0gbo and Benin. (Stott et al, 2013) The absence of loops is responsible for the weak and unreliable power system in the country. The single line diagram of the existing 28buses 330 kV Nigerian transmission network is shown in Figure 1 and identification of the buses are shown in Table 1. Birni kebbi Kainji GS Kano Jos Gombe 196km Kaduna 230km 96km Shiroro 244km 157km 251km Katampe (Abuja) Ajaokuta 137 km 96 km New Haven Onitsha 138 km 25 km Afam Aladja Calabar 107 km Delta IV Delta II 32 km 63 km Aladja Sapele 50km Benin Aes 16km Aja Egbin Akangba 62km Ikeja West17km 115km 137km Aiyede 252km Osogbo Jebba GS 8km Jebba TS 18km 310km 144km 264km 280km Figure 1: The National Grid System.
  • 2. A Model For Assessment Of Power… www.theijes.com The IJES Page 74 Table 1: Identification of the buses.. Electric power is generated and sent over transmission lines to substations which reduce the voltage level for distribution to end – users Power outages can result from seasonal storms which often combine the furies of wind, rain, snow or ice. The more severe weather events usually cause the greatest damage to electric power transmission and distribution infrastructure as damage can result from trees or branches falling on electricity lines (Tinney et al, 2005). Power outages can affect manufacturing operations mainly through down time as workers are idled..It can damage equipment and production processes and also disrupt many other electric power dependent activities (Zollenkopf 2001). High winds especially when combined with precipitation from seasonal storms, can cause damage to electricity utility systems, resulting in service interruptions to large number of electricity consumers, while most such power outages are caused by damage from trees and tree limits falling on local electricity distribution lines, which carry bulk power over long distances. Depending on the severity of the storm and resulting impairment, power outages can last a few hours or extend to periods of several days. This in turn can have real economic effects as power outages can impact businesses, through lost orders and damage to perishable goods and inventories (Grainger and Stevenson 2004). Types of power outages. Power outages are categorized into three phenomena relating to the duration and effect of the outage. A transient fault is a momentary loss of power which is caused by a temporary fault on a power line. In this case, power is automatically restored once a fault is cleared. A blown-out or a sag is a drop in voltage in an electrical power supply which can cause poor performance of the equipment or even incorrect operation (Shoults 2004, Mehta and Madent 2006)... A black-out refers to the total loss of power to an area and is the most severe form of power outage that can occur. Outages may last from a few minutes to a few weeks depending on the nature of the black-out and the configuration of the electrical network(Donald et al 2013, Bruce and Allen, 2006). Mitigation of power outage frequency. There are four mitigation networks namely: Increasing the critical number of failures causing cascading blackouts which decreases the frequency of the smaller blackouts and increase that of larger blackouts. Increasing individual power line maximum load which increases the frequency of smaller blackouts and decreases that of larger blackouts (Stott et al 2013, Momoh 2001).
  • 3. A Model For Assessment Of Power… www.theijes.com The IJES Page 75 Combination of increasing critical number and maximum load of lines which have a significance on either side of blackout..The resulting minor reduction in the frequency of blackouts is projected not to worth the cost of the implementation. Increasing the excess power available on the grid decreases the frequency of smaller blackouts and increases that of larger blackout (Clements et al 2014, Preston et al 2007, Pabio 2001) .. II. MATERIALS AND METHOD. In this research paper, the following procedural steps were taken: i. The statistical parameters such as mean, median, mode, standard deviation and variance were identified. ii. Data were collected on the transmission power outage based on annual reports for the study using the utility logbooks. iii. The power outages in the network were analyzed and the indentified statistical parameters were computed. iv. A power system outage model is developed using Curve fitting tools. III. DISCUSSION OF RESULTS. Figure 1 shows the variation of the planned outages versus the time from 2001 to 2005 (for each of the five years study period).In the months of January, June and November of year 2001, there was no planned outage at all due to the proper functioning of the equipment. The planned outages fluctuated between 1 outage in April 2001 and 8 outages in August in the same year, thus the total recorded planned outage was 35 in the year.. In year 2002, a least planned outage of 2 was recorded in March and June as a result of fewer numbers of interruptions experienced by the customers attached to the affected feeders. Planned outages were recorded in January, February and December due to the overloading of the transformers. The number of planned outages fluctuated over the months with a least planned outages of 2 in March, June and August, even though, a peak outage of 14 was recorded in January, February and December. There was a total of 101 planned outages which represents a high percentage increase in the planned outage as compared to 2001 due to poor maintenance culture on the transmission line equipment. In 2003 the month of April recorded a least planned outages of 2 while in September of this same year, a total planned outages of 15 were recorded which appeared to be the highest in that year because many of the transformers on the lines were experiencing overloading which led to very low voltages. In 2004, the number of planned outages fluctuated appreciably with a least planned outages of 10 recorded in June due to lesser number of interruptions experienced by all the customers attached to these feeders in the month. There were 23 planned outages in October which appeared to be the highest in that year. In the year, there were 190 planned outages recorded implying that the maintenance culture on the equipment declined as more outages were noticed and recorded in 2004 unlike in 2003 where the number of planned outages was 90. In 2005, December recorded the least planned outages which could be due to the adequate and efficient maintenance culture as well as the determination to keep the machines/equipment in good working conditions before the beginning of the following year. In February and November, a largest planned outages of 20 were recorded. The first 20 outages recorded in February 2005 was due to prolonged interruptions experienced in this month while in November, the 20 planned outages was as a result of decline in the maintenance culture on the system equipment. The total number of planned outages in 2005 was 181 which was a decline in planned outages as compared to the previous year. It is observed that throughout the five years used as case studies, the month of April recorded the least planned outages of 36 which could be due to appropriate and adequate maintenance culture on the system equipment in this month. September has a highest planned outages of 67 throughout the study period due to failure to clear most of the prolonged faults on the feeders. 14 planned outages were recorded in January, February and December because of the overloading of the transformers. The number of planned outages fluctuated over the months of the year with a least planned outage of 2 recorded in March, June and August and a peak outage of 14 recorded in January, February and December. There was a total of 101 planned outages which represents an appreciable increase in the planned outage as compared to 2001 due to poor maintenance culture on the transmission line equipment. The statistical mean, median and the mode for planned outages during the five years study period are 49.8, 50 and 67 respectively even though the modal month was September. The relationship between the forced outages and the time for the five years study period is shown in Figure 2. In 2001, a total of 244 forced outages were recorded out of which only 3 were recorded in July because most of the equipment were functioning effectively and with adequate maintenance during the month and 38 forced outages were recorded in February which could be traced to transmission line constraints on the feeders during this month. In 2002, only 5 forced outages were noted in May and 35 forced outages were recorded in June and December which could be traced to vandalization of the lines.
  • 4. A Model For Assessment Of Power… www.theijes.com The IJES Page 76 In 2003, only 4 forced outages were recorded in March while 42 forced outages were recorded in December. The maintenance culture on the system equipment declined appreciably and many interruptions were experienced by all the customer attached to the feeders. In 2004, there were 15 forced outages in April while in June, there were 30 forced outages even through, the forced outages fluctuated throughout the year .The statistical mean, median and mode for the forced outages were 98.3, 88.5 and 192 respectively even though, February was the modal month. The variation of the urgent outages with time is shown in Figure 3. In 2001, the least urgent outage was 8 and this occurred in June, August and December while the highest urgent outages of 19 were recorded in February due to shunt reactor problems experienced this month. In 2002, there were 18 urgent outages in April and 7 outages in August as a result of corrective maintenance practices on the transmission lines. In 2003, the urgent outages recorded in February, June, August and October were 125, 27, 8 and 3 outages respectively representing a drastic fall in outages over the year because the distribution transformers were well protected and very long and fragile lines were re-enforced to improve the voltage stability and efficiency of the network.. In 2005, the recorded urgent outages in February and June were 21 and 2 outages respectively because of the prolonged interruptions experienced on the lines in February suggesting that the resistance of the network was very low and resulting in very low efficiency and disruption in the lives of the citizenry. Frequent outages which are due to aging of equipment / lines are some of the characteristics of Nigeria transmission network. These result in frequent conductor/jumper cuts, frequent earth faults and circuit breaker problems. The statistical parameters (mean, median and mode) for urgent outages were 71.6, 61 and 192 even though, February was the modal month. The total planned outages vary with time on monthly basis as illustrated in Figure 4. During the five years study period: a total of 40 planned outages were recorded in June which is more than half of the total planned outages recorded and this is evident from the figure. Figure 5 shows the graphical representation of how the total forced outages vary with time on monthly basis. A total of 120 forced outages were recorded in June during the five years study period. Figure 6 illustrates the variation of total urgent outages with time on monthly basis. A total of 190 urgent outages were recorded in February throughout the five years study period. This is the maximum total urgent outages recorded. The relationship between the planned outages and the time in years is illustrated in Figure 7. Figure 8 shows how the forced outages vary with time on a yearly basis while the variation of the urgent outages with time on a yearly basis is also illustrated in Figure 9. The relationship between each of the three outages (planned, forced and urgent) and time on monthly basis is shown in Figure 10. It is evident from the figure that a total of 190 urgent outages were recorded in February, 50 forced outages were recorded in October and 55 planned outages were recorded in November. Figure 11 shows the variation of combined outages with time on monthly basis. During the five years study period, a total of 210 outages were recorded in March as evident from the figure. The model developed for the assessment of the transmission network is y = 0.080x5 – 2.668x4 + 32.33x3 - 171.0x2 + 351x + 75.04, R2 = 0.965 Where y = total outages, x = time R2 = coefficient of determination. R2 shows the extent of the relationship between the total outages recorded on the transmission network and the time. The model is a polynomial of order 5 whose order increases as more outages are recorded on the transmission network. IV. CONCLUSION. A polynomial model of order 5 has been developed for the assessment of power outages on the Nigeria transmission network. The analysis of the work showed that out of a total of 2632 outages recorded on the 132 kV and 330 kV transmission networks, forced outages recorded the highest value of 44.8% while 32.5% were due to urgent outages and the rest were due to planned outages suggesting the need for a proper protection of the transmission line systems.
  • 5. A Model For Assessment Of Power… www.theijes.com The IJES Page 77 Figure 1: Planned outages Versus Time for 5years Figure 2: Forced Outages versus Time for 5years Figure 3: Urgent Outages versus Time for 5years 0 5 10 15 20 25 Jan Feb Mar Apr May Jun Jul Aug Sep Oct Nov Dec 2001 2002 2003 2004 2005 0 5 10 15 20 25 30 35 40 45 Jan Feb Mar Apr May Jun Jul Aug Sep Oct Nov Dec 2001 2002 2003 2004 2005 0 20 40 60 80 100 120 140 Jan Feb Mar Apr May Jun Jul Aug Sep Oct Nov Dec 2001 2002 2003 2004 2005 Plannedoutages Time (Month) ForcedOutages Time (Month) Time (Month) UrgentOutages
  • 6. A Model For Assessment Of Power… www.theijes.com The IJES Page 78 Figure 4: Total Planned Outages versus Time in Months Figure 5: Total Forced Outages versus Time in Months Figure 6: Total Urgent Outages versus Time in Months 0 10 20 30 40 50 60 70 80 Jan Feb Mar Apr May Jun Jul Aug Sep Oct Nov Dec 0 20 40 60 80 100 120 140 160 Jan Feb Mar Apr May Jun Jul Aug Sep Oct Nov Dec 0 50 100 150 200 250 Jan Feb Mar Apr May Jun Jul Aug Sep Oct Nov Dec TotalPlannedOutages TotalForcedOutages TotalUrgentOutages Time (Months)
  • 7. A Model For Assessment Of Power… www.theijes.com The IJES Page 79 Figure 7: Planned Outages versus Time in Years Figure 8: Forced Outages versus Time in Years Figure 9: Urgent Outages versus Time in Years 0 50 100 150 200 2001 2002 2003 2004 2005 0 50 100 150 200 250 300 2001 2002 2003 2004 2005 0 50 100 150 200 250 300 350 2001 2002 2003 2004 2005 PlannedOutagesForcedOutageUrgentOutage
  • 8. A Model For Assessment Of Power… www.theijes.com The IJES Page 80 Figure 10: Planned, Forced and Urgent Outages versus Time (Months) Figure 11: Total outages versus time (months) REFERENCES [1] Bruce F and Allen J. W (2006):”Power generation, operation and Control,” John Wiley and Sons Inc, Second Edition, Pp 44-64. [2] Clements K.A, Lam B.P, David J, Lawrence Y and Reppen N.D (2014): ”Computation of upper and lower bounds on reliability indices for bulk power system,” IEEE T-PAS, Vol. 103, No. 8, Pp. 2318 – 2324. [3] Donald G, Fink T and Wayne H B (2013):”Standard Handbook for Electrical Engineers,” McGrew Hill International Edition, Pp 98-104. [4] Grainger J. J and Stevenson W.D (2004):” Power system analysis,”McGraw-Hill, New York, 5th Editions, Pp. 591 – 620. [5] Mehta V.K and Madent R(2006):”Principles of Power system.” Chand and Co Ltd New Delhi, Third Edition, Pp 87-95. [6] Momoh A.J (2001) “Power System: Application of Optimization Principles,” Marcel Delker Inc, 3rd Editions, Pp 31 – 37 [7] Pablo A.S (2001):”Electrical Power Distribution,” Fourth Edition, Chand and Co Ltd New Delhi, Pp 23-36. [8] Preston E, Grady M and Baughman M(2007): ” A new planning model for assessment of the effects of transmission capacity constraints on the reliability of generation supply for large non equivalence electric network,” IEEE T-PAS, Vol. 12, No. 3, Pp. 1367 – 1373. [9] Shoults R.R (2004):”Application of fast linear AC power flow to contingency simulation and optimal control of power systems,” Ph.D. Dissertation, The University of Taxes at Arlington, Arlington, Pp 65-86. [10] Stott B Tinney W.F and Sparsity R(2013): “Oriented compensation methods for modified network solution,” IEEE T-PAS, Vol. 102, No. 5, Pp. 1050 – 1060. [11] Tinney W.F, ,Brandwajn W.B and Chan S.M(2005):”Sparse vector methods,” IEEE T-PAS, Vol. 104, No. 2, Pp. 295 – 301. [12] Zollenkopf K (2001):”Basic computational algorithm and programming techniques”; A paper from large sparse sets of linear equations. Pp 75 – 96. 0 50 100 150 200 250 Jan Feb Mar Apr May Jun Jul Aug Sep Oct Nov Dec Totalplanned Total Forced Total Urgent 0 50 100 150 200 250 300 350 400 Jan Feb Mar Apr May Jun Jul Aug Sep Oct Nov Dec Totaloutages Time [month] Time (Month) TotalOutages