
Recommended
More Related Content
Similar to 3. Secondary Data, Online Information Databases, and Measurement.docx
Similar to 3. Secondary Data, Online Information Databases, and Measurement.docx (20)
More from tamicawaysmith
More from tamicawaysmith (20)
Recently uploaded
Recently uploaded (20)
3. Secondary Data, Online Information Databases, and Measurement.docx
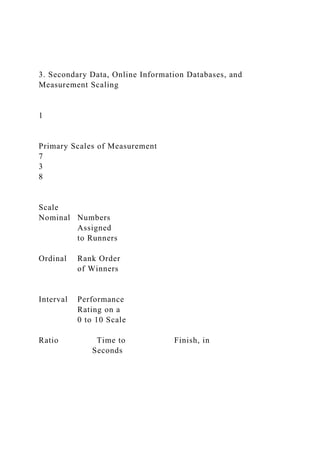
- 1. 3. Secondary Data, Online Information Databases, and Measurement Scaling 1 Primary Scales of Measurement 7 3 8 Scale Nominal Numbers Assigned to Runners Ordinal Rank Order of Winners Interval Performance Rating on a 0 to 10 Scale Ratio Time to Finish, in Seconds
- 2. Third place Second place First place Finish Finish 8.2 9.1 9.6 15.2 14.1 13.4 Primary Scales of Measurement Nominal Scale: The numbers serve only as labels or tags for identifying and classifying objects. Ordinal Scale: A ranking scale Interval Scale: Numerically equal distances on the scale represent equal values in the characteristic being measured. Ratio Scale: Possesses all the properties of the nominal, ordinal, and interval scales. It has an absolute zero point.
- 3. Illustration of Scales of Measurement Nominal Ordinal Ratio Scale Scale Scale Preference $ spent last No. Store Rankings 3 months 1. Parisian 2. Macy’s 3. Kmart 4. Kohl’s 5. J.C. Penney 6. Neiman Marcus 7. Marshalls 8. Saks Fifth Avenue 9. Sears 10.Wal-Mart Interval Scale Preference Ratings 1-7 A Classification of Scaling Techniques Comparative Scaling Techniques
- 4. Paired Comparison Scaling A respondent is presented with two objects and asked to select one according to some criterion. The data obtained are ordinal in nature. Paired comparison scaling is the most widely-used comparative scaling technique. With n brands, [n(n - 1) /2] paired comparisons are required. Under the assumption of transitivity, it is possible to convert paired comparison data to a rank order. Obtaining Shampoo Preferences Using Paired Comparisons Instructions: We are going to present you with ten pairs of shampoo brands. For each pair, please indicate which one of the two brands of shampoo you would prefer for personal use. Recording Form: aA 1 in a particular box means that the brand in that column was preferred over the brand in the corresponding row. A 0 means that the row brand was preferred over the column brand.
- 5. bThe number of times a brand was preferred is obtained by summing the 1s in each column. Paired Comparison Selling The most common method of taste testing is paired comparison. The consumer is asked to sample two different products and select the one with the most appealing taste. The test is done in private and a minimum of 1,000 responses is considered an adequate sample. A blind taste test for a soft drink, where imagery, self-perception and brand reputation are very important factors in the consumer’s purchasing decision, may not be a good indicator of performance in the marketplace. The introduction of New Coke illustrates this point. New Coke was heavily favored in blind paired comparison taste tests, but its introduction was less than successful, because image plays a major role in the purchase of Coke. A paired comparison taste test Preference for Toothpaste Brands Using Rank Order Scaling Instructions: Rank the various brands of toothpaste in order of preference. Begin by picking out the one brand that you like most and assign it a number 1. Then find the second most preferred brand and assign it a number 2. Continue this procedure until you have ranked all the brands of toothpaste in order of preference. The least preferred brand should be assigned a rank of 10.
- 6. No two brands should receive the same rank number. The criterion of preference is entirely up to you. There is no right or wrong answer. Just try to be consistent. Comparative Scaling Techniques Constant Sum Scaling Respondents allocate a constant sum of units, such as 100 points to attributes of a product to reflect their importance. If an attribute is unimportant, the respondent assigns it zero points. If an attribute is twice as important as some other attribute, it receives twice as many points. The sum of all the points is 100. Hence, the name of the scale. Importance of Bathing Soap Attributes Using a Constant Sum Scale Instructions There are eight attributes of bathing soaps. Please allocate 100 points among the attributes so that your allocation reflects the relative importance you attach to each attribute. The more points an attribute receives, the more important the attribute is. If an attribute is not at all important, assign it zero points. If an attribute is twice as important as some other attribute, it should receive twice as many points.
- 7. Form Average Responses of Three Segments Attribute Segment I Segment II Segment III 1. Mildness 2. Lather 3. Shrinkage 4. Price 5. Fragrance 6. Packaging 7. Moisturizing 8. Cleaning Power Sum 8 2 4 2 4 17
- 9. 100 100 100 Importance of Bathing Soap Attributes Using a Constant Sum Scale Noncomparative Scaling Techniques Respondents evaluate only one object at a time. Non-comparative techniques consist of continuous and itemized rating scales. A Classification of Scaling Techniques Continuous Rating Scale Respondents rate the objects by placing a mark at the appropriate position on a line that runs from one extreme of the criterion variable to the other. The form of the continuous scale may vary considerably. Very bad Neither good Very good nor bad Probably the worst - - - - - - -I - - - - - - - - - - - - - - - - - - - - - - - - - - Probably the best 0 10 20 30 40 50 60 70 80 90 100
- 10. A relatively new research tool, the perception analyzer, provides continuous measurement of “gut reaction.” A group of up to 400 respondents is presented with TV or radio spots or advertising copy. The measuring device consists of a dial that contains a 100-point range. Each participant is given a dial and instructed to continuously record his or her reaction to the material being tested. As the respondents turn the dials, the information is fed to a computer, which tabulates second-by-second response profiles. As the results are recorded by the computer, they are superimposed on a video screen, enabling the researcher to view the respondents' scores immediately. The responses are also stored in a permanent data file for use in further analysis. The response scores can be broken down by categories, such as age, income, sex, or product usage. RATE: Rapid Analysis and Testing Environment Itemized Rating Scales The respondents are provided with a scale that has a number or brief description associated with each category. Respondents are required to select the specified category that best describes the object being rated. The commonly used itemized rating scales are the Likert, semantic differential, and Stapel scales. Likert Scale The Likert scale requires the respondents to indicate a degree of agreement or disagreement with each of a series of statements about the stimulus objects. Strongly Disagree Neither Agree
- 11. Strongly disagree agree nor agree disagree 1. Sears sells high quality merchandise. 1 2 3 4 5 2. Sears has poor in-store service. 1 2 3 4 5 3. I like to shop at Sears. 1 2 3 4 5 The analysis can be conducted on an item-by-item basis (profile analysis), or a total (summated) score can be calculated. When arriving at a total score, the categories assigned to the negative statements by the respondents should be scored by reversing the scale. Semantic Differential Scale The semantic differential is a seven-point rating scale with end points associated with bipolar labels that have semantic meaning. SEARS IS: Powerful --:--:--:--:-X-:--:--: Weak Unreliable --:--:--:--:--:-X-:--: Reliable Modern --:--:--:--:--:--:-X-: Old-fashioned The negative adjective or phrase sometimes appears at the left side of the scale and sometimes at the right. This controls the tendency of some respondents, particularly those with very positive or very negative attitudes, to mark the right- or left-hand sides without reading the labels of SA or SD. Individual items on a semantic differential scale may be scored on either a -3 to +3 or a 1 to 7 scale.
- 12. A Semantic Differential Scale for Measuring Self- Concepts, Person Concepts, and Product Concepts 1) Rugged :---:---:---:---:---:---:---: Delicate 2) Excitable :---:---:---:---:---:---:---: Calm 3) Uncomfortable :---:---:---:---:---:---:---: Comfortable 4) Dominating :---:---:---:---:---:---:---: Submissive 5) Thrifty :---:---:---:---:---:---:---: Indulgent 6) Pleasant :---:---:---:---:---:---:---: Unpleasant 7) Contemporary :---:---:---:---:---:---:---: Obsolete 8) Organized :---:---:---:---:---:---:---: Unorganized 9) Rational :---:---:---:---:---:---:---: Emotional 10) Youthful :---:---:---:---:---:---:---: Mature 11) Formal :---:---:---:---:---:---:---: Informal 12) Orthodox :---:---:---:---:---:---:---: Liberal 13) Complex :---:---:---:---:---:---:---: Simple 14) Colorless :---:---:---:---:---:---:---: Colorful 15) Modest :---:---:---:---:---:---:---: Vain Stapel Scale The Stapel scale is a unipolar rating scale with ten categories numbered from -5 to +5, without a neutral point (zero). This
- 13. scale is usually presented vertically. When thinking about Data Mining Technologies, Inc. (DMT), do you believe that the word "innovative" aptly describes or poorly describes the company? On a scale of +5 to -5 with +5 being "very good description of DMT" and -5 being "poor description of DMT," how do you rank DMT according to the word "innovative"? (+5) Describes very well (+4) (+3) (+2) (+1) Innovative (-1) (-2) (-3) (-4) (-5) Poorly Describes The data obtained by using a Stapel scale can be analyzed in the same way as semantic differential data. Stapel scale example Scale Basic Characteristics Examples
- 14. Advantages Disadvantages Continuous Rating Scale Place a mark on a continuous line Reaction to TV commercials Easy to construct Scoring can be cumbersome unless computerized Itemized Rating Scales Likert Scale Degrees of agreement on a 1 (strongly disagree) to 5 (strongly agree) scale
- 15. Measurement of attitudes Easy to construct, administer, and understand More time - consuming Semantic Differential Seven - point scale with bipolar labels Brand, product, and company images Versatile Controversy as to whether the data are interval Stapel Scale Unipolar ten
- 16. - point scale, - 5 to +5, witho ut a neutral point (zero) Measurement of attitudes and images Easy to construct, administer over telephone Confusing and difficult to apply Basic Noncomparative Scales 4. Questionnaire Design MBA644 Marketing Research Dr. Sheng Barry University 24
- 17. Questionnaire Definition A questionnaire is a formalized set of questions for obtaining information from respondents. A questionnaire must translate the information needed into a set of specific questions that the respondents can and will answer. A questionnaire must uplift, motivate, and encourage the respondent to become involved in the interview, to cooperate, and to complete the interview. A questionnaire should minimize response error. Items and questions in a questionnaire Design the Question to Overcome the Respondent’s Inability and Unwillingness to Answer Determine the Content of Individual Questions Decide the Question Structure Determine the Question Wording Arrange the Questions in Proper Order
- 18. Reproduce the Questionnaire Specify the Type of Interviewing Method Identify the Form and Layout Eliminate Bugs by Pre-testing Questionnaire Design Process Specify The Information Needed Questionnaire Design Mail Questionnaire Please rank order the following department stores in order of your preference to shop at these stores. Begin by picking out the one store that you like most and assign it a number 1. Then find the second most preferred department store and assign it a number 2. Continue this procedure until you have ranked all the stores in order of preference. The least preferred store should be assigned a rank of 10. No two stores should receive the same rank number. Store Rank Order 1. Parisian ____________ 2. Macy's ____________ . Wal-Mart ____________ Electronic Questionnaire This question for e-mail and Internet questionnaires will be very similar to that for the mail questionnaire. In all these methods, the questionnaire is self-administered by
- 19. the respondent. Questionnaire Design Telephone Questionnaire I will read to you the names of some department stores. Please rate them in terms of your preference to shop at these stores. Use a ten-point scale, where 1 denotes not so preferred and 10 denotes greatly preferred. Numbers between 1 and 10 reflect intermediate degrees of preference. Again, please remember that the higher the number, the greater the degree of preference. Now, please tell me your preference to shop at .......(READ ONE STORE AT A TIME) Store Not So Greatly Preferred Preferred 1. Parisian 1 2 3 4 5 6 7 8 9 10 2. Macy's 1 2 3 4 5 6 7 8 9 10 . . . 10. Wal-Mart 1 2 3 4 5 6 7 8 9 10 Questionnaire Design Personal Questionnaire (HAND DEPARTMENT STORE CARDS TO THE RESPONDENT). Here is a set of department store names, each
- 20. written on a separate card. Please examine these cards carefully. (GIVE RESPONDENT TIME). Now, please examine these cards again and pull out that card which has the name of the store you like the most, i.e., your most preferred store for shopping. (RECORD THE STORE NAME AND KEEP THIS CARD WITH YOU). Now, please examine the remaining nine cards. Of these remaining nine stores, what is your most preferred store for shopping? (REPEAT THIS PROCEDURE SEQUENTIALLY UNTIL THE RESPONDENT HAS ONLY ONE CARD LEFT) Store Rank Name of the Store 1. 1 __________________ 2. 2 __________________ . 10. 10 __________________ Design the Question to Overcome the Respondent’s Inability and Unwillingness to Answer Determine the Content of Individual Questions Decide the Question Structure Determine the Question Wording
- 21. Arrange the Questions in Proper Order Reproduce the Questionnaire Specify the Type of Interviewing Method Identify the Form and Layout Eliminate Bugs by Pre-testing Questionnaire Design Process Specify The Information Needed Individual Question Content Sometimes, several questions are needed to obtain the required information in an unambiguous manner. Consider the question: “Do you think Coca-Cola is a tasty and refreshing soft drink?” (Incorrect) Such a question is called a double-barreled question, because two or more questions are combined into one.To obtain the required information, two distinct questions should be asked: “Do you think Coca-Cola is a tasty soft drink?” and “Do you think Coca-Cola is a refreshing soft drink?” (Correct) Overcoming Inability To Answer – Is the Respondent Informed?
- 22. In situations where not all respondents are likely to be informed about the topic of interest, filter questions that measure familiarity and past experience should be asked before questions about the topics themselves. Filter items allow the elimination of unqualified respondents during post-processing (e.g., respondents who lack minimum information to respond correctly). Overcoming Inability To Answer – Can the Respondent Remember? People's ability to recall the past is limited. The more current and specific the question reference, the better. If recall is necessary, the time frame should be as recent as possible and not over six months unless the reference is to major events (ex., marriage, changing jobs, buying a car). How many gallons of soft drinks did you consume during the last four weeks? (Incorrect) How often do you consume soft drinks in a typical week? (Correct) 1. ___ Less than once a week 2. ___ 1 to 3 times per week 3. ___ 4 to 6 times per week 4. ___ 7 or more times per week Overcoming Inability To Answer – Can the Respondent Articulate? Respondents may be unable to articulate certain types of responses, e.g., describe the atmosphere of a department store. Respondents should be given aids, such as pictures, maps, and descriptions to help them articulate their responses.
- 23. Overcoming Unwillingness To Answer- Effort Required of the Respondents Most respondents are unwilling to devote a lot of effort to provide information. E.g., Please list all the departments from which you purchased merchandise on your most recent shopping trip to a department store. (Incorrect) In the list that follows, please check all the departments from which you purchased merchandise on your most recent shopping trip to a department store. 1. Women's dresses ____ 2. Men's apparel ____ 3. Children's apparel ____ 4. Cosmetics ____ . 16. Jewelry ____ 17. Other (please specify) ____ (Correct) Overcoming Unwillingness To Answer – more concerns Context Respondents are unwilling to respond to questions which they consider to be inappropriate for the given context. The researcher should manipulate the context so that the request for information seems appropriate. Legitimate Purpose Explaining why the data are needed can make the request for the information seem legitimate and increase the respondents' willingness to answer.
- 24. Sensitive Information Respondents are unwilling to disclose, at least accurately, sensitive information because this may cause embarrassment or threaten the respondent's prestige or self-image. Overcoming Unwillingness To Answer – Increasing the Willingness of Respondents Place sensitive topics at the end of the questionnaire. Preface the question with a statement that the behavior of interest is common. Ask the question using the third-person technique: phrase the question as if it referred to other people. Hide the question in a group of other questions which respondents are willing to answer. The entire list of questions can then be asked quickly. Provide response categories rather than asking for specific figures. Use randomized techniques. Design the Question to Overcome the Respondent’s Inability and Unwillingness to Answer Determine the Content of Individual Questions Decide the Question Structure
- 25. Determine the Question Wording Arrange the Questions in Proper Order Reproduce the Questionnaire Specify the Type of Interviewing Method Identify the Form and Layout Eliminate Bugs by Pre-testing Questionnaire Design Process Specify The Information Needed Choosing Question Structure Unstructured questions are open-ended questions that respondents answer in their own words. What is your occupation? Who is your favorite actor? What do you think about people who shop at high-end department stores? Structured questions specify the set of response alternatives and the response format. A structured question may be multiple- choice, dichotomous, or a scale.
- 26. What are the pros and cons of using open-ended items? Open-ended items are frequently used as complements rather than alternatives to structured items. Open-ended items can provide interpretations and variations in the meaning of responses. For instance, in a ranking item about job satisfaction, a structured response may show "income" to be the most important satisfaction factor, but a follow-up open-ended item may show some respondents mean "high income," whereas other respondents mean "steady income." Open-ended items are not necessarily more accurate, however. Ideally, one would use both, with an open-ended probe question after every structured item. This, however, would be prohibitive in time and fatigue costs of the interview. Choosing Question Structure Multiple-Choice Questions In multiple-choice questions, the researcher provides a choice of answers and respondents are asked to select one or more of the alternatives given. Choosing Question Structure Dichotomous Questions A dichotomous question has only two response alternatives: yes or no, agree or disagree, and so on.
- 27. Design the Question to Overcome the Respondent’s Inability and Unwillingness to Answer Determine the Content of Individual Questions Decide the Question Structure Determine the Question Wording Arrange the Questions in Proper Order Reproduce the Questionnaire Specify the Type of Interviewing Method Identify the Form and Layout Eliminate Bugs by Pre-testing Questionnaire Design Process Specify The Information Needed
- 28. Choosing Question Wording Define the Issue Define the issue in terms of who, what, when, where, why, and way (the six Ws). Who, what, when, and where are particularly important. Which brand of shampoo do you use? (Incorrect) Which brand or brands of shampoo have you personally used at home during the last month? In case of more than one brand, please list all the brands that apply. (Correct) Choosing Question Wording Use Ordinary Words “Do you think the distribution of soft drinks is adequate?” (Incorrect) “Do you think soft drinks are readily available when you want to buy them?” (Correct) Choosing Question Wording Use Unambiguous Words In a typical month, how often do you shop in department stores? _____ Never _____ Occasionally _____ Sometimes _____ Often _____ Regularly (Incorrect)
- 29. In a typical month, how often do you shop in department stores? _____ Less than once _____ 1 or 2 times _____ 3 or 4 times _____ More than 4 times (Correct) Choosing Question Wording Avoid Leading or Biasing Questions A leading question is one that clues the respondent to what the answer should be, as in the following: Do you think that patriotic Americans should buy imported automobiles when that would put American labor out of work? _____ Yes _____ No _____ Don't know (Incorrect) Do you think that Americans should buy imported automobiles? _____ Yes _____ No _____ Don't know (Correct) Choosing Question Wording Avoid Leading or Biasing Questions (c ) 1. "You favor X, don't you?” (strong leading question) 2. "Do you favor an increase in the federal minimum wage to $8.00?" - The 2nd item is not as leading as the 1st item, but it is still
- 30. leading because it does not legitimize both affirmative and negative responses. This may bias the survey toward too many affirmative responses. A better method is to phrase such policy options in the form, "Some people favor X, while other people are opposed to X. What is your opinion?" Choosing Question Wording – Avoid Generalizations and Estimates “What is the annual per capita expenditure on groceries in your household?” (Incorrect) “What is the monthly (or weekly) expenditure on groceries in your household?” and “How many members are there in your household?” (Correct) Major Four “Do Not’s” of Questionnaire Wording The question should not “lead” the respondent to a particular answer. “Don’t you see any problem with using credit cards for online purchases?” The question should not have “loaded” wording or phrasing. The question should not be “double-barreled.” The question should not use words that overstate the condition…do not use “dramatics.” “Would you buy sunglasses
- 31. that protect your eyes from harmful ultraviolet rays that cause blindness?” 50 What is wrong with each question? How do you feel about Sears? When some gasoline or electric-powered product in your house breaks, do you call the Sears repair service? If the Sears repair service schedule was not convenient for you, would you consider or not consider calling a competing repair organization to fix the problem you have? How much do you think you would have to pay to have Sears fix something that needs to be repaired? Shouldn’t concerned parents use car seats? Should car seats be used for our loved ones? Do good parents and responsible citizens use car seats? Do you believe infant car seats can protect riders from being maimed? 51 Individual Question Wording “Do’s” for all questions Keep it focused on a single topic Keep it brief Keep it grammatically simple
- 32. Keep it crystal clear How do you feel about Sears? When some gasoline or electric-powered product in your house breaks, do you call the Sears repair service? If the Sears repair service schedule was not convenient for you, would you consider of not consider calling a competing repair organization to fix the problem you have? How much do you think you would have to pay to have Sears fix something that needs to be repaired? Please rate each aspect of Sears… When you need it, do you call Sears repair service? If you did not use Sears repair service, would you use another repair service? How much do you think Sears charges for a repair service call? 52 Do you believe infant car sears can protect riders from being maimed? Individual Question Wording “Do not’s” for all questions Don’t ask leading questions Don’t ask loaded questions Don’t ask double-barreled questions Don’t use overstated questions Do you think children’s car seats are useful? Should car seats be used for our loved ones? Shouldn’t concerned parents use car seats?
- 33. Do good parents and responsible citizens use car seats? Do you think infant car seats are useful? Do you think car seats are useful for family members? Do you think parents who use car seats are responsible? 53 Design the Question to Overcome the Respondent’s Inability and Unwillingness to Answer Determine the Content of Individual Questions Decide the Question Structure Determine the Question Wording Arrange the Questions in Proper Order Reproduce the Questionnaire Specify the Type of Interviewing Method
- 34. Identify the Form and Layout Eliminate Bugs by Pre-testing Questionnaire Design Process Specify The Information Needed The introduction is called a “cover letter” if the introduction is written to accompany a mail survey or online survey. Five functions: Identifies the surveyor/sponsor Indicates the purpose of the survey Explains how the respondent was selected Requests for/provides incentive for participation Determines if respondent is suitable Determining the Order of Questions – cover letter 55 Determining the Order of Questions Opening Questions The opening questions should be interesting, simple, and non- threatening. Type of Information As a general guideline, basic information should be obtained first, followed by classification, and, finally, identification information. Difficult Questions Difficult questions or questions which are sensitive,
- 35. embarrassing, complex, or dull, should be placed late in the sequence. Determining the Order of Questions Effect on Subsequent Questions General questions should precede the specific questions (funnel approach). Q1: “What considerations are important to you in selecting a department store?” Q2: “In selecting a department store, how important is convenience of location?” (Correct) Determining the Order of Questions Logical Order The following guidelines should be followed for branching questions: The question being branched (the one to which the respondent is being directed) should be placed as close as possible to the question causing the branching. The branching questions should be ordered so that the respondents cannot anticipate what additional information will be required. Survey order Introduction: discloses the sponsorship of a survey, Begins with non-threatening items which arouse interest. The first question should be clearly related to the announced purposes of the survey Then proceeds to attitude questions often sequencing from general and less threatening items toward
- 36. more specific and more sensitive items. Sensitive background items, particularly the income item, are usually put at the end. However, the more toward the end of the survey an item is, the lower its response rate is apt to be. Items which measure the dependent variable(s) or other research-critical items should not be left to the end for this reason. Form and Layout Divide a questionnaire into several parts. The questions in each part should be numbered, particularly when branching questions are used. The questionnaires should preferably be precoded. The questionnaires themselves should be numbered serially. Reproduction of the Questionnaire The questionnaire should be reproduced on good-quality paper and have a professional appearance. Vertical response columns should be used for individual questions. Directions or instructions for individual questions should be placed as close to the questions as possible. Incentives: are offers to do something for the respondent to increase the probability that the respondent will participate in the survey. Incentives may be monetary or non-monetary. Anonymity: respondent assured name not identified Confidentiality: respondent’s name is known by the researcher but not divulged to a third party Both are used as non-monetary incentives to increase
- 37. participation Incentives 62 Design the Question to Overcome the Respondent’s Inability and Unwillingness to Answer Determine the Content of Individual Questions Decide the Question Structure Determine the Question Wording Arrange the Questions in Proper Order Reproduce the Questionnaire Specify the Type of Interviewing Method Identify the Form and Layout
- 38. Eliminate Bugs by Pre-testing Questionnaire Design Process Specify The Information Needed Pretesting Pretesting refers to the testing of the questionnaire on a small sample of respondents to identify and eliminate potential problems. A questionnaire should not be used in the field survey without adequate pretesting. All aspects of the questionnaire should be tested, including question content, wording, sequence, form and layout, question difficulty, and instructions. The respondents for the pretest and for the actual survey should be drawn from the same population. Pretests are best done by personal interviews, even if the actual survey is to be conducted by mail, telephone, or electronic means, because interviewers can observe respondents' reactions and attitudes. Jhirmack Finesse Vidal Sassoon Head & Shoulders
- 40. Head & Shoulders 0 0 0 0 Pert 1 1 0 1 Number of Times Preferred b 3 2 0 4 1
- 41. Jhirmack Finesse Vidal Sassoon Head & Shoulders Pert Jhirmack 0 0 1 0 Finesse 1a 0 1 0 Vidal Sassoon 1 1 1 1 Head & Shoulders 0 0 0 0 Pert 1 1 0 1
- 42. Number of Times Preferredb 3 2 0 4 1 Pert 1 1 0 No. of Times Preferred b 3 2 0 b DuPont Has Designs on Fashion Case question for week 3: 1. What internal sources of secondary data can you identify which would be helpful? 2. What published sources of secondary data can you identify which would be helpful? 3. Assess the possible bias in the following sources of secondary data. (a) An article interviewing designers on the new fashion trends in Floorcovering News.
- 43. (b) A DuPont sales history for 2000–2003 broken out by market regions. (c) A chart of sales of residential carpet by region from the Census of Retail Trade. (d) A list of bibliographic titles related to carpet fashion. 4. Match the criteria for selecting survey methods with the survey method(s) offering the best results in this case. (a) Telephone Interview (b) CATI (computer aided telephone interview) (c) In-Home (d) Mall Intercept (e) CAPI (computer aided personal interview) (f)
- 44. Mail Surveys (g) Mail Panels (h) E-mail Survey (i) Internet Survey Use of Physical Stimuli Quantity of Data Obtaining Sensitive Information Speed Diversity of Questions Sample Control Response Rate
- 45. Cost Flexibility of Data Collection Control of Field Force Social Desirability Potential for Interviewer Bias Control of Data Collection Environment Perceived Anonymity of Respondent 1. DuPont Has Designs on Fashion DuPont is a science company that delivers science-based solutions in food and nutrition, health care, apparel; home and construction, electronics, and transportation. The company was founded in 1802, and operates in more than 70 countries as of 2003. DuPont’s core values for over 200 years have remained constant: commitment to safety, health and the environment, integrity and high ethical standards, and treating people with fairness and respect. DuPont Fibers Division was wondering: could carpets move “uptown” into the fashion-oriented world typically associated with clothing and furniture? The longtime market share leader
- 46. in the carpet industry, DuPont, was searching for new ways to expand in a slow growth market. This market had been growing at approximately 5% per annum over the 1990s and was predicted to remain level or even decline in following years. Revenues were up 5% in 2002 for DuPont’s fiber operations. In addition, in the residential segment of the market, DuPont needed a way to differentiate its nylon fiber carpets from increased competition including the strong challenge of Amoco's new polypropylene fiber carpets. The carpet industry can be divided into three end-use segments: commercial carpets for offices, hospitals, hotels, schools, government facilities, and industrial sites; contract residential carpets for large residential purposes like apartment complexes or subdivisions; and residential carpets for homes. DuPont estimated that 30% of carpet sales were from new residential construction, and the other 70% was from replacement purchases. In addition to different end-use segments, each segment’s consumers were quite different from the other segment’s consumers and each segment was serviced through different channels. Commercial carpets were typically bought by interior designers, architects or specifiers for their clients. They had to be durable and, especially for some end-uses like hotels, fashionable. Contract residential carpets were bought by designers or by the contractor who typically focused on price and durability. The residential segment differed from the other two because the purchaser was also the end-user. Typically, the lady of the house purchased carpeting from a retail outlet in order to create the atmosphere she wanted in her home. In a recent trade journal article, carpet industry experts stated that retail stores are an important and effective component of the retail environment. Ninety-seven percent of all carpeting is produced from man- made fibers derived from petroleum. The leading fiber in the industry has been nylon which was invented by DuPont in the
- 47. 1930s. Though the leader in the industry, DuPont was challenged by other high quality nylon producers, like Monsanto, Allied, and BASF, and a host of generic low-end fiber producers. DuPont has 27% of the global nylon market and 58% of the nylon-6/6 market (the most advanced nylon fiber). Fiber producers sell their output to carpet mills that then produce the carpeting. Until the 1980s, competition in the residential segment was based on the technical qualities of the fibers, mill price of fiber, and reliability in shipping—none of which directly affected the consumer. As such, the industry tended to be very production oriented. In the early 1980s, a giant breakthrough benefiting the consumer emerged—stain resistant carpets. By applying a chemical coating to the carpet fiber during production, the carpet was protected from permanent staining arising from most household soiling agents. Stains could be wiped off the carpet, thus alleviating the concern many people had about entertaining or “living” on their carpet. The four major fiber producers quickly announced their versions of the stain resistant carpets in an effort to remain competitive. Amoco also got into the game when it announced a “new revolution in carpeting,” carpets made from polypropylene (PP) fibers rather than nylon. As a fiber, PP is inherently stain resistant. Thus it offered the best overall protection from stains and it costs less to produce than nylon. However, it did not as readily accept dyes as nylon, nor was it as soft to the touch, thus making it less fashionable. As such, PP initially had difficulty entering the residential segment, but was well received by the commercial segment. Approximately 24% of the total U.S. carpet fiber market is PP. In the mid 1980s, technical advancements in dyeing allowed Amoco to seriously compete in the residential segment. Their objective was to lead the introduction of PP fibers to the residential market. DuPont, desiring to be the unquestionable leading fiber producer to the residential segment, relied more on
- 48. marketing than other companies. It seemed to sense the threat of PP towards nylon fibers when it purchased Hercules fibers, a large PP extruder. However, DuPont believed that nylon was still the fiber for residential carpets and was bent on letting the consumer cast the deciding vote. DuPont believed it could use its well respected company name to attract consumers. As such, DuPont created the first fiber- producer backed carpets, DuPont Stainmaster carpets, which carried a guarantee backed by DuPont on stain resistance, wear and anti-static, and was branded as a DuPont carpet. The results of the program were highly successful with DuPont creating high brand recognition among consumers, the first time this had ever been achieved by a fiber company, thus differentiating it from the other fiber producers. DuPont took its Stainmaster carpet business and converted it to a premium carpet brand by increasing prices and reducing its distribution channels. DuPont spent over $10 million on television advertising beginning in 1995. A survey conducted by Video Storyboard Tests, Inc. rated the DuPont Stainmaster television commercial the fourth “most popular television commercial.” Based on its success with DuPont Stainmaster, the industry leader decided to forge new ground. For most of its history, the residential segment had typically been the most blasé segment of the carpet market. Styles tended to be simple, colors passive, and features uniform across all competitors in the industry. Technically, industry players maintained that differences did indeed exist, but in the words of one industry analyst, “The differences were there in style and fiber quality, but the housewife out shopping for carpet didn't really know or care—she only liked what she could see and feel.” As such, DuPont wondered if the styles and designs so popular in the commercial segment could be transferred to the residential segment. Was the average household willing to make carpeting more than just a backdrop for other furnishings? If the
- 49. program were to be successful, it would mean: further differentiation from other nylon fiber producers by creating a new segment based on fashion and status for residential carpets; increasing brand awareness among consumers for DuPont (resulting in increased demand for DuPont fibers); bringing in a new dimension to residential sales which would be difficult for PP carpets to duplicate and would solidify DuPont as the leader in the residential segment. It, however, would be an expensive undertaking, involving a significant amount of publicity and risking its reputation with its major fiber clients. In addition, if DuPont were to proceed with the Designer Collection, it would have to move fast. The largest trade show in the industry—in which the companies announced their major designs and programs for the coming year—was coming up in three months. If DuPont wanted the Designer Collection to have a maximal impact, it would have to have carpet samples and promotional materials ready for distribution at the show, and their marketing program in line to begin shortly thereafter. As such, the go no-go decision would have to be made within six weeks. Overall, for the full year of 2000, consolidated sales totaled $28.3 billion compared to $26.9 billion in 1999. However, Dupont’s revenues slipped to $24.52 billion in 2002 because of the overall slowdown in the U.S. economy. In 2003, DuPont emphasized an integrated marketing campaign to promote its Tactesse nylon carpet fiber. The fiber features two new deniers, 995 and 2,250, which DuPont engineers developed for added flexibility in loop constructions. The promotion included placing ads in several trade publications and a direct-mail piece to more than 5,000 carpet retailers. The mailer contained samples of carpet with Tactesse in loop and cutpile configurations. They provided carpet retailers an opportunity to test the fiber’s “You have to feel it to believe it” theme. References
- 50. 1. Gregory Morris, “DuPont Canada Brings On Nylon–6/6 Expansion,” Chemical Week (April 29, 1998): 19. 2. Marc Reisch, “New Texture in Carpet Fibers,” Chemical & Engineering News 76(4) (January 26, 1998): 20–21. 3. Andrew Wood, “DuPont Wants to Hitch Up Nylon’s Performance,” Chemical Week (October 29, 1997): 42. 4. Elaine Gross, “DuPont Shows New Tactesse Nylon Fiber for Carpets,” Textile World 150 (6) (June 2000): 6. 5. www.dupont.com PAGE 937 DuPont Has Designs on Fashion Case question for week 4: 1. What type of measurement scale is each of the following scales? (a) Nominal (b) Ordinal (c) Interval (d) Ratio A list of preferences of carpet styles rated on a 1 to 7 scale. A ranking of preferences for carpet fiber. 1. DuPont 2. Monsanto
- 51. 3. BASF 4. Allied A list of preferences of carpet colors rated on a -3 to 3 scale. A constant sum scale of importance attached to attributes of a carpet. 2. What types of noncomparative scales can be used to gather the information needed on psychographics (activity, interest, and opinions), motivations, attitudes, and intentions to purchase? Notes: What is psychographics? Demographic information is likely to be more useful than psychographic data when simple, objective criteria are sufficient in defining and distinguishing potential consumers. Demographic data are more clearly defined and directly measurable than psychographics and, therefore, make segmentation on these basis more straightforward. In contrast, psychographics are used to understand consumers’ motivations for purchasing and using products. These data reflect people’s tendencies to sort themselves into groups on the basis of the things they like to do, how they like to spend their leisure time, and how they choose to spend their money. Many of these characteristics are more complex and less overt than demographics but often address the underlying motivations for individuals’ behaviors. Psychographic Information: Psychographics can be obtained from an activities-interests-opinions (AIO) inventory. An AIO inventory can be constructed from a list of statements related to lifestyles. Respondents express their degree of agreement or disagreement with the statement. 3. Are each of the following questions well formulated? If not, what is the error? (a) What is your favorite construction of carpet fibers? Nylon BCF __________
- 52. Nylon Staple __________ Polypropylene BCF __________ Polypropylene Staple __________ Polyester __________ (b) Do you intend to buy a new carpet soon? Yes __________ No __________ (c) Do you believe, as most Americans do, that U.S. citizens should buy American made carpets? Yes __________ No __________ (d) Will you buy designer carpets given that they cost slightly more than traditional carpets? Yes __________ No __________