1. Molecular Human Reproduction, Vol.16, No.8 pp. 583–589, 2010
Advanced Access publication on May 19, 2010 doi:10.1093/molehr/gaq039
ORIGINAL RESEARCH
SNP microarray-based 24 chromosome
aneuploidy screening is significantly
more consistent than FISH
Nathan R. Treff 1,2,*, Brynn Levy1,3, Jing Su1, Lesley E. Northrop1,2,
Xin Tao1, and Richard T. Scott Jr1,2
1Reproductive Medicine Associates of New Jersey, Morristown, NJ 07960, USA 2Division of Reproductive Endocrinology and Infertility,
Department of Obstetrics Gynecology and Reproductive Science, University of Medicine and Dentistry of New Jersey, Robert Wood
Johnson Medical School, New Brunswick NJ 08901, USA 3Department of Pathology, College of Physicians and Surgeons, Columbia
University, New York, NY 10032, USA
*Correspondance address: Email: ntreff@rmanj.com
Submitted on March 19, 2010; resubmitted on May 12, 2010; accepted on May 13, 2010
abstract: Many studies estimate that chromosomal mosaicism within the cleavage-stage human embryo is high. However, comparison of
two uniquemethods of aneuploidy screening of blastomeres within the sameembryo has not been conducted and may indicatewhethermosaicism
has been overestimated due to technical inconsistency rather than the biological phenomena. The present study investigates the prevalence of
chromosomal abnormality and mosaicism found with two different single cell aneuploidy screening techniques. Thirteen arrested cleavage-stage
embryos were studied. Each was biopsied into individual cells (n ¼ 160). The cells from each embryo were randomized into two groups.
Those destined for FISH-based aneuploidy screening (n ¼ 75) were fixed, one cell per slide. Cells for SNP microarray-based aneuploidy screening
(n ¼ 85) were put into individual tubes. Microarray was significantly more reliable (96%) than FISH (83%) for providing an interpretable result
(P ¼ 0.004). Markedly different results were obtained when comparing microarray and FISH results from individual embryos. Mosaicism was sig-nificantly
less commonly observed by microarray (31%) than by FISH (100%) (P ¼ 0.0005). Although FISH evaluated fewer chromosomes per cell
and fewer cells per embryo, FISH still displayed significantly more unique genetic diagnoses per embryo (3.2+0.2) than microarray (1.3+0.2)
(P , 0.0001). This is the first prospective, randomized, blinded and paired comparison between microarray and FISH-based aneuploidy screening.
SNP microarray-based 24 chromosome aneuploidy screening provides more complete and consistent results than FISH. These results also suggest
that FISHtechnology may overestimate the contribution of mitotic error to the origin of aneuploidy at the cleavage stage of human embryogenesis.
Key words: aneuploidy screening / SNP microarray / FISH / randomized blastomere comparison / chromosomal mosaicism
Introduction
The concept of aneuploidy screening of human embryos to enhance IVF
outcomes is based on sound principles. Multiple technologies have
demonstrated that aneuploidy is common in preimplantation embryos
and involves monosomies and trisomies of all 22 autosomes as well as
the sex chromosomes (Fragouli et al., 2009; Vanneste et al., 2009;
Johnson et al., 2010; Treff et al., 2010). The prevalence of abnormalities
at the time of antenatal screening and in live born infants is dramatically
lower than that found in embryos (reviewed in Hassold and Hunt, 2001).
The difference in these rates is reflective of the fact that aneuploid
embryos either fail to implant or arrest in their development during
the early phases of gestation in most cases. A small residual clinical
risk remains for ongoing aneuploid gestations (typically involving triso-mies
or monosomy X) which may remain viable and are ultimately live
born. If embryos could be accurately screened prior to transfer, those
which are aneuploid could be eliminated. By transferring only euploid
embryos, the diminution in reproductive efficiency attributable to aneu-ploidy
might be reduced or eliminated. Clinical benefits should include
higher implantation rates, lower pregnancy loss rates and a reduction
in the risk for delivery of an anomalous infant.
Unfortunately, clinical results with preimplantation genetic screening
(PGS) for aneuploidy have not demonstrated the theoretical improve-ments
which were anticipated (Staessen et al., 2004, 2008; Mastenbroek
et al., 2007; Hardarson et al., 2008; Schoolcraft et al., 2009). In fact, every
randomized clinical trial performed to date has failed to demonstrate
improved outcomes on an intent-to-treat basis. Putative explanations
for this clinical failure have included mosaicism, self-correction of aneu-ploidy
within the embryo, evaluation of a very limited number of chromo-somes
with the most commonly used technology—fluorescence in situ
hybridization (FISH), an adverse impact of embryo biopsy which over-whelms
any positive influence gained by aneuploidy screening and
& The Author 2010. Published by Oxford University Press on behalf of the European Society of Human Reproduction and Embryology.
This is an Open Access article distributed under the terms of the Creative Commons Attribution Non-Commercial License (http://creativecommons.org/licenses/by-nc/2.5), which
permits unrestricted non-commercial use, distribution, and reproduction in any medium, provided the original work is properly cited.
Downloaded from http://molehr.oxfordjournals.org/ at National Taiwan University Library on September 4, 2014
2. 584 Treff et al.
technical limits of the screening technology itself (reviewed in Practice
Committee of the Society for Assisted Reproductive Technology and
PracticeCommittee of theAmerican Society for Reproductive Medicine,
2007; Anderson and Pickering, 2008; American Congress of Obstetri-cians
and Gynecologists Committee Opinion, 2009).
While all of these factors may have contributed to the lack of success
of FISH-based aneuploidy screening, the most concerning are the issues
relating to technical accuracy. Evaluation of a single blastomere is chal-lenging.
Unfortunately, direct evaluation of the reliability of FISH on
human embryonic blastomeres has not been done. Scientists have
made great efforts to optimize FISH in this setting and have provided esti-mates
of error rates (e.g. Colls et al., 2007). These calculations require a
variety of assumptions. When multiple cells are evaluated from a single
embryo and differing results are attained, it is difficult to know whether
those differences should be attributed to genuine mosaicism, or if they
reflect a failure of the technique to provide reproducible results.
Some investigators have addressed this question by taking embryos
which were diagnosed as aneuploid following biopsy and FISH evalu-ation
of a blastomere on Day 3 and then re-evaluating the embryo
at the blastocyst stage. In fact, non-concurrence rates following an
abnormal Day 3 FISH result and re-analysis at the blastocyst stage
on Day 5 of development are substantial (Magli et al., 2000; Li
et al., 2005; Munne et al., 2005; Fragouli et al., 2008; Barbash-Hazan
et al., 2009). Euploidy rates in these embryos previously designated
as abnormal may be as high as 71% (Munne et al., 2005).
Interpreting the data fromre-evaluation studies is further complicated
by the use of differing definitions for ‘concurrence’. If the blastocyst is
aneuploid but has a different chromosomal abnormality than that ident-ified
on the original Day 3 biopsy, should the original diagnosis be con-sidered
concurrent or non-concurrent? If the standard is purely
clinical, then the detection of aneuploidy in both samples would lead
to the same clinical designation (non-viable) and it is possible to consider
that the original clinical diagnosis was assigned correctly even though the
technical results clearly differed. This is an extremely low standard and
would not be suitable for evaluating the reliability of a technique.
One option for evaluating the precision of aneuploidy screening
would be to analyze multiple cells from the same embryos with two
different technologies. For example, a cleavage-stage embryo which
has arrested and been discarded for research could be dispersed
into individual cells and then randomly assigned to analysis by either
FISH or another method such as copy number analysis by SNP
microarray-based 24 chromosome aneuploidy screening (Treff et al.,
2010). While some mosaicism is almost inevitable, the paired nature
of the comparison would control for its impact on the results obtained
by each technique. In other words, mosaicism should be equally
common with both techniques. Any consistent disparity in results
with one relative to the other would strongly suggest that the tech-niques
are not providing equivalent results. This study is designed to
evaluate the consistency in aneuploidy assessment using two aneu-ploidy
screening techniques.
Materials and Methods
Population
Supernumerary embryos were donated to research by infertile patients
participating in the IVF program. Embryos which arrested in extended
culture were considered for the study. Embryos on Day 5 of in vitro devel-opment
which had failed to progress through compaction to form either a
morulae or blastocyst were selected for the study. As such, these embryos
were not considered viable or suitable for cryopreservation for future clini-cal
use. All patients gave informed consent to have their non-viable
embryos donated to the research program by following an IRB approved
protocol.
Experimental design
The goal of this research was to determine the consistency in diagnostic
results obtained with FISH and microarray-based aneuploidy screening.
To that end, it was necessary to evaluate and compare multiple cells
from the same embryo. The experimental design is outlined in Fig. 1.
Embryos which had failed to compact but which had eight or more cells
on Day 5 were specifically selected for study. The cells all needed to be
intact, with a visible nucleus, and no evidence of multinucleation in any
cell at any point during embryonic development.
The selected embryos were biopsied into individual cells. It was then
necessary to randomly assign the cells from that individual embryo to
either FISH or microarray-based analysis. As such, each embryo had its
own unique randomization table. Using that table, the blastomeres from
each embryo were randomly assigned to FISH or microarray analysis.
Cells which were randomized to FISH-based analysis were fixed one cell
per slide to avoid bias when interpreting the FISH results. Blastomeres ran-domized
to microarray-based analysis were placed into individual PCR
tubes for cell lysis.
While there was a unique randomization table for each individual
embryo to make certain that the cells were distributed approximately
equally between the two study groups, the numbers used to label the
glass slides and lysis buffer tubes were assigned from a separate single
large randomization table. This was essential to assure blinding of the lab-oratory
team. It was not possible for the laboratory scientists to know
which slides or tubes came from the same embryos. They were also
unaware of how many cells came from each embryo or even how many
embryos were being evaluated in the study.
Assays
The isolated blastomeres which were randomized to undergo FISH analy-sis
were fixed, one cell to a glass slide. Each cell had been pre-incubated in
a hypotonic solution and fixed using 3:1 methanol:acetic acid solution.
Two rounds of FISH were performed on fixed blastomeres using probes
specific for chromosomes 13, 15, 16, 17, 18, 21, 22, X and Y (Vysis,
Downer’s Grove, IL, USA). The slides were analyzed using an automated
Olympus BX61 fluorescence microscope (Center Valley, PA, USA). The
images were captured using Cytovision probe software (Applied Imaging
Corp, San Jose, CA, USA). Reconfirmation of inconclusive results was con-ducted
as previously described (Colls et al., 2007).
Blastomeres which were randomized to undergo microarray-based
analysis were placed into individual reaction tubes containing lysis buffer.
Each then underwent microarray-based copy number analysis for whole
chromosome aneuploidy as previously described (Treff et al., 2010).
This microarray technology previously demonstrated 98.6% accuracy in
a randomized blinded analysis of single cells from cell lines with whole
chromosome aneuploidies previously identified by conventional cytoge-netics
(Treff et al., 2010). Accuracy per chromosome was greater than
99%. However, we have not validated this single cell microarray technol-ogy
for identification of segmental aneuploidy and therefore it could not be
used for this purpose in the present study. Briefly, whole genomic ampli-fication
was conducted according to the recommended protocol beginning
with library preparation (GenomePlex WGA4, Sigma Aldrich, St. Louis,
Missouri). Whole genome amplified DNA was then purified using the
Downloaded from http://molehr.oxfordjournals.org/ at National Taiwan University Library on September 4, 2014
3. Microarray-based aneuploidy screening is more consistent than FISH 585
GenElute PCR Purification Kit as recommended (Sigma Aldrich). Two-hundred
and fifty nanograms of purified DNA were then processed
through the NspI GeneChip Mapping 262 K microarray as recommended
by the manufacturer (Affymetrix, Santa Clara, CA, USA). Aneuploidy
screening was performed by copy number analysis of the microarray
data using the Copy Number Analysis Tool (CNAT) version 4.0.1 (Affy-metrix).
The microarray data discussed in this publication have been
deposited in NCBI’s Gene Expression Omnibus and are accessible
through GEO Series accession number GSE20 975 (http://www.ncbi.
nlm.nih.gov/geo).
Statistics
Samples were analyzed and a genetic result assigned. The fact that the
samples undergoing FISH were evaluated for nine chromosomes while
those undergoing microarray analysis were evaluated for 24 chromosomes
(all twenty two autosomes, and X and Y) provides an unequal opportunity
to identify aneuploidy and thus to have discrepant results. In particular,
when comparing the consistency of genetic diagnoses, the difference in
the number of chromosomes being evaluated would provide an advantage
for the FISH group where there would be only nine chances to obtain a
different result.
The results obtained from each technology for each individual cell were
then collated by embryo for comparison. Since both techniques will
occasionally fail to provide an interpretable result, the no-result rates
were compared using a Pearson’s chi square test for concurrence. Follow-ing
this comparison, those cells which failed to provide a genetic diagnosis
were excluded from further consideration.
The genetic diagnoses for each technology were reviewed for each indi-vidual
embryo. If all the genetic diagnoses were the same with a particular
technology then there would be perfect concurrence of results. In con-trast,
if any of the diagnoses using a particular technology were different,
then that embryo was designated as being mosaic according to that tech-nology.
The number of unique genetic diagnoses made by FISH was com-pared
with the number made by microarray using a paired Student’s t-test.
The prevalence of mosaicism identified by each method was compared
using a Fisher exact test.
Results
One hundred and sixty cells were evaluated from thirteen arrested
cleavage-stage embryos (median of 13 cells per embryo; range 9–
16). No cells were lost during the biopsy process. Seventy five cells
were randomized to FISH-based analysis with the remaining 85 cells
designated to undergo evaluation by microarray. The number of inter-pretable
results obtained for each technique for each embryo is pre-sented
in Table I. Microarray analyses produced interpretable results
in 82 of 85 cells (96%). In contrast, FISH analyses produced interpret-able
results in only 62 of 75 cells (83%). This difference was statistically
significant (P ¼ 0.004).
The specific genetic diagnoses obtained with each technique for
each cell are presented in Table II. Eight of the 13 embryos (62%)
were diagnosed as uniformly diploid (all cells) by microarray. The
remaining 5 embryos displayed at least one aneuploid cell by microar-ray;
2 embryos were mosaic aneuploid, 2 were mosaic diploid/aneu-ploid,
and 1 was a uniformly aneuploid embryo. In contrast, 10 of the
13 embryos were diagnosed as mosaic diploid/aneuploid by FISH
including the same 8 embryos that were diagnosed as uniformly
diploid by microarray. The remaining 3 embryos were diagnosed as
mosaic aneuploid by FISH. The prevalence of mosaicism was therefore
100% in the FISH group. In contrast, the prevalence of mosaicism was
31% in the microarray group, and was significantly lower than the FISH
group (P ¼ 0.0005).
Perhaps more important than the overall prevalence of mosaicism is
the number of unique genetic diagnoses which would have been
assigned to each embryo. In the FISH group, there were almost as
many different genetic diagnoses as there were cells analyzed. For
example, embryo number seven had 6 cells evaluable and received
five different genetic diagnoses. The mean number of unique genetic
diagnoses assigned to each individual embryo was 3.2+0.2 by FISH
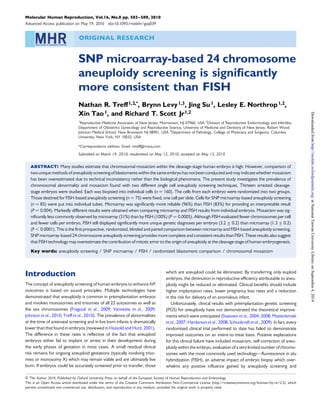
Figure 1 Blastomeres from the same cleavage-stage embryos were
biopsied into individual cells and randomized to analysis by either
FISH or microarray. Blastomeres from multiple embryos were ran-domized
together so that the embryo specific origin of each blasto-mere
was blinded. The paired randomized design controls for true
mosaicism and the blinded analysis avoids bias in interpretation
from knowledge of each blastomere’s embryo of origin.
Downloaded from http://molehr.oxfordjournals.org/ at National Taiwan University Library on September 4, 2014
4. 586 Treff et al.
Table I Blastomeres that were randomized from13 cleavage-stage embryos and produced interpretable results by either
FISH or microarray.
.............................................................. ..............................................................
.............................................................................................................................................................................................
and 1.3+0.2 by microarray. Microarray displayed significantly fewer
unique genetic diagnoses (P , 0.0001) despite evaluating more
chromosomes per cell (24 by microarray compared with 9 by
FISH), and evaluating more cells per embryo.
Discussion
The phenomenon of chromosomal mosaicism in the developing
human embryo has complicated the interpretation of inconsistent
aneuploidy diagnoses of multiple samples from the same embryo.
Indeed, there are at least two interpretations of inconsistencies
observed after analysis of multiple blastomeres from within the
same embryo. One interpretation is that true mosaicism, which
likely occurs as a result of errors in chromosome segregation during
mitotic cell division, was present in the embryo. Indeed, mosaicism
represents the primary source of variation that has been used to
explain the inconsistencies observed by FISH-based aneuploidy
screening. However, a largely overlooked interpretation is that the
observed inconsistencies are due to the FISH technique itself.
Although high rates of mosaicism have been found by other
methods, including conventional comparative genomic hybridization
(CGH) (Voullaire et al., 2000; Wells and Delhanty, 2000), and array
CGH combined with a multiple displacement amplification based
SNP microarray analysis (Vanneste et al., 2009), no previous studies
have been performed using the present study design (where blasto-meres
from the same embryos were randomized to blinded analysis
by two independent technologies). Until such a study design has
been implemented to evaluate other technologies, it will remain
unclear as to whether previous estimates of the prevalence of
mitotic aneuploidy made by these other technologies are based on
true mosaicism or technical limitations.
Randomization of cells within the same embryo and blinded analysis
by two different methods provided a unique opportunity to isolate the
putative individual contributions made by true mosaicism and technical
limitations to the inconsistency in aneuploidy diagnoses. Blinded analy-sis
is a critical component since knowledge of whether specific blasto-meres
belong to the same embryo can significantly bias interpretation
of the results. For example, interpretation of a blastomere that would
otherwise be difficult to make might be influenced by a diagnosis made
for another blastomere from the same embryo. Although previous
reports describing FISH-based diagnosis of aneuploidy have elected
to attribute inconsistencies primarily to mosaicism, the present
study indicates that the most likely explanation is inconsistency of
the technique itself.
First, the microarray process was significantly more reliable for pro-ducing
an interpretable result (P ¼ 0.004). This could be due to the
specific method of sample processing for microarray-based analyses
which is independent of cell spreading or fixation known to be an
unreliable process that is required for FISH. It could also be related
to the nature of the blastomeres in this study, in that they were
derived from arrested embryos rather than developmentally normal
embryos. The present study found that 13 blastomeres (17%) failed
to provide an interpretable FISH result; 8 were anucleated, 2 were
lost during fixation, and 3 were not analyzable (covered in debris).
Although this rate of failure is considerably higher than the approxi-mately
6% failure rate recently reported by the ESHRE PGD consor-tium
for blastomeres derived from developmentally normal
cleavage-stage embryos (Goossens et al., 2009), it is below that of a
previously reported FISH analysis of 719 arrested cleavage-stage
embryos, where an overall failure rate of 23% was found; 106 cells
were anucleated, 17 were broken during biopsy, 25 were lost
during fixation, and 17 were not analyzable (Munne et al., 1994).
Embryo No. Total No. of
Randomized Cells
FISH Microarray
No. of Cells
No. of Interpretable
Randomized
Results
No. of Cells
Randomized
No. of Interpretable
Results
1 14 7 5 7 6
2 14 7 7 7 6
3 10 4 3 6 6
4 15 7 5 8 8
5 11 5 5 6 5
6 9 4 4 5 5
7 16 8 6 8 8
8 10 4 2 6 6
9 13 6 5 7 7
10 15 7 5 8 8
11 13 6 6 7 7
12 9 4 3 5 5
13 11 6 6 5 5
Total No. of
160 75 62 (83%) 85 82 (96%a)
Reliability
aIndicates microarray interpretation of the results is significantly more reliable than FISH (P ¼ 0.004).
Downloaded from http://molehr.oxfordjournals.org/ at National Taiwan University Library on September 4, 2014
5. Microarray-based aneuploidy screening is more consistent than FISH 587
Table II Number of unique diagnoses made by FISH and microarray from multiple blastomeres randomized, blinded and
paired after biopsy from the same embryos.
......................................................................................... ................................................................................
.............................................................................................................................................................................................
Microarray-based aneuploidy screening also displayed significantly
higher consistency in diagnosis for blastomeres randomized from the
same embryos that underwent FISH-based analysis (P , 0.0001).
FISH predicted a rate of mosaicism of 100%, while microarray pre-dicted
a significantly lower rate of 31% (P ¼ 0.0005). As a result of
the randomized and paired design, it was not possible that cells with
true mosaicism were assigned to the FISH analysis group only. More-over,
since microarray analyses were more reliable for providing an
interpretable result, there were more blastomeres analyzed per
embryo by microarray than by FISH, thus providing a larger opportu-nity
for true mosaicism to impact observations made by microarray.
Microarray analysis also included diagnosis of all 24 chromosomes,
Embryo
No.
FISH Result Microarray Result
Results (no. of cells) No.
Unique
Results
Interpretation Results (no. of
cells)
No.
Unique
Results
Interpretation
1 Dip female(3) 2 Mosaic Diploid/Aneuploid 46,XX(6) 1 Uniformly Diploid
+18 female(2)
2 Dip male(5) 3 Mosaic Diploid/Aneuploid 46,XY(6) 1 Uniformly Diploid
218 male(1)
215,217,218,221 male(1)
3 Dip male(1) 3 Mosaic Diploid/Aneuploid 46,XY(6) 1 Uniformly Diploid
213 male(1)
+13,216,221 male(1)
4 Dip male(3) 3 Mosaic Diploid/Aneuploid 46,XY(8) 1 Uniformly Diploid
216 male(1)
213 male(1)
5 Dip male(2) 4 Mosaic Diploid/Aneuploid 46,XY(5) 1 Uniformly Diploid
tet male(1)
XXY(1)
+13,+18 male(1)
6 +22 female(2) 3 Mosaic Aneuploid 46,XX,219,+22(4) 2 Mosaic Aneuploid
complex aneuploid(1) 45,XX,219(1)
tet female(1)
7 Dip female(2) 5 Mosaic Diploid/Aneuploid 46,XX(8) 1 Uniformly Diploid
213,215 female(1)
222,+18 female(1)
213,216,222 female(1)
218,XXX(1)
8 222 female(1) 2 Mosaic Aneuploid 45,XX,222(6) 1 Uniformly Aneuploid
222,XXX(1)
9 Dip female(3) 3 Mosaic Diploid/Aneuploid 46,XX(7) 1 Uniformly Diploid
216 female(1)
complex aneuploid(1)
10 Dip female(2) 4 Mosaic Diploid/Aneuploid 46,XX(7) 2 Mosaic Diploid/Aneuploid
213,217 female(1) 47,XX,+18(1)
213 female(1)
213,216,218 female(1)
11 Dip female(3) 4 Mosaic Diploid/Aneuploid 46,XX(2) 3 Mosaic Diploid/Aneuploid
218,222 female(1) 45,XX,217(4)
213,218,221 female(1) 47,XX,+19(1)
complex aneuploid(1)
12 complex aneuploid(1) 3 Mosaic Aneuploid Complex aneuploid(5) 1 Mosaic Aneuploid
XYYY(1)
216,217,218 male(1)
13 Dip female(4) 3 Mosaic Diploid/Aneuploid 46,XX(5) 1 Uniformly Diploid
+13 female(1)
215,217,XXY(1)
Mean Mean
3.2+0.2 1.3+0.2a
aIndicates significantly fewer unique diagnoses by microarray compared with FISH for the same embryos (P , 0.0001). dip, diploid; tet, tetraploid.
Downloaded from http://molehr.oxfordjournals.org/ at National Taiwan University Library on September 4, 2014
6. 588 Treff et al.
while FISH analysis only included 9 chromosomes, again providing a
larger opportunity for true mosaicism to impact the observations
made by microarray-based analysis.
Together with previous studies which indicate poor predictive value
of cleavage-stage FISH for aneuploidy in morphologically normal blasto-cysts
(Li et al., 2005; Munne et al., 2005; Fragouli et al., 2008; Barbash-
Hazan et al., 2009), and the absence of clinical benefit observed in many
randomized controlled trials, it is becoming clear that FISH-based tech-nology
is inadequate for the diagnosis of aneuploidy in human embryos.
One important implication of the current study is that previous
interpretation of FISH-based analysis of the origin of human aneuploidy
may be incorrect. For example, in this study, a significantly larger pro-portion
of embryos would have been assigned as having mitotic error
when estimated by FISH-based analysis (100%) compared with
microarray-based analysis (31%). Therefore, aneuploidy screening tech-nologies
with better consistency may provide better estimates of the
origin of aneuploidy in human embryos that are more in line with the
primarily observed maternal meiotic origins of aneuploidy in products
of conception (reviewed in Hassold et al., 2007).
Despite the growing evidence that FISH-based aneuploidy screening
does not work, the concept of improving outcomes by aneuploidy
screening should not be considered invalid. Indeed, new comprehen-sive
technologies such as SNP microarray-based 24 chromosome
aneuploidy screening may result in the realization of the expected clini-cal
benefit. However, development and validation of these new tech-nologies
should be held to a higher standard than FISH. These
standards should include demonstration of preclinical accuracy, con-sistency,
and reliability. In addition, completion of randomized trials
with class I strength of evidence for clinical benefit, and experimentally
demonstrating acceptable risk of clinical implementation (i.e. a negli-gible
impact of biopsy), should be required before any new aneuploidy
screening technologies are offered as a clinical routine (reviewed in
Scott and Treff, 2010).
Authors’ roles
R.T.S. and N.R.T. designed the study. J.S., X.T. and L.E.N. performed
the microarray analyses. B.L. performed the FISH analyses. N.R.T.,
R.T.S. and B.L. wrote the manuscript.
References
American Congress of Obstetricians and Gynecologists Committee
Opinion. Preimplantation Genetic Screening for Aneuploidy. Obstet
Gynecol 2009;113:766–767.
Anderson RA, Pickering S. The current status of preimplantation genetic
screening: British Fertility Society Policy and Practice Guidelines. Hum
Fertil (Camb) 2008;11:71–75.
Barbash-Hazan S, Frumkin T, Malcov M, Yaron Y, Cohen T, Azem F,
Amit A, Ben-Yosef D. Preimplantation aneuploid embryos undergo
self-correction in correlation with their developmental potential. Fertil
Steril 2009;92:890–896.
Colls P, Escudero T, Cekleniak N, Sadowy S, Cohen J, Munne S. Increased
efficiency of preimplantation genetic diagnosis for infertility using “no
result rescue”. Fertil Steril 2007;88:53–61.
Fragouli E, Lensi M, Ross R, Katz-Jaffe M, Schoolcraft WB, Wells D.
Comprehensive molecular cytogenetic analysis of the human
blastocyst stage. Hum Reprod 2008;23:2596–2608.
Fragouli E, Jaffe-Katz M, Alfarawati M, Stevens J, Colls P, Goodall N,
Tormasi S, Mateo-Gutierres C, Prates R, Schoolcraft WB et al.
Comprehensive chromosome screening of polar bodies and
blastocysts from couples experiencing repeated implantation failure.
Hum Reprod 2009; June 21 [Epub ahead of print].
Goossens V, Harton G, Moutou C, Traeger-Synodinos J, Van Rij M,
Harper JC. ESHRE PGD Consortium data collection IX: cycles from
January to December 2006 with pregnancy follow-up to October
2007. Hum Reprod 2009;24:1786–1810.
Hardarson T, Hanson C, Lundin K, Hillensjo T, Nilsson L, Stevic J,
Reismer E, Borg K, Wikland M, Bergh C. Preimplantation genetic
screening in women of advanced maternal age caused a decrease in
clinical pregnancy rate: a randomised controlled trial. Hum Reprod
2008;23:2806–2812.
Hassold T, Hunt P. To err (meiotically) is human: the genesis of human
aneuploidy. Nat Rev Genet 2001;2:280–291.
Hassold T, Hall H, Hunt P. The origin of human aneuploidy: where
we have been, where we are going. Hum Mol Genet 2007;16:
R203–R208.
Johnson DS, Gemelos G, Baner J, Ryan A, Cinnioglu C, Banjevic M, Ross R,
Alper M, Barrett B, Frederick J et al. Preclinical validation of a microarray
method for full molecular karyotyping of blastomeres in a 24-h protocol.
Hum Reprod 2010;25:1066–1075.
Li M, DeUgarte CM, Surrey M, Danser H, DeCherney A, Hill DL.
Fluorescence in situ hybridisation reanalysis of day-6 human blastocysts
diagnosed with aneuploidy on day 3. Fertil Steril 2005;84:1395–1400.
Magli MC, Jones GM, Gras L, Gianaroli L, Korman I, Trounson AO.
Chromosome mosaicism in day 3 aneuploid embryos that develop to
morphologically normal blastocysts in vitro. Hum Reprod 2000;
15:1781–1786.
Mastenbroek S, Twisk M, van Echten-Arends J, Sikkema-Raddatz B,
Korevaar JC, Verhoeve HR, Vogel NE, Arts EG, de Vries JW,
Bossuyt PM et al. In vitro fertilization with preimplantation genetic
screening. N Engl J Med 2007;357:9–17.
Munne S, Grifo J, Cohen J, Weier HU. Chromosome abnormalities in
human arrested preimplantation embryos: a multiple-probe FISH
study. Am J Hum Genet 1994;55:150–159.
Munne S, Velilla E, Colls P, Garcia Bermudes M, Vemuri MC,
Steuerwald N, Garrisi J, Cohen J. Self-correction of chromosomally
abnormal embryos in culture and implications for stem cell
production. Fertil Steril 2005;84:1328–1334.
Practice Committee of the Society for Assisted Reproductive Technology
and Practice Committee of the American Society for Reproductive
Medicine. Preimplantation genetic testing: a Practice Committee
opinion. Fertil Steril 2007;88:1497–1504.
Schoolcraft WB, Katz-Jaffe MG, Stevens J, Rawlins M, Munne S.
Preimplantation aneuploidy testing for infertile patients of advanced
maternal age: a randomized prospective trial. Fertil Steril 2009;
92:157–162.
Scott RT Jr, Treff NR. Assessing the reproductive competence of individual
embryos: a proposal for the validation of new “-omics” technologies.
Fertil Steril 2010; Epub ahead of print May 4.
Staessen C, Platteau P, Van Assche E, Michiels A, Tournaye H, Camus M,
Devroey P, Liebaers I, Van Steirteghem A. Comparison of blastocyst
transfer with or without preimplantation genetic diagnosis for
aneuploidy screening in couples with advanced maternal age: a
prospective randomised controlled trial. Hum Reprod 2004;
19:2849–2858.
Staessen C, VerpoestW, Donoso P, Haentjens P, Van der Elst J, Liebaers I,
Devroey P. Preimplantation genetic screening does not improve delivery
rate in women under the age of 36 following single-embryo transfer.
Hum Reprod 2008;23:2818–2825.
Downloaded from http://molehr.oxfordjournals.org/ at National Taiwan University Library on September 4, 2014
7. Microarray-based aneuploidy screening is more consistent than FISH 589
Treff NR, Su J, Tao X, Levy B, Scott RT Jr. Accurate single cell 24
chromosome aneuploidy screening using whole genome amplification
and single nucleotide polymorphism microarrays. Fertil Steril 2010;
[Epub ahead of print, February 24].
Vanneste E,VoetT, Le Caignec C,Ampe M, Konings P,MelotteC, Debrock S,
Amyere M, Vikkula M, Schuit F et al. Chromosome instability is common in
human cleavage-stage embryos. Nat Med 2009;15:577–583.
Voullaire L, Slater H, Williamson R, Wilton L. Chromosome analysis of
blastomeres from human embryos by using comparative genomic
hybridization. Hum Genet 2000;106:210–217.
Wells D, Delhanty JD. Comprehensive chromosomal analysis of human
preimplantation embryos using whole genome amplification and single
cell comparative genomic hybridization. Mol Hum Reprod 2000;
6:1055–1062.
Downloaded from http://molehr.oxfordjournals.org/ at National Taiwan University Library on September 4, 2014