Theoritical Statistics Assignment Help

Statisticsassignmentexperts.com is an organisation committed to providing world class education solutions in the subject of Statistics to students across the globe. We specialise in offering a multitude of educational services to students for Statistics, who are studying in various institutes and universities, be it assignments, online tutoring, project work, dissertation/thesis, or exam preparation. When it comes to information and communication technologies, we employ state-of-the-art and latest tools and technology to connect with students and expert tutors. Students from various countries including the USA, UK, Canada, UAE and Australia have used our services for the past several years to achieve excellence in their academic and professional pursuits. Statisticsassignmentexperts.com works closely with its strong and dynamic team of subject experts to create new models for exchange of information, in consonance with the changing needs of students as well as academic and professional programs.

Recommended
Recommended
More Related Content
Recently uploaded
Recently uploaded (20)
Featured
Featured (20)
Theoritical Statistics Assignment Help
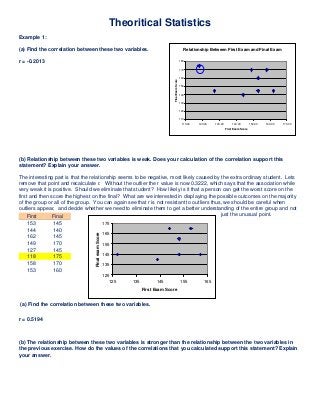
- 1. Theoritical Statistics Example 1: (a) Find the correlation between these two variables. r = -0.2013 (b) Relationship between these two variables is weak. Does your calculation of the correlation support this statement? Explain your answer. The interesting part is that the relationship seems to be negative, most likely caused by the extra ordinary student. Lets remove that point and recalculate r. Without the outlier the r value is now 0.3222, which says that the association while very weak it is positive. Should we eliminate that student? How likely is it that a person can get the worst score on the first and then score the highest on the final? What are we interested in displaying the possible outcomes on the majority of the group or all of the group. You can again see that r is not resistant to outliers thus, we should be careful when outliers appear, and decide whether we need to eliminate them to get a better understanding of the entire group and not just the unusual point. (a) Find the correlation between these two variables. r = 0.5194 (b) The relationship between these two variables is stronger than the relationship between the two variables in the previous exercise. How do the values of the correlations that you calculated support this statement? Explain your answer. First Final 153 145 144 140 162 145 149 170 127 145 118 175 158 170 153 160 Relationship Between First Exam and Final Exam 110 120 130 140 150 160 170 180 110.00 120.00 130.00 140.00 150.00 160.00 170.00 First Exam Score FinalExamScore 125 135 145 155 165 175 125 135 145 155 165 First Exam Score FinalexamScore
- 2. The variation about a straight line seems to be less and as the second exam score increases there is a larger increase in the average value of the final exam score. Yet one can still see a quite a lot of variation about the average trend line, thus the reason for the correlation value of 0.5194. 130 140 150 160 170 180 190 200 130 140 150 160 170 180 Score for Second Exam ScoreonFinal Example 2: Refer to the previous exercise. Add a ninth student whose scores on the second test and final exam would lead you to classify the additional data point as an outlier. Recalculate the correlation with this additional case and summarize the effect it has on the value of the correlation. Second Final 1 158 145 2 162 140 3 144 145 4 162 170 5 136 145 6 158 175 7 175 170 8 153 160 9 200 200 The ninth student gets two perfect scores on the second and the final (assuming that 200 is the most one can score). The corresponding r value is 0.8015. This is quite a large change from r = 0.5194.
- 3. 130 140 150 160 170 180 190 200 130 140 150 160 170 180 190 200 210 Score for Second Exam ScoreonFinal Example 3: Make a scatterplot find the correlation r. Explain why r is close to zero despite a strong relationship between speed and gas used. The value of r = -0.1716 The value of r only measures how close our data follows a linear relationship, which this situation does not. Notice r = 0 despite the fact that we do not have a straight line. This shows the importance of looking at the scatterplot. Example 4:- What's wrong? Each of the following statements contains a blunder. Explain in each case what is wrong. (a) "There is a high correlation between the gender of American workers and their income." Gender is a categorical variable. The correlation value r is only to be used to indicate linear association between two quantitative variables. (b) "We found a high correlation (r = 1.09) between students' ratings of faculty teaching and ratings made by other faculty members." The r value can only be a number in the interval [-1, 1]. Chart Title 0 5 10 15 20 25 0 50 100 150 200 Speed (km/h) FuelSpent(l/100km) Fuel Linear (Fuel)
- 4. (c) "The correlation between planting rate and yield of corn was found to be r = 0.23 bushel." The statistic r is a unitless number, thus the statement above, “…was found to be r = 0.23 bushel." attaches a unit to r which is not correct. The correlation r does not depend on the unit of the measurement.