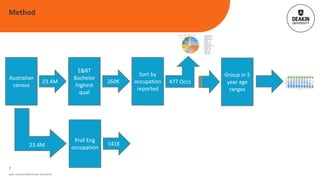
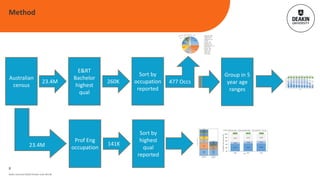
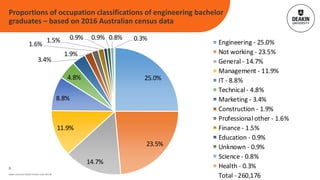
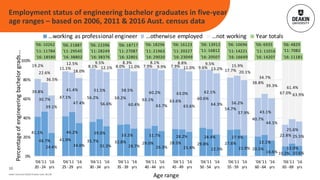
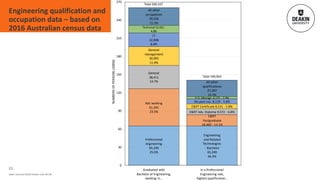
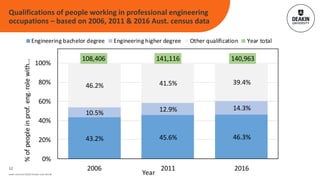
Deakin University CRICOS Provider Code: 00113B
Stuart Palmer
Malcolm Campbell
Deakin University
Using census data to
better understand
engineering
occupational
outcomes
Deakin University CRICOS Provider Code: 00113B
Historically high rates of graduate employment
Benefited from Australian mining boom
More recently, both enrolments and graduate employment have declined
Semi-regular appeals for engineering curricula to be more ‘authentic’, ‘real-world’, ‘industry-
relevant’, etc.
Almost always premised on a view that most, if not all, graduates from undergraduate
engineering programs will go into professional engineering practice in ‘industry’
However, the reality is that, internationally, many engineering graduates never work in
professional engineering practice, or if they do, they do not remain in that sector very long
Here we use Australian national census data from 2006, 2011 and 2016 to identify the makeup
of the professional engineering workforce and the occupational outcomes for graduates of
undergraduate engineering programs in Australia
Background – Engineering in Australia
2
Deakin University CRICOS Provider Code: 00113B
Method
3
Australian
census
23.4M
Deakin University CRICOS Provider Code: 00113B
Method
4
Australian
census
23.4M
E&RT
Bachelor
highest
qual
260K
25.0%
23.5%
14.7%
11.9%
8.8%
4.8%
3.4%
1.9%
1.6%
1.5% 0.9% 0.9% 0.8% 0.3%
Engineering - 25.0%
Not working - 23.5%
General - 14.7%
Management - 11.9%
IT - 8.8%
Technical - 4.8%
Marketing - 3.4%
Construction - 1.9%
Professional other - 1.6%
Finance - 1.5%
Education - 0.9%
Unknown - 0.9%
Science - 0.8%
Health - 0.3%
Total - 260,176
Deakin University CRICOS Provider Code: 00113B
Method
5
Australian
census
23.4M
E&RT
Bachelor
highest
qual
260K
Sort by
occupation
reported
477 Occs
25.0%
23.5%
14.7%
11.9%
8.8%
4.8%
3.4%
1.9%
1.6%
1.5% 0.9% 0.9% 0.8% 0.3%
Engineering - 25.0%
Not working - 23.5%
General - 14.7%
Management - 11.9%
IT - 8.8%
Technical - 4.8%
Marketing - 3.4%
Construction - 1.9%
Professional other - 1.6%
Finance - 1.5%
Education - 0.9%
Unknown - 0.9%
Science - 0.8%
Health - 0.3%
Total - 260,176
Deakin University CRICOS Provider Code: 00113B
Method
6
Australian
census
23.4M
E&RT
Bachelor
highest
qual
260K
Sort by
occupation
reported
477 Occs
Group in 5
year age
ranges
41.1%
46.7%
24.4%
41.9%
46.2%
34.6%
35.7%
39.0%
31.3%
32.8%
33.2%
28.7%
29.0%
31.7%
26.3%
28.5%
28.2%
25.4%
29.8%
28.4%
22.5%
27.6%
27.9%
21.9% 20.5%
22.1%
16.6% 10.2%
13.0%
10.6%
39.8%
30.7%
39.1%
47.1%
41.4%
47.4%
56.2%
51.5%
56.6%
59.2%
58.5%
60.4%
63.1%
60.2%
63.7%
63.6%
63.0%
63.6%
60.6%
62.1%
64.3%
54.7%
56.2%
57.9%
40.7%
43.1%
44.1%
22.8%
25.6%
25.5%
19.2%
22.6%
36.5%
11.1%
12.5%
18.0%
8.1%
9.5%
12.1% 8.0%
8.3%
11.0% 7.9%
8.1%
9.9% 7.9%
8.8%
11.0% 9.6%
9.5%
13.2% 17.7%
15.9%
20.1%
38.8%
34.7%
39.3%
67.0%
61.4%
63.9%
'06: 10262
'11: 11784
'16: 18580
'06: 21887
'11: 29545
'16: 38802
'06: 22396
'11: 28249
'16: 38376
'06: 18717
'11: 27087
'16: 32801
'06: 18296
'11: 21963
'16: 29020
'06: 16123
'11: 20227
'16: 23049
'06: 13912
'11: 16812
'16: 20507
'06: 10696
'11: 14221
'16: 16649
'06: 6935
'11: 11016
'16: 14207
'06: 4829
'11: 7082
'16: 11181
0%
20%
40%
60%
80%
100%
'06
20 -
'11
24
'16
yrs
'06
25 -
'11
29
'16
yrs
'06
30 -
'11
34
'16
yrs
'06
35 -
'11
39
'16
yrs
'06
40 -
'11
44
'16
yrs
'06
45 -
'11
49
'16
yrs
'06
50 -
'11
54
'16
yrs
'06
55 -
'11
59
'16
yrs
'06
60 -
'11
64
'16
yrs
'06
65 -
'11
69
'16
yrs
Percentageofengineeringbachelorgrads...
Age range
…working as professional engineer …otherwise employed …not working Year totals
23.4M
25.0%
23.5%
14.7%
11.9%
8.8%
4.8%
3.4%
1.9%
1.6%
1.5% 0.9% 0.9% 0.8% 0.3%
Engineering - 25.0%
Not working - 23.5%
General - 14.7%
Management - 11.9%
IT - 8.8%
Technical - 4.8%
Marketing - 3.4%
Construction - 1.9%
Professional other - 1.6%
Finance - 1.5%
Education - 0.9%
Unknown - 0.9%
Science - 0.8%
Health - 0.3%
Total - 260,176
Deakin University CRICOS Provider Code: 00113B
Method
7
Australian
census
23.4M
E&RT
Bachelor
highest
qual
260K
Sort by
occupation
reported
477 Occs
Group in 5
year age
ranges
41.1%
46.7%
24.4%
41.9%
46.2%
34.6%
35.7%
39.0%
31.3%
32.8%
33.2%
28.7%
29.0%
31.7%
26.3%
28.5%
28.2%
25.4%
29.8%
28.4%
22.5%
27.6%
27.9%
21.9% 20.5%
22.1%
16.6% 10.2%
13.0%
10.6%
39.8%
30.7%
39.1%
47.1%
41.4%
47.4%
56.2%
51.5%
56.6%
59.2%
58.5%
60.4%
63.1%
60.2%
63.7%
63.6%
63.0%
63.6%
60.6%
62.1%
64.3%
54.7%
56.2%
57.9%
40.7%
43.1%
44.1%
22.8%
25.6%
25.5%
19.2%
22.6%
36.5%
11.1%
12.5%
18.0%
8.1%
9.5%
12.1% 8.0%
8.3%
11.0% 7.9%
8.1%
9.9% 7.9%
8.8%
11.0% 9.6%
9.5%
13.2% 17.7%
15.9%
20.1%
38.8%
34.7%
39.3%
67.0%
61.4%
63.9%
'06: 10262
'11: 11784
'16: 18580
'06: 21887
'11: 29545
'16: 38802
'06: 22396
'11: 28249
'16: 38376
'06: 18717
'11: 27087
'16: 32801
'06: 18296
'11: 21963
'16: 29020
'06: 16123
'11: 20227
'16: 23049
'06: 13912
'11: 16812
'16: 20507
'06: 10696
'11: 14221
'16: 16649
'06: 6935
'11: 11016
'16: 14207
'06: 4829
'11: 7082
'16: 11181
0%
20%
40%
60%
80%
100%
'06
20 -
'11
24
'16
yrs
'06
25 -
'11
29
'16
yrs
'06
30 -
'11
34
'16
yrs
'06
35 -
'11
39
'16
yrs
'06
40 -
'11
44
'16
yrs
'06
45 -
'11
49
'16
yrs
'06
50 -
'11
54
'16
yrs
'06
55 -
'11
59
'16
yrs
'06
60 -
'11
64
'16
yrs
'06
65 -
'11
69
'16
yrs
Percentageofengineeringbachelorgrads...
Age range
…working as professional engineer …otherwise employed …not working Year totals
23.4M
Prof Eng
occupation
141K
25.0%
23.5%
14.7%
11.9%
8.8%
4.8%
3.4%
1.9%
1.6%
1.5% 0.9% 0.9% 0.8% 0.3%
Engineering - 25.0%
Not working - 23.5%
General - 14.7%
Management - 11.9%
IT - 8.8%
Technical - 4.8%
Marketing - 3.4%
Construction - 1.9%
Professional other - 1.6%
Finance - 1.5%
Education - 0.9%
Unknown - 0.9%
Science - 0.8%
Health - 0.3%
Total - 260,176
Deakin University CRICOS Provider Code: 00113B
Method
8
Australian
census
23.4M
E&RT
Bachelor
highest
qual
260K
Sort by
occupation
reported
477 Occs
Group in 5
year age
ranges
41.1%
46.7%
24.4%
41.9%
46.2%
34.6%
35.7%
39.0%
31.3%
32.8%
33.2%
28.7%
29.0%
31.7%
26.3%
28.5%
28.2%
25.4%
29.8%
28.4%
22.5%
27.6%
27.9%
21.9% 20.5%
22.1%
16.6% 10.2%
13.0%
10.6%
39.8%
30.7%
39.1%
47.1%
41.4%
47.4%
56.2%
51.5%
56.6%
59.2%
58.5%
60.4%
63.1%
60.2%
63.7%
63.6%
63.0%
63.6%
60.6%
62.1%
64.3%
54.7%
56.2%
57.9%
40.7%
43.1%
44.1%
22.8%
25.6%
25.5%
19.2%
22.6%
36.5%
11.1%
12.5%
18.0%
8.1%
9.5%
12.1% 8.0%
8.3%
11.0% 7.9%
8.1%
9.9% 7.9%
8.8%
11.0% 9.6%
9.5%
13.2% 17.7%
15.9%
20.1%
38.8%
34.7%
39.3%
67.0%
61.4%
63.9%
'06: 10262
'11: 11784
'16: 18580
'06: 21887
'11: 29545
'16: 38802
'06: 22396
'11: 28249
'16: 38376
'06: 18717
'11: 27087
'16: 32801
'06: 18296
'11: 21963
'16: 29020
'06: 16123
'11: 20227
'16: 23049
'06: 13912
'11: 16812
'16: 20507
'06: 10696
'11: 14221
'16: 16649
'06: 6935
'11: 11016
'16: 14207
'06: 4829
'11: 7082
'16: 11181
0%
20%
40%
60%
80%
100%
'06
20 -
'11
24
'16
yrs
'06
25 -
'11
29
'16
yrs
'06
30 -
'11
34
'16
yrs
'06
35 -
'11
39
'16
yrs
'06
40 -
'11
44
'16
yrs
'06
45 -
'11
49
'16
yrs
'06
50 -
'11
54
'16
yrs
'06
55 -
'11
59
'16
yrs
'06
60 -
'11
64
'16
yrs
'06
65 -
'11
69
'16
yrs
Percentageofengineeringbachelorgrads...
Age range
…working as professional engineer …otherwise employed …not working Year totals
23.4M
Prof Eng
occupation
141K
Professional
engineering
65,240
25.0%
Engineering
and Related
Technologies
- Bachelor
65,240
46.3%
Not working
61,345
23.5%
E&RT
Postgraduate
18,469 - 13.1%
General
38,411
14.7%
E&RT Adv. Diploma 9,572 - 6.8%
General
management
30,995
11.9%
E&RT Certificate 8,231 - 5.8%
I.T.
22,908
8.8%
No post-sec. 8,119 - 5.8%
Technical 12,421 -
4.8%
P.G. Manage.4,125 - 2.9%
All other
occupations
29,536
11.3%
All other
qualifications
27,207
19.3%
Total 260,167
Total 140,963
0
30
60
90
120
150
180
210
240
270
Graduated with
Bachelor of Engineering,
working in…
In a Professional
Engineering role,
highest qualification…
NUMBERSOFPERSONS(1000S)
43.2% 45.6% 46.3%
10.5% 12.9% 14.3%
46.2% 41.5% 39.4%
108,406 141,116 140,963
0%
20%
40%
60%
80%
100%
2006 2011 2016
%ofpeopleinprof.eng.rolewith...
Year
Engineering bachelor degree Engineering higher degree Other qualification Year total
Sort by
highest
qual
reported
25.0%
23.5%
14.7%
11.9%
8.8%
4.8%
3.4%
1.9%
1.6%
1.5% 0.9% 0.9% 0.8% 0.3%
Engineering - 25.0%
Not working - 23.5%
General - 14.7%
Management - 11.9%
IT - 8.8%
Technical - 4.8%
Marketing - 3.4%
Construction - 1.9%
Professional other - 1.6%
Finance - 1.5%
Education - 0.9%
Unknown - 0.9%
Science - 0.8%
Health - 0.3%
Total - 260,176Deakin University CRICOS Provider Code: 00113B
Proportions of occupation classifications of engineering bachelor
graduates – based on 2016 Australian census data
9
41.1%
46.7%
24.4%
41.9%
46.2%
34.6%
35.7%
39.0%
31.3%
32.8%
33.2%
28.7%
29.0%
31.7%
26.3%
28.5%
28.2%
25.4%
29.8%
28.4%
22.5%
27.6%
27.9%
21.9% 20.5%
22.1%
16.6% 10.2%
13.0%
10.6%
39.8%
30.7%
39.1%
47.1%
41.4%
47.4%
56.2%
51.5%
56.6%
59.2%
58.5%
60.4%
63.1%
60.2%
63.7%
63.6%
63.0%
63.6%
60.6%
62.1%
64.3%
54.7%
56.2%
57.9%
40.7%
43.1%
44.1%
22.8%
25.6%
25.5%
19.2%
22.6%
36.5%
11.1%
12.5%
18.0%
8.1%
9.5%
12.1% 8.0%
8.3%
11.0% 7.9%
8.1%
9.9% 7.9%
8.8%
11.0% 9.6%
9.5%
13.2% 17.7%
15.9%
20.1%
38.8%
34.7%
39.3%
67.0%
61.4%
63.9%
'06: 10262
'11: 11784
'16: 18580
'06: 21887
'11: 29545
'16: 38802
'06: 22396
'11: 28249
'16: 38376
'06: 18717
'11: 27087
'16: 32801
'06: 18296
'11: 21963
'16: 29020
'06: 16123
'11: 20227
'16: 23049
'06: 13912
'11: 16812
'16: 20507
'06: 10696
'11: 14221
'16: 16649
'06: 6935
'11: 11016
'16: 14207
'06: 4829
'11: 7082
'16: 11181
0%
20%
40%
60%
80%
100%
'06
20 -
'11
24
'16
yrs
'06
25 -
'11
29
'16
yrs
'06
30 -
'11
34
'16
yrs
'06
35 -
'11
39
'16
yrs
'06
40 -
'11
44
'16
yrs
'06
45 -
'11
49
'16
yrs
'06
50 -
'11
54
'16
yrs
'06
55 -
'11
59
'16
yrs
'06
60 -
'11
64
'16
yrs
'06
65 -
'11
69
'16
yrs
Percentageofengineeringbachelorgrads...
Age range
…working as professional engineer …otherwise employed …not working Year totals
Deakin University CRICOS Provider Code: 00113B
10
Employment status of engineering bachelor graduates in five-year
age ranges – based on 2006, 2011 & 2016 Aust. census data
Deakin University CRICOS Provider Code: 00113B
Engineering qualification and
occupation data – based on
2016 Australian census data
11
Professional
engineering
65,240
25.0%
Engineering
and Related
Technologies
- Bachelor
65,240
46.3%
Not working
61,345
23.5%
E&RT
Postgraduate
18,469 - 13.1%
General
38,411
14.7%
E&RT Adv. Diploma 9,572 - 6.8%
General
management
30,995
11.9%
E&RT Certificate 8,231 - 5.8%
I.T.
22,908
8.8%
No post-sec. 8,119 - 5.8%
Technical 12,421 -
4.8%
P.G. Manage.4,125 - 2.9%
All other
occupations
29,536
11.3%
All other
qualifications
27,207
19.3%
Total 260,167
Total 140,963
0
30
60
90
120
150
180
210
240
270
Graduated with
Bachelor of Engineering,
working in…
In a Professional
Engineering role,
highest qualification…
NUMBERSOFPERSONS(1000S)
43.2% 45.6% 46.3%
10.5% 12.9% 14.3%
46.2% 41.5% 39.4%
108,406 141,116 140,963
0%
20%
40%
60%
80%
100%
2006 2011 2016
%ofpeopleinprof.eng.rolewith...
Year
Engineering bachelor degree Engineering higher degree Other qualification Year total
Deakin University CRICOS Provider Code: 00113B
Qualifications of people working in professional engineering
occupations – based on 2006, 2011 & 2016 Aust. census data
12
Deakin University CRICOS Provider Code: 00113B
Many new engineering graduates, and eventually most graduates, do not work in a PE role
Where graduates work out of field, it is often framed negatively – as ‘wastage’ or ‘attrition’
There are literally not enough PE roles in Australia for all Australian engineering graduates
(I contend) An engineering graduate working ‘out of field’ is not a second-class outcome
What is considered an authentic curriculum should be reconceptualised
Those significant number of engineering graduates who have historically found themselves
working out of field have, knowingly or otherwise, turned a problem into an opportunity,
finding gainful ways to use their engineering knowledge and skills
This empirically validated engineering solution offers guidance to engineering educators
Implications for undergraduate engineering curricula
13
Deakin University CRICOS Provider Code: 00113B
Over time, various models of reformed/contemporary/authentic engineering
education have been proposed to make graduate more ‘employable’
The next advance in engineering education in Australia is likely to come via the
acceptance that it is educating many students for work outside of the
profession, including for many immediately following graduation
Designers of engineering curriculum need to become more skilled at mapping
generic graduate skills to ensure that graduates see these skills more visibly
within the curriculum and recognise their application to a broader sector of the
job market
Implications for undergraduate engineering curricula
14
Deakin University CRICOS Provider Code: 00113B
Thank you for your time

Sp181012ss

  • 1.
    Deakin University CRICOSProvider Code: 00113B Stuart Palmer Malcolm Campbell Deakin University Using census data to better understand engineering occupational outcomes
  • 2.
    Deakin University CRICOSProvider Code: 00113B Historically high rates of graduate employment Benefited from Australian mining boom More recently, both enrolments and graduate employment have declined Semi-regular appeals for engineering curricula to be more ‘authentic’, ‘real-world’, ‘industry- relevant’, etc. Almost always premised on a view that most, if not all, graduates from undergraduate engineering programs will go into professional engineering practice in ‘industry’ However, the reality is that, internationally, many engineering graduates never work in professional engineering practice, or if they do, they do not remain in that sector very long Here we use Australian national census data from 2006, 2011 and 2016 to identify the makeup of the professional engineering workforce and the occupational outcomes for graduates of undergraduate engineering programs in Australia Background – Engineering in Australia 2
  • 3.
    Deakin University CRICOSProvider Code: 00113B Method 3 Australian census 23.4M
  • 4.
    Deakin University CRICOSProvider Code: 00113B Method 4 Australian census 23.4M E&RT Bachelor highest qual 260K
  • 5.
    25.0% 23.5% 14.7% 11.9% 8.8% 4.8% 3.4% 1.9% 1.6% 1.5% 0.9% 0.9%0.8% 0.3% Engineering - 25.0% Not working - 23.5% General - 14.7% Management - 11.9% IT - 8.8% Technical - 4.8% Marketing - 3.4% Construction - 1.9% Professional other - 1.6% Finance - 1.5% Education - 0.9% Unknown - 0.9% Science - 0.8% Health - 0.3% Total - 260,176 Deakin University CRICOS Provider Code: 00113B Method 5 Australian census 23.4M E&RT Bachelor highest qual 260K Sort by occupation reported 477 Occs
  • 6.
    25.0% 23.5% 14.7% 11.9% 8.8% 4.8% 3.4% 1.9% 1.6% 1.5% 0.9% 0.9%0.8% 0.3% Engineering - 25.0% Not working - 23.5% General - 14.7% Management - 11.9% IT - 8.8% Technical - 4.8% Marketing - 3.4% Construction - 1.9% Professional other - 1.6% Finance - 1.5% Education - 0.9% Unknown - 0.9% Science - 0.8% Health - 0.3% Total - 260,176 Deakin University CRICOS Provider Code: 00113B Method 6 Australian census 23.4M E&RT Bachelor highest qual 260K Sort by occupation reported 477 Occs Group in 5 year age ranges 41.1% 46.7% 24.4% 41.9% 46.2% 34.6% 35.7% 39.0% 31.3% 32.8% 33.2% 28.7% 29.0% 31.7% 26.3% 28.5% 28.2% 25.4% 29.8% 28.4% 22.5% 27.6% 27.9% 21.9% 20.5% 22.1% 16.6% 10.2% 13.0% 10.6% 39.8% 30.7% 39.1% 47.1% 41.4% 47.4% 56.2% 51.5% 56.6% 59.2% 58.5% 60.4% 63.1% 60.2% 63.7% 63.6% 63.0% 63.6% 60.6% 62.1% 64.3% 54.7% 56.2% 57.9% 40.7% 43.1% 44.1% 22.8% 25.6% 25.5% 19.2% 22.6% 36.5% 11.1% 12.5% 18.0% 8.1% 9.5% 12.1% 8.0% 8.3% 11.0% 7.9% 8.1% 9.9% 7.9% 8.8% 11.0% 9.6% 9.5% 13.2% 17.7% 15.9% 20.1% 38.8% 34.7% 39.3% 67.0% 61.4% 63.9% '06: 10262 '11: 11784 '16: 18580 '06: 21887 '11: 29545 '16: 38802 '06: 22396 '11: 28249 '16: 38376 '06: 18717 '11: 27087 '16: 32801 '06: 18296 '11: 21963 '16: 29020 '06: 16123 '11: 20227 '16: 23049 '06: 13912 '11: 16812 '16: 20507 '06: 10696 '11: 14221 '16: 16649 '06: 6935 '11: 11016 '16: 14207 '06: 4829 '11: 7082 '16: 11181 0% 20% 40% 60% 80% 100% '06 20 - '11 24 '16 yrs '06 25 - '11 29 '16 yrs '06 30 - '11 34 '16 yrs '06 35 - '11 39 '16 yrs '06 40 - '11 44 '16 yrs '06 45 - '11 49 '16 yrs '06 50 - '11 54 '16 yrs '06 55 - '11 59 '16 yrs '06 60 - '11 64 '16 yrs '06 65 - '11 69 '16 yrs Percentageofengineeringbachelorgrads... Age range …working as professional engineer …otherwise employed …not working Year totals 23.4M
  • 7.
    25.0% 23.5% 14.7% 11.9% 8.8% 4.8% 3.4% 1.9% 1.6% 1.5% 0.9% 0.9%0.8% 0.3% Engineering - 25.0% Not working - 23.5% General - 14.7% Management - 11.9% IT - 8.8% Technical - 4.8% Marketing - 3.4% Construction - 1.9% Professional other - 1.6% Finance - 1.5% Education - 0.9% Unknown - 0.9% Science - 0.8% Health - 0.3% Total - 260,176 Deakin University CRICOS Provider Code: 00113B Method 7 Australian census 23.4M E&RT Bachelor highest qual 260K Sort by occupation reported 477 Occs Group in 5 year age ranges 41.1% 46.7% 24.4% 41.9% 46.2% 34.6% 35.7% 39.0% 31.3% 32.8% 33.2% 28.7% 29.0% 31.7% 26.3% 28.5% 28.2% 25.4% 29.8% 28.4% 22.5% 27.6% 27.9% 21.9% 20.5% 22.1% 16.6% 10.2% 13.0% 10.6% 39.8% 30.7% 39.1% 47.1% 41.4% 47.4% 56.2% 51.5% 56.6% 59.2% 58.5% 60.4% 63.1% 60.2% 63.7% 63.6% 63.0% 63.6% 60.6% 62.1% 64.3% 54.7% 56.2% 57.9% 40.7% 43.1% 44.1% 22.8% 25.6% 25.5% 19.2% 22.6% 36.5% 11.1% 12.5% 18.0% 8.1% 9.5% 12.1% 8.0% 8.3% 11.0% 7.9% 8.1% 9.9% 7.9% 8.8% 11.0% 9.6% 9.5% 13.2% 17.7% 15.9% 20.1% 38.8% 34.7% 39.3% 67.0% 61.4% 63.9% '06: 10262 '11: 11784 '16: 18580 '06: 21887 '11: 29545 '16: 38802 '06: 22396 '11: 28249 '16: 38376 '06: 18717 '11: 27087 '16: 32801 '06: 18296 '11: 21963 '16: 29020 '06: 16123 '11: 20227 '16: 23049 '06: 13912 '11: 16812 '16: 20507 '06: 10696 '11: 14221 '16: 16649 '06: 6935 '11: 11016 '16: 14207 '06: 4829 '11: 7082 '16: 11181 0% 20% 40% 60% 80% 100% '06 20 - '11 24 '16 yrs '06 25 - '11 29 '16 yrs '06 30 - '11 34 '16 yrs '06 35 - '11 39 '16 yrs '06 40 - '11 44 '16 yrs '06 45 - '11 49 '16 yrs '06 50 - '11 54 '16 yrs '06 55 - '11 59 '16 yrs '06 60 - '11 64 '16 yrs '06 65 - '11 69 '16 yrs Percentageofengineeringbachelorgrads... Age range …working as professional engineer …otherwise employed …not working Year totals 23.4M Prof Eng occupation 141K
  • 8.
    25.0% 23.5% 14.7% 11.9% 8.8% 4.8% 3.4% 1.9% 1.6% 1.5% 0.9% 0.9%0.8% 0.3% Engineering - 25.0% Not working - 23.5% General - 14.7% Management - 11.9% IT - 8.8% Technical - 4.8% Marketing - 3.4% Construction - 1.9% Professional other - 1.6% Finance - 1.5% Education - 0.9% Unknown - 0.9% Science - 0.8% Health - 0.3% Total - 260,176 Deakin University CRICOS Provider Code: 00113B Method 8 Australian census 23.4M E&RT Bachelor highest qual 260K Sort by occupation reported 477 Occs Group in 5 year age ranges 41.1% 46.7% 24.4% 41.9% 46.2% 34.6% 35.7% 39.0% 31.3% 32.8% 33.2% 28.7% 29.0% 31.7% 26.3% 28.5% 28.2% 25.4% 29.8% 28.4% 22.5% 27.6% 27.9% 21.9% 20.5% 22.1% 16.6% 10.2% 13.0% 10.6% 39.8% 30.7% 39.1% 47.1% 41.4% 47.4% 56.2% 51.5% 56.6% 59.2% 58.5% 60.4% 63.1% 60.2% 63.7% 63.6% 63.0% 63.6% 60.6% 62.1% 64.3% 54.7% 56.2% 57.9% 40.7% 43.1% 44.1% 22.8% 25.6% 25.5% 19.2% 22.6% 36.5% 11.1% 12.5% 18.0% 8.1% 9.5% 12.1% 8.0% 8.3% 11.0% 7.9% 8.1% 9.9% 7.9% 8.8% 11.0% 9.6% 9.5% 13.2% 17.7% 15.9% 20.1% 38.8% 34.7% 39.3% 67.0% 61.4% 63.9% '06: 10262 '11: 11784 '16: 18580 '06: 21887 '11: 29545 '16: 38802 '06: 22396 '11: 28249 '16: 38376 '06: 18717 '11: 27087 '16: 32801 '06: 18296 '11: 21963 '16: 29020 '06: 16123 '11: 20227 '16: 23049 '06: 13912 '11: 16812 '16: 20507 '06: 10696 '11: 14221 '16: 16649 '06: 6935 '11: 11016 '16: 14207 '06: 4829 '11: 7082 '16: 11181 0% 20% 40% 60% 80% 100% '06 20 - '11 24 '16 yrs '06 25 - '11 29 '16 yrs '06 30 - '11 34 '16 yrs '06 35 - '11 39 '16 yrs '06 40 - '11 44 '16 yrs '06 45 - '11 49 '16 yrs '06 50 - '11 54 '16 yrs '06 55 - '11 59 '16 yrs '06 60 - '11 64 '16 yrs '06 65 - '11 69 '16 yrs Percentageofengineeringbachelorgrads... Age range …working as professional engineer …otherwise employed …not working Year totals 23.4M Prof Eng occupation 141K Professional engineering 65,240 25.0% Engineering and Related Technologies - Bachelor 65,240 46.3% Not working 61,345 23.5% E&RT Postgraduate 18,469 - 13.1% General 38,411 14.7% E&RT Adv. Diploma 9,572 - 6.8% General management 30,995 11.9% E&RT Certificate 8,231 - 5.8% I.T. 22,908 8.8% No post-sec. 8,119 - 5.8% Technical 12,421 - 4.8% P.G. Manage.4,125 - 2.9% All other occupations 29,536 11.3% All other qualifications 27,207 19.3% Total 260,167 Total 140,963 0 30 60 90 120 150 180 210 240 270 Graduated with Bachelor of Engineering, working in… In a Professional Engineering role, highest qualification… NUMBERSOFPERSONS(1000S) 43.2% 45.6% 46.3% 10.5% 12.9% 14.3% 46.2% 41.5% 39.4% 108,406 141,116 140,963 0% 20% 40% 60% 80% 100% 2006 2011 2016 %ofpeopleinprof.eng.rolewith... Year Engineering bachelor degree Engineering higher degree Other qualification Year total Sort by highest qual reported
  • 9.
    25.0% 23.5% 14.7% 11.9% 8.8% 4.8% 3.4% 1.9% 1.6% 1.5% 0.9% 0.9%0.8% 0.3% Engineering - 25.0% Not working - 23.5% General - 14.7% Management - 11.9% IT - 8.8% Technical - 4.8% Marketing - 3.4% Construction - 1.9% Professional other - 1.6% Finance - 1.5% Education - 0.9% Unknown - 0.9% Science - 0.8% Health - 0.3% Total - 260,176Deakin University CRICOS Provider Code: 00113B Proportions of occupation classifications of engineering bachelor graduates – based on 2016 Australian census data 9
  • 10.
    41.1% 46.7% 24.4% 41.9% 46.2% 34.6% 35.7% 39.0% 31.3% 32.8% 33.2% 28.7% 29.0% 31.7% 26.3% 28.5% 28.2% 25.4% 29.8% 28.4% 22.5% 27.6% 27.9% 21.9% 20.5% 22.1% 16.6% 10.2% 13.0% 10.6% 39.8% 30.7% 39.1% 47.1% 41.4% 47.4% 56.2% 51.5% 56.6% 59.2% 58.5% 60.4% 63.1% 60.2% 63.7% 63.6% 63.0% 63.6% 60.6% 62.1% 64.3% 54.7% 56.2% 57.9% 40.7% 43.1% 44.1% 22.8% 25.6% 25.5% 19.2% 22.6% 36.5% 11.1% 12.5% 18.0% 8.1% 9.5% 12.1%8.0% 8.3% 11.0% 7.9% 8.1% 9.9% 7.9% 8.8% 11.0% 9.6% 9.5% 13.2% 17.7% 15.9% 20.1% 38.8% 34.7% 39.3% 67.0% 61.4% 63.9% '06: 10262 '11: 11784 '16: 18580 '06: 21887 '11: 29545 '16: 38802 '06: 22396 '11: 28249 '16: 38376 '06: 18717 '11: 27087 '16: 32801 '06: 18296 '11: 21963 '16: 29020 '06: 16123 '11: 20227 '16: 23049 '06: 13912 '11: 16812 '16: 20507 '06: 10696 '11: 14221 '16: 16649 '06: 6935 '11: 11016 '16: 14207 '06: 4829 '11: 7082 '16: 11181 0% 20% 40% 60% 80% 100% '06 20 - '11 24 '16 yrs '06 25 - '11 29 '16 yrs '06 30 - '11 34 '16 yrs '06 35 - '11 39 '16 yrs '06 40 - '11 44 '16 yrs '06 45 - '11 49 '16 yrs '06 50 - '11 54 '16 yrs '06 55 - '11 59 '16 yrs '06 60 - '11 64 '16 yrs '06 65 - '11 69 '16 yrs Percentageofengineeringbachelorgrads... Age range …working as professional engineer …otherwise employed …not working Year totals Deakin University CRICOS Provider Code: 00113B 10 Employment status of engineering bachelor graduates in five-year age ranges – based on 2006, 2011 & 2016 Aust. census data
  • 11.
    Deakin University CRICOSProvider Code: 00113B Engineering qualification and occupation data – based on 2016 Australian census data 11 Professional engineering 65,240 25.0% Engineering and Related Technologies - Bachelor 65,240 46.3% Not working 61,345 23.5% E&RT Postgraduate 18,469 - 13.1% General 38,411 14.7% E&RT Adv. Diploma 9,572 - 6.8% General management 30,995 11.9% E&RT Certificate 8,231 - 5.8% I.T. 22,908 8.8% No post-sec. 8,119 - 5.8% Technical 12,421 - 4.8% P.G. Manage.4,125 - 2.9% All other occupations 29,536 11.3% All other qualifications 27,207 19.3% Total 260,167 Total 140,963 0 30 60 90 120 150 180 210 240 270 Graduated with Bachelor of Engineering, working in… In a Professional Engineering role, highest qualification… NUMBERSOFPERSONS(1000S)
  • 12.
    43.2% 45.6% 46.3% 10.5%12.9% 14.3% 46.2% 41.5% 39.4% 108,406 141,116 140,963 0% 20% 40% 60% 80% 100% 2006 2011 2016 %ofpeopleinprof.eng.rolewith... Year Engineering bachelor degree Engineering higher degree Other qualification Year total Deakin University CRICOS Provider Code: 00113B Qualifications of people working in professional engineering occupations – based on 2006, 2011 & 2016 Aust. census data 12
  • 13.
    Deakin University CRICOSProvider Code: 00113B Many new engineering graduates, and eventually most graduates, do not work in a PE role Where graduates work out of field, it is often framed negatively – as ‘wastage’ or ‘attrition’ There are literally not enough PE roles in Australia for all Australian engineering graduates (I contend) An engineering graduate working ‘out of field’ is not a second-class outcome What is considered an authentic curriculum should be reconceptualised Those significant number of engineering graduates who have historically found themselves working out of field have, knowingly or otherwise, turned a problem into an opportunity, finding gainful ways to use their engineering knowledge and skills This empirically validated engineering solution offers guidance to engineering educators Implications for undergraduate engineering curricula 13
  • 14.
    Deakin University CRICOSProvider Code: 00113B Over time, various models of reformed/contemporary/authentic engineering education have been proposed to make graduate more ‘employable’ The next advance in engineering education in Australia is likely to come via the acceptance that it is educating many students for work outside of the profession, including for many immediately following graduation Designers of engineering curriculum need to become more skilled at mapping generic graduate skills to ensure that graduates see these skills more visibly within the curriculum and recognise their application to a broader sector of the job market Implications for undergraduate engineering curricula 14
  • 15.
    Deakin University CRICOSProvider Code: 00113B Thank you for your time