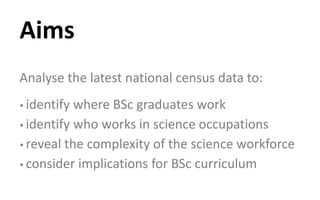
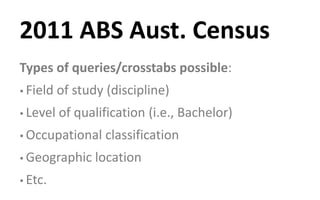
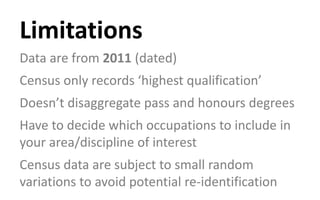
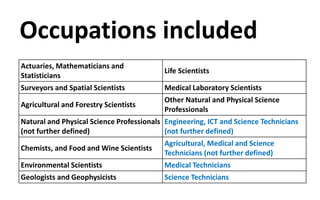
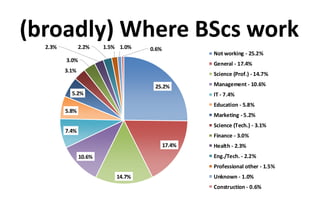
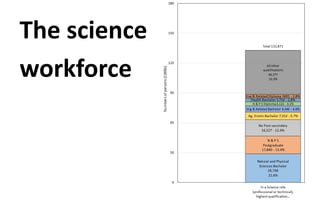
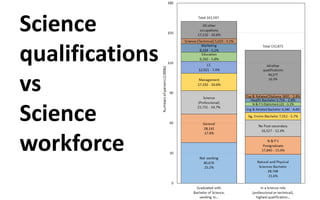
Stuart Palmer(@s_palm )
Malcolm Campbell
Deakin University
Using national census data to
understand the science workforce
and implications for curriculum
design
Aims
Analyse the latest national census data to:
•identify where BSc graduates work
•identify who works in science occupations
•reveal the complexity of the science workforce
•consider implications for BSc curriculum
Types of queries/crosstabs possible:
•Field of study (discipline)
•Level of qualification (i.e., Bachelor)
•Occupational classification
•Geographic location
•Etc.
2011 ABS Aust. Census
Data are from 2011 (dated)
Census only records ‘highest qualification’
Doesn’t disaggregate pass and honours degrees
Have to decide which occupations to include in
your area/discipline of interest
Census data are subject to small random
variations to avoid potential re-identification
Limitations
Occupations included
Actuaries, Mathematicians and
Statisticians
Life Scientists
Surveyors and Spatial Scientists Medical Laboratory Scientists
Agricultural and Forestry Scientists
Other Natural and Physical Science
Professionals
Natural and Physical Science Professionals
(not further defined)
Engineering, ICT and Science Technicians
(not further defined)
Chemists, and Food and Wine Scientists
Agricultural, Medical and Science
Technicians (not further defined)
Environmental Scientists Medical Technicians
Geologists and Geophysicists Science Technicians
25.2%
17.4%
14.7%
10.6%
7.4%
5.8%
5.2%
3.1%
3.0%
2.3% 2.2% 1.5% 1.0% 0.6%
Not working - 25.2%
General - 17.4%
Science (Prof.) - 14.7%
Management - 10.6%
IT - 7.4%
Education - 5.8%
Marketing - 5.2%
Science (Tech.) - 3.1%
Finance - 3.0%
Health - 2.3%
Eng./Tech. - 2.2%
Professional other - 1.5%
Unknown - 1.0%
Construction - 0.6%
(broadly) Where BScs work
13.2%
20.7% 20.0%
15.3% 14.7% 13.8% 14.1% 11.8% 8.7%
4.8%
4.0%
1.4%
0.8%
4.8%
4.9% 3.7%
2.9% 2.7% 2.7% 2.2% 2.3%
1.5%
0.7%
0.1%
48.5%
51.1% 59.1% 65.6% 68.1% 70.3% 69.6%
63.4%
47.7%
26.8%
13.6%
7.3%
4.8%
33.5%
23.4%
17.2% 16.2% 14.5% 13.2% 14.0%
22.5%
42.1%
67.7%
82.3%
91.3% 94.4%
17219 24496 20561 20951 17627 15237 13492 11233 8746 5184 2971 1598 1291
0%
20%
40%
60%
80%
100%
20-24 25-29 30-34 35-39 40-44 45-49 50-54 55-59 60-64 65-69 70-74 75-79 80-84
Percentageofsciencegraduates...
Age range
…working as science professional …working as science technician …otherwise employed …not working Age range total
Variation by age
14.7% 14.4%
29.2%
18.8%
9.5%
28.2%
7.1%
3.1% 3.8%
6.2%
6.4%
2.3%
1.6%
1.6%
57.0% 54.7%
37.4%
58.7%
60.2%
56.3%
77.6%
25.2% 27.1% 27.2%
16.2%
27.9%
14.0% 13.7%
161597 25056 12426 692 2487 16342 863
0%
20%
40%
60%
80%
100%
Bachelor of
Science
Bachelor of
Biological
Science
Bachelor of
Biomedical
Science
Bachelor of
Forensic
Science
Bachelor of
Zoology and
Animal Science
Bachelor of
Environmental
Science
Bachelor of
Fisheries and
Aquaculture
Percentageofsciencegraduates...
Undergraduate science program specialism
…working as science professional …working as science technician …otherwise employed …not working Total
Variation by specialism
17.8%
10.4%
32.0%
39.9%
57.0% 69.8%
49.5%
41.6%
25.2%
19.8% 18.5% 18.4%
161597 14252 200356 164613
0%
20%
40%
60%
80%
100%
Bachelor of Science Bachelor of Agricultural
Science
Bachelor of Engineering Bachelor of Accounting
Percentageofgraduates...
Undergraduate program
…working in the discipline …otherwise employed …not working Total
Compared to…
The science
workforce
Science
qualifications
vs
Science
workforce
What jobs/roles are you educating for?
Where are your graduates (alumni) working?
Where are your students intending to work?
What career outcomes are portrayed in your
course publicity?
Curriculum questions
Who’s on your advisory board?
Do you cover in demand generic STEM skills such
as programming, visualisation and statistics?
What is an authentic science curriculum???
Curriculum questions
•t.co/qbsfuQAL30
Thank you for your time

Sp170106

  • 1.
    Stuart Palmer(@s_palm ) MalcolmCampbell Deakin University Using national census data to understand the science workforce and implications for curriculum design
  • 2.
    Aims Analyse the latestnational census data to: •identify where BSc graduates work •identify who works in science occupations •reveal the complexity of the science workforce •consider implications for BSc curriculum
  • 3.
    Types of queries/crosstabspossible: •Field of study (discipline) •Level of qualification (i.e., Bachelor) •Occupational classification •Geographic location •Etc. 2011 ABS Aust. Census
  • 4.
    Data are from2011 (dated) Census only records ‘highest qualification’ Doesn’t disaggregate pass and honours degrees Have to decide which occupations to include in your area/discipline of interest Census data are subject to small random variations to avoid potential re-identification Limitations
  • 5.
    Occupations included Actuaries, Mathematiciansand Statisticians Life Scientists Surveyors and Spatial Scientists Medical Laboratory Scientists Agricultural and Forestry Scientists Other Natural and Physical Science Professionals Natural and Physical Science Professionals (not further defined) Engineering, ICT and Science Technicians (not further defined) Chemists, and Food and Wine Scientists Agricultural, Medical and Science Technicians (not further defined) Environmental Scientists Medical Technicians Geologists and Geophysicists Science Technicians
  • 6.
    25.2% 17.4% 14.7% 10.6% 7.4% 5.8% 5.2% 3.1% 3.0% 2.3% 2.2% 1.5%1.0% 0.6% Not working - 25.2% General - 17.4% Science (Prof.) - 14.7% Management - 10.6% IT - 7.4% Education - 5.8% Marketing - 5.2% Science (Tech.) - 3.1% Finance - 3.0% Health - 2.3% Eng./Tech. - 2.2% Professional other - 1.5% Unknown - 1.0% Construction - 0.6% (broadly) Where BScs work
  • 7.
    13.2% 20.7% 20.0% 15.3% 14.7%13.8% 14.1% 11.8% 8.7% 4.8% 4.0% 1.4% 0.8% 4.8% 4.9% 3.7% 2.9% 2.7% 2.7% 2.2% 2.3% 1.5% 0.7% 0.1% 48.5% 51.1% 59.1% 65.6% 68.1% 70.3% 69.6% 63.4% 47.7% 26.8% 13.6% 7.3% 4.8% 33.5% 23.4% 17.2% 16.2% 14.5% 13.2% 14.0% 22.5% 42.1% 67.7% 82.3% 91.3% 94.4% 17219 24496 20561 20951 17627 15237 13492 11233 8746 5184 2971 1598 1291 0% 20% 40% 60% 80% 100% 20-24 25-29 30-34 35-39 40-44 45-49 50-54 55-59 60-64 65-69 70-74 75-79 80-84 Percentageofsciencegraduates... Age range …working as science professional …working as science technician …otherwise employed …not working Age range total Variation by age
  • 8.
    14.7% 14.4% 29.2% 18.8% 9.5% 28.2% 7.1% 3.1% 3.8% 6.2% 6.4% 2.3% 1.6% 1.6% 57.0%54.7% 37.4% 58.7% 60.2% 56.3% 77.6% 25.2% 27.1% 27.2% 16.2% 27.9% 14.0% 13.7% 161597 25056 12426 692 2487 16342 863 0% 20% 40% 60% 80% 100% Bachelor of Science Bachelor of Biological Science Bachelor of Biomedical Science Bachelor of Forensic Science Bachelor of Zoology and Animal Science Bachelor of Environmental Science Bachelor of Fisheries and Aquaculture Percentageofsciencegraduates... Undergraduate science program specialism …working as science professional …working as science technician …otherwise employed …not working Total Variation by specialism
  • 9.
    17.8% 10.4% 32.0% 39.9% 57.0% 69.8% 49.5% 41.6% 25.2% 19.8% 18.5%18.4% 161597 14252 200356 164613 0% 20% 40% 60% 80% 100% Bachelor of Science Bachelor of Agricultural Science Bachelor of Engineering Bachelor of Accounting Percentageofgraduates... Undergraduate program …working in the discipline …otherwise employed …not working Total Compared to…
  • 10.
  • 11.
  • 12.
    What jobs/roles areyou educating for? Where are your graduates (alumni) working? Where are your students intending to work? What career outcomes are portrayed in your course publicity? Curriculum questions
  • 13.
    Who’s on youradvisory board? Do you cover in demand generic STEM skills such as programming, visualisation and statistics? What is an authentic science curriculum??? Curriculum questions
  • 14.