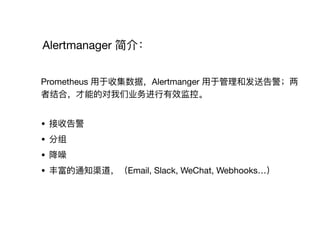
本文档介绍了 Prometheus 及 Alertmanager 的基本概念、安装与配置方法,以及 v1.x 与 v2.x 的性能比较。Prometheus 是一个开源的监控告警系统,适合云和微服务环境。Alertmanager 负责管理和发送告警,为有效监控业务提供支持。


![global:
scrape_interval: 15s
evaluation_interval: 15s
# Alertmanager configuration
alerting:
alertmanagers:
- static_configs:
- targets:
# - alertmanager:9093
rule_files:
# - "first_rules.yml"
# - "second_rules.yml"
scrape_configs:
- job_name: 'prometheus'
static_configs:
- targets: ['localhost:9090']
配置示例例:](https://image.slidesharecdn.com/prometheus101-180322073533/85/Prometheus-101-12-320.jpg)

![物理理主机监控:
• node_expoter: 物理理机运⾏行行状态信息收集
• windows 使⽤用 wmi_exporter
• 配置:
scrape_configs:
- job_name: ‘node’
static_configs:
- targets: ['localhost:9100']](https://image.slidesharecdn.com/prometheus101-180322073533/85/Prometheus-101-15-320.jpg)
![优化:
• 减少数据采集量量:
node_exporter --no-collector.arp --no-collector.bcache
• 降低数据采集频率:
scrape_configs:
- job_name: ‘node’
scrape_interval: 30s # default is 15s
static_configs:
- targets: ['localhost:9100']](https://image.slidesharecdn.com/prometheus101-180322073533/85/Prometheus-101-16-320.jpg)
![CPU 使⽤用率:
100 - (avg by (instance) (irate(node_cpu{ mode="idle"}[5m])) * 100)](https://image.slidesharecdn.com/prometheus101-180322073533/85/Prometheus-101-17-320.jpg)


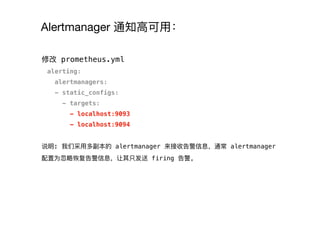
![Alertmanager 配置:
global:
resolve_timeout: 5m
route:
group_by: ['alertname']
group_wait: 30s
group_interval: 5m
repeat_interval: 5h
receiver: 'wechat'
inhibit_rules:
- source_match:
severity: 'critical'
target_match:
severity: 'warning'
equal: ['alertname']
receivers:
- name: 'wechat'
wechat_configs:
- corp_id: ''
to_party: '1'
agent_id: '1000002'
api_secret: ''
分组,路路由](https://image.slidesharecdn.com/prometheus101-180322073533/85/Prometheus-101-25-320.jpg)
![Alertmanager 配置:
global:
resolve_timeout: 5m
route:
group_by: ['alertname']
group_wait: 30s
group_interval: 5m
repeat_interval: 5h
receiver: 'wechat'
inhibit_rules:
- source_match:
severity: 'critical'
target_match:
severity: 'warning'
equal: ['alertname']
receivers:
- name: 'wechat'
wechat_configs:
- corp_id: ''
to_party: '1'
agent_id: '1000002'
api_secret: ''
降噪](https://image.slidesharecdn.com/prometheus101-180322073533/85/Prometheus-101-26-320.jpg)
![Alertmanager 配置:
global:
resolve_timeout: 5m
route:
group_by: ['alertname']
group_wait: 30s
group_interval: 5m
repeat_interval: 5h
receiver: 'wechat'
inhibit_rules:
- source_match:
severity: 'critical'
target_match:
severity: 'warning'
equal: ['alertname']
receivers:
- name: 'wechat'
wechat_configs:
- corp_id: ''
to_party: '1'
agent_id: '1000002'
api_secret: ''
通知渠道](https://image.slidesharecdn.com/prometheus101-180322073533/85/Prometheus-101-27-320.jpg)