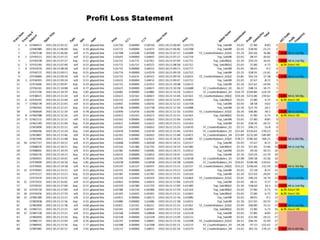
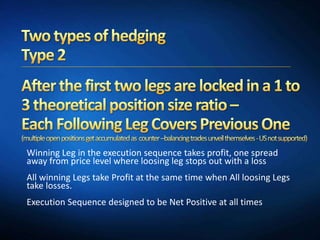
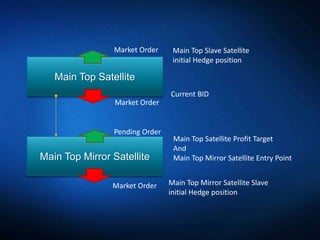
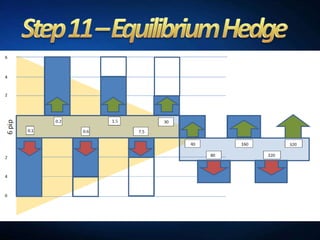
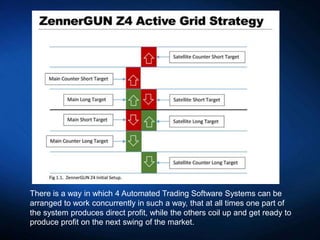
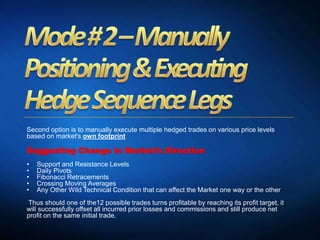
- The document discusses a market neutral trading strategy that aims to profit from market moves in both directions.
- It involves hedging positions by opening multiple opposing positions in a sequence to offset losses and collect fixed profits regardless of market direction.
- If just one position in the sequence is profitable, it can cover losses from previous positions and still yield the initial desired profit.
Amit Gulecha Presentation at Traders Carnival 2018Stock Markets
The document discusses various topics related to trading, including:
1) Keys to successful trading and making easy money through "sure shot" ways and strategies.
2) The importance of skills, dedication, perseverance, patience, mental strength, and family support for survival in trading.
3) The need to develop skills through practice and by following patterns over and over through real trades with small quantities.
4) How ignoring noise and focusing only on price action and trends are important for success in trading.
This document outlines a system for timing the stock market using moving averages. It describes three components: price, short-term trend, and long-term trend, each represented by an exponential moving average (EMA). It provides examples and illustrations of how to set the EMA parameters and interpret the signals generated from the relationship between the three averages. Specifically, it indicates that upward trends are confirmed when the short-term EMA crosses above the long-term EMA, and downward trends are confirmed when the short-term EMA crosses below the long-term EMA. The system aims to identify trend changes and continuations by analyzing crossovers and situations where the short-term trend is already aligned with the long-term trend.
This eBook by Jim Wyckoff provides traders with visual clues to help spot trends and reversals on charts. It discusses 10 chart patterns including:
1. The venerable trend line - Drawing trend lines along price highs and lows to identify trends. Breaking trend lines signals potential trend changes.
2. Support/resistance - Looking at past price history to identify common support and resistance levels, including zones, major tops/bottoms, and gaps. How the market reacts at these levels is important.
3. Retracements - Looking at "retracements" or counter-trend price moves within an existing trend to identify potential support or resistance areas where a correction may end and
Day trading techniques include scalping, fading, daily pivots, and momentum trading. Scalping aims to take quick profits by entering and exiting positions as soon as they become profitable. Fading shorts a stock when it moves up quickly, expecting a sell-off. Daily pivots look to benefit from volatility by buying low and selling high, exiting on signs of reversal. Momentum trades ride trends fueled by news or volume until signs of reversal like decreasing volume or bearish candles. Day traders use candlestick charts, level 2 quotes, and newsfeeds to identify entry points supported by patterns, volume spikes, and order book depth.
This document provides an introduction to options trading. It begins by promising to make options clear and simple to understand. It then discusses how options trading has grown enormously in recent decades as more traders have sought ways to hedge risk and generate income. The document outlines some basic options terminology and strategies to get readers started in understanding options. It emphasizes that getting approved for options trading is straightforward and aims to remove fears about the paperwork involved.
Stock market crash - have you got a plan?optionsrules
Recently, one of my students asked what I learned from the 2008 crisis and how I would handle things if a similar situation ever arose again in the future. Let's see then, how we can prepare for a possible collapse.
Volatility refers to how much a stock's price fluctuates over time. There are two types of volatility: historical volatility, which is measured based on past price changes, and implied volatility, which is what the options market expects volatility to be in the future. Implied volatility is important for options traders to understand because it affects how options are priced - high implied volatility means options are overpriced, while low implied volatility means they are underpriced. Events like earnings reports, market declines, and commodity shortages can cause implied volatility to rise, while extended periods of positive market sentiment or sideways trading can cause it to fall. Options traders can check the implied volatility of a stock on their platform by looking at indicators like
Oliver L. Velez has written an introduction to trading for a living called "Trade for LifeTM". The document outlines Velez's background and experience as a trader, as well as information about Velez Capital Management (VCM), the trading firm he founded. It discusses some of VCM's core trading strategies and concepts, including analyzing the bars in a chart and applying VCM's "Market Law #1" regarding limits on bullish or bearish moves. The document is meant to introduce readers to Velez's approach to trading as a profession.
Forex Secrets And The Art of Buying and Selling...KepharsKunda
Current info about Forex is not always the easiest thing to locate. Fortunately, this report includes the latest Forex info available.
Think about what you've read so far. Does it reinforce what you already know about Forex? Or was there something completely new? What about the remaining paragraphs?
Different people view volatility differently, with some enjoying stock market volatility while others are harmed by it. The India VIX is a volatility index that measures implied volatility in the Indian stock market over the next month, indicating whether the market is in a complacent or anxious mood. It is calculated based on Nifty 50 index option prices, with higher readings associated with increased uncertainty and risk. The India VIX can be used to gauge market sentiment and as a basis for hedging instruments against volatility.
The document discusses different approaches to investing, including passive vs active investing, fundamental vs technical analysis, and top-down vs bottom-up strategies. It provides beliefs, methods, advantages and disadvantages for each approach. The key points are that a top-down, technically-focused approach analyzing broad market and sector trends first may provide an edge over focusing solely on individual companies. The "Tortoise strategy" described uses ETFs in a weekly top-down analysis of global markets to identify relatively strong performing regions.
This document provides an agenda and overview for a presentation on disciplined trading. It discusses:
1. Who is providing the presentation - Karim Adatia and his company PPIS.
2. What disciplined trading involves - having a conviction, catalyst, and plan for each trade as well as predefined risk management.
3. An example of an iron condor options strategy using the S&P 500 as an example to benefit from volatility while remaining non-directional in the market.
The presentation emphasizes the importance of being disciplined by predefining risk, cutting losses, and using a systematic plan for trading options.
This document provides an agenda and overview of a presentation on disciplined trading. The presentation is given by Karim Adatia, a full-time stock options trader and financial educator. It discusses what disciplined trading involves, including predefining risk and cutting losses. It then gives an example of an "iron condor" options strategy using an index like the S&P 500, where options are both sold above and below a perceived trading range to reduce directional exposure. The presentation concludes by emphasizing the importance of discipline in trading and provides information on future educational workshops.
This document provides an agenda and overview of a presentation on disciplined trading. The presentation is given by Karim Adatia, a full-time stock options trader and financial educator. It discusses what disciplined trading involves, including predefining risk and cutting losses. It also covers the iron condor options strategy using the S&P 500 as an example. Practice trades are shown and the presenters' long-term track record is referenced. Attendees are encouraged to follow ongoing practice trades and attend future workshops for more in-depth training.
This document provides an agenda and overview for a presentation on disciplined trading. It discusses:
- Who the presenters are and their backgrounds in trading and financial education.
- What disciplined trading involves, including having a conviction, catalyst, and compliance plan for each trade and cutting losses without hesitation.
- An overview of the presentation agenda, which will cover an introduction, what disciplined trading is, and an example of a practice disciplined trade using options.
- Disclaimers that the presentation is for educational purposes only and they are not providing individualized recommendations or advice.
This document provides an agenda and overview for a presentation on disciplined trading. It discusses:
1. Who is providing the presentation - Karim Adatia and his company PPIS.
2. What disciplined trading involves - having a conviction, catalyst, and plan for each trade as well as predefined risk management.
3. An example of an iron condor options strategy using SPX options to generate returns in a range-bound market without directional bias. Historical performance data is provided on a practice account.
The presentation emphasizes the importance of discipline, predefining risk, cutting losses, and using a systematic approach for consistent profits when trading options or other instruments. An upcoming workshop is announced for
This document provides an agenda and overview for a presentation on disciplined trading. It discusses:
- Who the presenters are and their backgrounds in trading and financial education.
- What disciplined trading involves, including having a conviction, catalyst, and complacency for each trade, as well as predefined risk management and cutting losses.
- An overview of the presentation agenda, which will cover who the presenters are, what disciplined trading means, and an example of a practice disciplined trade using options.
- Disclaimers that the presentation is for educational purposes only and no specific recommendations or advice are being provided.
1) Japanese candlestick patterns provide a visual way to analyze financial markets and identify reversals and changes in market sentiment.
2) Key single candlestick patterns include Doji (indecision), Hammer and Hanging Man (bullish and bearish reversals), and Shooting Star (bearish reversal).
3) Two candlestick patterns like Engulfing, Harami, Piercing Line, and Dark Cloud Cover also signal potential trend reversals.
The document discusses various financial instruments and valuation methodologies. It provides background on Nobel prize winners such as Scholes, Merton, and Black who developed the Black-Scholes options pricing model. It then discusses various derivatives like options, forwards, futures, and swaps. It explains how these instruments can be used for hedging, speculation, and gaining exposure to markets. It also discusses how concepts like volatility and yield curves are important for pricing derivatives.
This document provides an agenda and overview for an educational presentation on disciplined trading using equity options. The presentation will be given by Karim Adatia and his company Prosperis Passive Income Strategies. It will cover an introduction to the presenters and their background, a definition of disciplined trading, and a practice example of an iron condor options trade on the S&P 500 index. The presentation aims to educate attendees on making profits through non-directional trading using options while limiting risk through predefined strategies and money management techniques.
This document provides an agenda and overview for a presentation on disciplined trading. It discusses:
1. Who is providing the presentation - individuals from Vancouver Disciplined Trading Hub and Prosperis Passive Income Strategies.
2. What disciplined trading involves - having a conviction, catalyst, and complacency for trades, predefining risk, cutting losses, and using a systematic plan.
3. An example disciplined trade using an iron condor options strategy on the S&P 500 index, which aims to profit from the index staying within a defined trading range over a short time period.
The document provides disclaimer information and outlines the presentation topics of who the presenters are, what disciplined
This document provides an agenda and overview for a presentation on disciplined trading. It discusses:
- Who is hosting the presentation - Vancouver Disciplined Trading Hub and Prosperis Passive Income Strategies.
- What disciplined trading involves, including predefining risk, cutting losses, and using a systematic plan.
- An example of an iron condor options strategy using an index like the S&P 500 to generate returns while remaining non-directional.
- A practice trade is provided for attendees to work through. Past performance tracking iron condor trades on the S&P 500 is also shared.
- The presentation emphasizes the importance of discipline in trading and that options can provide leverage
This document provides an overview of trading stocks and options. It begins with the basics, defining a stock and how companies raise capital by issuing stock shares. It describes how an individual trader can purchase stocks through an online brokerage platform. The document outlines different ways traders can earn money from stock appreciation or dividend income. It also discusses factors that influence stock prices, such as investor behavior and macroeconomic conditions. The goal is to ground readers in fundamental market realities and teach practical trading skills using the thinkorswim platform.
This document is a newsletter from TD Ameritrade called thinkMoney/24. It provides various articles and tips related to trading, including a cover article about how to structure trades based on one's level of confidence in the trade, even when going on gut instinct. It also previews other articles in the issue about using volatility to one's advantage, neutralizing existing trades, and leveraging the charting tools in the thinkorswim platform. The newsletter includes advertisements, disclaimers, and contact information for TD Ameritrade resources.
This document discusses various volume, open interest, and breadth indicators that can be used to analyze financial markets. It provides explanations of common volume indicators like average volume, force index, volume oscillator, on-balance volume, and how they are calculated and interpreted. It also covers open interest, breadth, equivolume charts, Herrick Payoff Index and how these additional metrics can be analyzed along with volume to gain insights into market behavior.
This document describes several option selling strategies that take advantage of the edge that option sellers have over time. It discusses using the central pivot range (CPR) to enter intraday straddles when a candle closes within the CPR. The strategies aim to profit from time decay as options expire worthless if the market remains range-bound. Adjustments are described to re-enter losing positions if the market reverses back into the range. Hedging far OTM options is also suggested to reduce margin requirements. Overall, the strategies presented seek to profit from the likelihood of markets remaining range-bound over time.
SWING TRADING POSITIONAL TRADING for share.pptxkaursuk22
Swing trading involves holding positions for longer periods, such as one week or more. It aims to generate better returns with lower risk compared to day trading. Key concepts in swing trading like breakouts, retracements, and trend continuation work across different markets and timeframes. Swing trading helps develop an understanding of price action that is applicable universally. Setting price alerts and waiting for confirmations before entering reduces stress for working professionals.
The document discusses binary option trading as an alternative or supplement to forex trading. It provides an overview of binary options, including how they are derived from forex and allow traders to predict whether the price of an asset will rise or fall within a fixed time period. Some key advantages of binary options over forex trading mentioned include precisely knowing your maximum potential profit or loss upfront, the ability to realize profits instantly at expiration, and less room for error when entering trades. The document suggests that while binary options offer simpler trading with fixed payouts, forex may allow for greater potential profits if price movements are large and sustained in your favor. Overall, both have merits and traders can consider using binary options to hedge forex positions
Forex is a $5 trillion-per-day market!
That’s an insane amount of money changing hands EVERY day.
And if you know exactly where to look and what to do you can bank fast currency profits…
The document provides an overview of many hidden costs faced by individual, non-institutional forex traders that significantly reduce their chances of profitability. These include spread costs, slippage and requoting that result in extra pip losses, stop hunting where stops are targeted to trigger losses, price shading and suppression to limit opportunities, post-order price shifts against the trader, costs of funding and withdrawing from overseas accounts, and differences in interest rates charged or credited for carry trades. The author estimates that considering all these factors reduces the average trader's chance of success to only 17.5% rather than the 50% expected in a fair market.
This document provides an introduction to trend following strategies for novice traders. It discusses how markets move based on the constant battle between bullish and bearish investors. When one group gains an advantage over the other, it can be difficult for the losing side to reverse the trend. The document advises traders to take an objective, neutral view of the market and look for major trends rather than trying to time every small movement. It emphasizes the importance of identifying clear support and resistance levels on charts in order to get into trades that have the greatest potential to yield large profits.
http://www.options-trading-education.com/24043/straddle-options/
Straddle Options
When an options trader is not sure which way prices will go in a volatile market he or she often uses straddle options. Straddle options both long and short let a trader stake out potentially profitable positions for both rising and falling markets. Which route a trader takes in using straddle options will depend on whether he wants to buy or sell options contracts.
Going Long
A long straddle is buying both a call and a put on the same stock with the same expiration date. In a long straddle options strategy the worst a trader can do is lose the cost of the premiums paid for the call and the put if the stock does not change price. These straddle options have potentially unlimited potential if the stock price changes significantly, up or down.
Long Straddle Calls
If the stock price goes up the trader exercises the call option, sells the stock at the spot price and buys at the strike price. The profit is the price of 100 shares per contract at the spot price minus the strike price, minus the cost of premiums on both put and call options.
Long Straddle Puts
If the stock goes down in price the trader exercises the put option and sells the stock at the strike price and buys at the new, lower market price, the spot price. The profit will be the price of 100 shares per contract at the strike price minus the spot price minus the premium cost of both put and call options.
This strategy is useful in a volatile and unpredictable market. It carries twice the overhead of a call or put trade. But, the trader cuts down on the risk of missing out on an unexpected market move by covering both up and down eventualities. The only time when a trader loses with a long straddle is when the stock price does not change and then he is only out the cost of two options contracts.
Going Short
A short straddle strategy is selling both a put and a call on the same stock with the same options expiration dates. If the stock does not go up or down the options trader gains two premiums, one for the call and one for the put. Straddle options like these can be cash cows for a trader who has done his homework and only sells contracts on stocks that have very little likelihood of going up or down.
Volatile Markets and Big Losses
Whereas a long straddle is ideal for a volatile market a short straddle should only be used in a quiet market. As with all selling of options contracts the losses can be enormous if a stock price changes greatly. Which is why selling options contracts is so commonly limited to traders with very deep pockets.
Volatile Markets and Big Gains
Volatile markets bring us back to the long straddle. This is the ideal strategy for a market that is crazy in its volatility.
The document provides tips for using a trading journal effectively. It explains that optimistic, pessimistic, and realistic traders can all benefit from keeping a journal to track what trading strategies and patterns have worked best for their style. The journal allows traders to identify the most profitable times of day and setups to focus on. Analyzing past trades in a journal is key to developing a set of rules tailored to each individual trader.
The document provides an overview of the basics of currency trading, including key characteristics of successful traders, habits that lead to mastery, and the scale of the forex market. It also summarizes technical analysis techniques like reading candlestick patterns to identify trends and turning points, using major corporations' currency transactions as an example. Key points covered are determining the overall and daily trends, using big players' Fibonacci target levels, and practicing these skills through paper trading to gain experience.
The document provides disclaimers and information about hypothetical and simulated trading performance. It warns that trading futures and options involves substantial risk of loss. It also contains copyright information for the book "Forex 1 Min Profit" and discusses scalping strategies in forex trading. Scalping involves holding positions for very short periods of time, such as 1-5 minutes, to profit from small price movements. Two specific 1-minute scalping systems using Bollinger Bands and pivot points on GBP/JPY and EUR/USD are described.
Have you ever caught yourself dreaming of a trip to Spain in the summer, that brand new set of golf clubs, or even the holiday home down in Cape Town you've always wanted?
Who says they only have to be dream?
Not me.
I want you to have these things…
That’s why today I want to tell you that whatever you're dreaming about, my simple Forex methodology and techniques could help put you on the road to all of this and more!
1) Traders should think in terms of probabilities rather than certainties when making predictions about market movements, as no one can know with absolute certainty how markets will react.
2) Analyzing patterns in market history can provide insights into the probabilities of how markets may react to current conditions.
3) Successful trading systems are those that increase the probabilities in the trader's favor over numerous trades, not those that correctly predict each individual trade. Risk management is crucial for long-term success.
What is the otc market how to trade to make good profitsHuangLG88
The document discusses trading in the OTC (Over-The-Counter) market. It notes that while trading penny stocks in the OTC market can be lucrative, it carries high risks and requires discipline. It provides tips for successful OTC trading, such as having a clear plan, using stop-losses, not being overconfident, and taking profits when available. The document also outlines some common mistakes to avoid when trading OTC stocks.
An animated description of how the currency market works compared to the stock market, and how to use the principle of the "Zero Sum Game" to make money trading forex.
This document provides an agenda and overview for a presentation on disciplined trading. It discusses:
1. Who is providing the presentation - individuals from Vancouver Disciplined Trading Hub and Prosperis Passive Income Strategies.
2. What disciplined trading involves - having a conviction, catalyst, and plan for each trade as well as predefined risk management and cutting losses.
3. A practice disciplined trade using an iron condor options strategy on the S&P 500 as an example to illustrate concepts like being non-directional and managing risk.
The document concludes by providing takeaways on being disciplined, making money without directional bets, the benefits of leverage with options, and opportunities
3. Market is in a Superposition all the time
• The Market is always Long & Short at the same time (Quantum Ambiguity)
• Looking at a current time snapshot of the Market, causes it to be either Long or Short, at
the moment we are evaluating it (Observer's Paradox)
• We can’t determine what state the Market is in, until we take a peek at it, and this is
always after the fact (Schrodinger Cat Experiment)
• We trade in both directions of the Market at the same time, as we know for certain that
change never stops, and sooner or later the Market has to change its way from one
direction to the other
• And if it doesn’t, we aim at profit taking inside the consolidation range in which the
Market has been stuck in sideways
5. Everyone has heard about how easy it is to
trade and make a quick buck in the FX Market
FACT is: Most people who tried have failed!
But regardless of its perceived simplicity…
They say: All you need is to follow the trend –
BUY Low, SELL High and there you have it…
6. Trading FX is a ZERO loss game. Traders are liquidity consumers. For them
to win, means a Liquidity Provider – the Banks have to temporarily loose in
the mean time, while they still make commissions from the transactions.
Most Traders are being outgunned and find themselves fighting an uphill
battle, against the smartest professional traders in the world, who utilize
21st century technology, in contrast with ragtag individual traders, armed
with outdated, useless methodologies, reminiscent of using a 16th century
Musket, which is capable of firing one lead ball at a time, compared to a
laser-gun blasting adversary…
Instead, they should be fighting back with automated multi-shot trading
systems, such as the ZennerGUN Z4…
7. “Always Want What The Market Wants!"
Price Action is ALL you NEED to care about…
This means that, You Always have to GO with the Latest
Directional move of the Market and never Resist it…
Never ask the question “Why didn’t the Market go in my
direction”. There is no answer to a question like this, as no
body know when and where the Market will ever go next!
8. T&F Analysisdonotwork
mostofthetime
Mainstream Technical & Fundamental
Analysis Based Trading is Like:
"A Broken Clock That Shows The Right Time Twice a day”
"Driving a Car With a Gas And a Break Pedals Only, But
No Steering Wheel.“ (How far can you go?)
9. Why did airplane engineers decided to have their
pilots, sitting in a cockpit located at the front of the
craft instead of at the rear end?
Following Technical Analysis for trading is like flying an airplane with its
cockpit located at the rear end of the craft – capable of observing what
has happened only in the past, with no idea of what is coming up…
It is doomed to CRASH at the first hill side, when there is no one to
observe what is happening NOW and to steer it AWAY from it…
What ZennerTrading does best is, prevent you from crashing…
10. You may Not know which Way the Market Winds
are Going to Blow in Today,
BUTIf you Adjust Your Sails in Accordance with its direction,
You Can Still Reach Your Destination
Even When Having To Sail Against the Wind...
11. Uneducated Traders are doomed to lose by design
The Markets are rigged in the broker’s favor
Undertaking unsubstantiated High Risk, expect to win on each trade in one direction only.
Use disproportionally high lot sizes compared to their account size
Don’t leave enough available funds to withstand Draw Downs.
Use Stops as means to prevent trading losses Leading to Negative Equity Curves over time.
Misguided wishful theories behind setting Profit target, Stop out levels and Risk Reward ratios.
Delusional, overconfident and stubborn reaction to adverse market movements, leading to
loses.
Brokers make their profit on commissions earned by volumes sold and bought, regardless
of price level, they don’t care if a pair will go up or down.
Brokers push prices up and down in search for more buying and selling by market
participants.
Markets represent a Random/Unpredictable price distribution, seeking equilibrium
between buyers and sellers.
Market participants Agree on Price, disagree on Direction.
Only Brokers can gauge the real volume ratio between existing buying and selling in the
market.
The Volume you see in your Chart is Tick Volume, which is indicative of nothing.
12. The Future is never exactly the same as the past
The number of market participants and their ideas/views of the
market are dynamic/changing all the time, and thus unknown
at any specific point of time
There are no means for accurate measurement of the real
market sentiment/supply and demand at all times
13. A fact is a statement that can be proven true or false.
An opinion is an expression of a person’s feelings that
cannot be proven.
Opinions can be based on facts or emotions and
sometimes they are meant to deliberately mislead others.
Therefore, it is important to be aware of the source,
purpose, and choice of language in communicating a
certain information…
14. The Trend seams to be an illusion, an opinion held by a
market participant not based in fact. It is something that
becomes a reality/visible only in hindsight or after the fact,
after it has developed, at which point it is usually too late to
jump in and follow through with a trade in the same
direction…
While this same trend was developing, it never looked like,
what it eventually turned out to be…
The Market can look any way it wants and it always looks
pretty in all directions it decides to go, with or without our
proper or improper opinion of it…
15. Your brain is your worst enemy when it comes to trading decisions…
It is Scientifically proven that on a Physiological level, Your brain will choose to
cheat into making a decision rather than admit it doesn’t know something - which
way the market is going to go… It is frequently unreasonably opinionated based
on accidental, anecdotal, random facts about pre-existing Market conditions…
There is no secure rational way of determining market direction at any time…
Any Trading decision you make has a 50/50 chance and could not be 100%
substantiated by existing Market facts…
We can ONLY make Educated Assumptions of possible Market Behavior, and
adjust our trading mindset accordingly, both on the long and short sides as well…
16. Using a Market Neutral trading strategy, which assumes all
possible ways a Market can move in and profit from its
versatility…
You have to be prepared that not each trade will turn out a
winner
Nevertheless, one trade, out of a dozen trades in any
direction, has a better chance of taking profit than executing
just one trade in one direction…
17. Luckily the markets can EITHER obtain direction
out of a BRACKET/RANGE
As they BREAK OUT either UP or DOWN
OR
They do not have direction and they move
SIDEWAYS in a consolidation pattern
18. You BUY the TOP of the RANGE
OR
You SELL the BOTTOM of the RANGE
This is called Consolidation Channel…
RANGE
19. You BUY the BOTTOM of the RANGE
OR
You SELL the TOP of the RANGE
This is called Consolidation Channel…
RANGE
20. We see a perfect formation of a Consolidation Pattern/Bracket
Market, after a significant directional move to the upside…
Bracket Market is being Hedged by 2 autonomous EAs at both the
Top & Bottom of the Linear Regression Channel, aimed at initial
continued action within the range, with counter-balancers pointing
in the direction of a possible breakout to the Long and Short sides…
21.
22. A Trading Strategy equally biased to taking profit on both sides of the Market,
regardless of Technical and Fundamental indicators.
The only thing that matters is PRICE ACTION.
Market Neutrality is achieved by multiple hedging of an existing positions,
instead of accumulating multiple stop losses…
A Fixed Profit is taken regardless of the direction of the winning trade
Each subsequent leg in the hedging sequence offsets current losses and
commissions.
If only one leg (out of a dozen in a hedging sequence) is successful, it would
be powerful enough to pay off all previous losses and head out with the same
incremental profit size, as the very first trade would have profited, should it
had reached its profit target in the first place.
23. Trading Commission can be:
Paid Separate on the side
$5 per 1 Standard Lot (100,000 units of base currency) Round Trip
OR
Baked into the spread (Preferred)
1 pip over existing spread
24. 1. New Leg in the execution sequence starts where previous leg ends in
a loss…
2. Winning Leg in the execution sequence takes profit one spread away
from price level where loosing leg stops out
• All winning Legs take Profit at the same time when All loosing Legs take
losses.
• Execution Sequence designed to be Net Positive at all times, regardless
of current losses
25. RISK RANGE
Main Position
1 Lot
Hedge Position
2 Lots
Long Profit Target
Short Profit Target
10
10
10
Long Stop Loss
Short Stop Loss
26. RISK RANGE
Main Position
1 Lot
Hedge Position
3 Lots
Long Profit
Target
Short Profit Target &
Long Stop Loss
10
10
10
20
20
36. Transaction #48 Produces 2 pip NET profit on top
of the required 6 pips to cover expenses and take
fixed profit, thus the total return for this series of
executions comes to $76.9 instead of the
targeted $6.
37.
38. Winning Leg in the execution sequence takes profit, one spread
away from price level where loosing leg stops out with a loss
All winning Legs take Profit at the same time when All loosing Legs
take losses.
Execution Sequence designed to be Net Positive at all times
41. INPUT PARAMETERS OUTPUT 1.00%
Try#
Desired
Net
Profit
Required
Profit
ActualNetLoss
ActualLoss+
Com
m
ission
ActualProfit
SLPips(spread
included)
TP
Pips
Distance
b/w
positionsCom
m
ission
Base
Price
Action
ActualSL
ActualTP
ActualNotional
Com
m
ission
Cost
Required
Lots
Position
Type
Required
Funds
M
argin
0 $1,001.00 $1,001.00 $1,356.60 $1,356.60 $997.50 102.00 75.00 0 1.60469 1.60469 1.61489 1.59719 213,423.77$ $0.00 1.3300 Short $750.00 0 -$2,134.24
1 $1,001.00 $2,357.60 $3,202.80 $3,202.80 $2,355.00 102.00 75.00 25 1.61219 1.60719 1.59699 1.61469 506,227.66$ $0.00 3.1400 Long $750.00 0 $5,046.58
2 $0.00 $3,202.80 $4,355.40 $4,355.40 $3,202.50 102.00 75.00 25 1.60469 1.60469 1.61489 1.59719 685,202.63$ $0.00 4.2700 Short $750.00 0 -$6,852.03
3 $0.00 $4,355.40 $5,926.20 $5,926.20 $4,357.50 102.00 75.00 25 1.61219 1.60719 1.59699 1.61469 936,682.39$ $0.00 5.8100 Long $750.00 0 $9,337.77
4 $0.00 $5,926.20 $8,058.00 $8,058.00 $5,925.00 102.00 75.00 25 1.60469 1.60469 1.61489 1.59719 1,267,705.10$ $0.00 7.9000 Short $750.00 0 -$12,677.05
5 $0.00 $8,058.00 $10,954.80 $10,954.80 $8,055.00 102.00 75.00 25 1.61219 1.60719 1.59699 1.61469 1,731,492.06$ $0.00 10.7400 Long $750.00 0 $17,261.22
6 $0.00 $10,954.80 $14,902.20 $14,902.20 $10,957.50 102.00 75.00 25 1.60469 1.60469 1.61489 1.59719 2,344,452.09$ $0.00 14.6100 Short $750.00 0 -$23,444.52
7 $0.00 $14,902.20 $20,267.40 $20,267.40 $14,902.50 102.00 75.00 25 1.61219 1.60719 1.59699 1.61469 3,203,421.53$ $0.00 19.8700 Long $750.00 0 $31,934.87
8 $0.00 $20,267.40 $27,560.40 $27,560.40 $20,265.00 102.00 75.00 25 1.60469 1.60469 1.61489 1.59719 4,335,872.38$ $0.00 27.0200 Short $750.00 0 -$43,358.72
9 $0.00 $27,560.40 $37,485.00 $37,485.00 $27,562.50 102.00 75.00 25 1.61219 1.60719 1.59699 1.61469 5,924,798.25$ $0.00 36.7500 Long $750.00 0 $59,064.23
10 $0.00 $37,485.00 $50,979.60 $50,979.60 $37,485.00 102.00 75.00 25 1.60469 1.60469 1.61489 1.59719 8,020,240.62$ $0.00 49.9800 Short $750.00 0 -$80,202.41
11 $0.00 $50,979.60 $69,329.40 $69,329.40 $50,977.50 102.00 75.00 25 1.61219 1.60719 1.59699 1.61469 10,958,055.43$ $0.00 67.9700 Long $750.00 0 $109,240.70
• Long position’s margins get offset by Short’s position margins, thus providing
extra equity for new trades to be accumulated…
• If directional move continues through the initial Profit Target Level, all
winning legs start to accumulate extra net pips by individual dynamic
position trailing, thus significantly increasing Actual profit potential, as those
profits stack up on top of the already secured, predefined, net fixed, “baked
in” into the hedging sequence profits…
• Keeping Multiple Opened position in opposite directions not supported by
US Brokers (FIFO requirements)
42. It is a Custom Tailored Multi-Purpose Self
Hedging EA for MT4
Capable of performing All the
functionality exposed so far in this
presentation…
43.
44.
45. The first one is called Top Satellite and its initial trade direction is always Short.
The second one is called Bottom Satellite and its initial trade direction is always
Long
Usually they start simultaneously as Market order at the current BID and ASK in
the same lot sizes or they can be launched as Pending orders at specific Price
levels.
46. Main Bottom Satellite
Current ASK Market Order
Main Top Satellite
Current BIDMarket Order
SPREAD
Hedged Long
Hedged Short
47. Each one of the Main EAs contains in itself 11 autonomous Slave counter balancing
EAs, providing the multiple legs in the Hedging execution sequence.
A single chart is allocated for each Master or Slave EAs.
48. Main Top Satellite
Main Top Slave 2
Satellite
Main Top Slave 3
Satellite
Main Top Slave 5
Satellite
Main Top Slave 6
Satellite
Main Top Slave 8
Satellite
Main Top Slave 9
Satellite
Main Top Slave 4
Satellite
Main Top Slave 7
Satellite
Main Top Slave Final
Satellite
Main Top Slave
Equilibrium Satellite
Main Top Slave 10
Satellite
49. Each Master Main EA has a second mirror image EA, called Top Satellite 2 and
Bottom Satellite 2.
They are positioned as Pending orders, a certain distance away from their
respective Main EA entry points.
Their direction is against its Main EAs direction.
50. Main Bottom Satellite
Main Bottom Mirror Satellite
Current ASK
Market Order
Main Bottom Satellite Profit Target
And
Main Bottom Mirror Satellite Entry Point
Pending Order
Market Order
Market Order Main Bottom Mirror Slave Satellite
initial Hedge position
Main Bottom Satellite Slave
initial Hedge position
51. Main Top Mirror Satellite
Main Top Satellite
Current BID
Market Order
Main Top Satellite Profit Target
And
Main Top Mirror Satellite Entry Point
Pending Order
Market Order
Market Order Main Top Slave Satellite
initial Hedge position
Main Top Mirror Satellite Slave
initial Hedge position
52. Each one of the Mirror Main EAs contains in itself 11 autonomous Slave counter
balancing EAs, providing the multiple legs in the Hedging execution sequence.
A single chart is allocated for each Master or Slave EAs.
53. Main Top Mirror
Satellite
Main Top Mirror Slave
2 Satellite
Main Top Mirror Slave
3 Satellite
Main Top Mirror Slave
5 Satellite
Main Top Mirror Slave
6 Satellite
Main Top Mirror Slave
8 Satellite
Main Top Mirror Slave
9 Satellite
Main Top Mirror Slave
4 Satellite
Main Top Mirror Slave
7 Satellite
Main Top Mirror Slave
Final Satellite
Main Top Mirror Slave
Equilibrium Satellite
Main Top Mirror Slave
10 Satellite
54.
55.
56.
57.
58.
59.
60.
61.
62.
63.
64.
65. SPREAD
Main Top Mirror Satellite
Main Top Satellite
Current Market Order
Pending Order
Hedged Market Order
Hedged Market Order
Main Bottom Satellite
Main Bottom Mirror Satellite
Current Market Order
Pending Order
Hedged Market Order
Hedged Market Order
ASK
BID
77. The Trading System is a novel fully automated Meta-Trader 4
based Expert Adviser, which can be defined as:
• Autonomous
• Adaptive
• Self Priming
• Bi-Directional
• Asymmetrical
• Double-Crossed
• Price Action Fronting
• Trending & Bracket Market Enabled
• Widened Spread Protected
• Entry & Exit Slippage Compensated
• Custom Dynamic Ratchet Trailing Enabled
• Ultra High Frequency Scalping Enabled
78. The Trading System is a novel fully automated Meta-Trader 4
based Expert Adviser, which can be defined as:
• Autonomous
• Adaptive
• Self Priming
• Bi-Directional
• Asymmetrical
• Double-Crossed
• Price Action Fronting
• Trending & Bracket Market Enabled
• Widened Spread Protected
• Entry & Exit Slippage Compensated
• Custom Dynamic Ratchet Trailing Enabled
• Ultra High Frequency Scalping Enabled
79. Say Good Bye to All
• Forecasts
• Presages
• Predictions
• Gut-feelings
• Perceptions
• Intuitions
• Expectations
80. The strategy boils down to its advanced,
high speed, asynchronously hedged order executions
on both sides of the market, in the same instrument,
so that it keeps the trader in the trade up to 12 times,
rather than having him taken out on a stop loss.
To achieve this, the system opens new consecutive
orders in the opposite direction of its preceding trade,
with a lot size calculated in such a way,
so that when one out of the dozen trades reaches its
profit target, the actual profit amount gets stripped from
all prior losses and commissions, thus
delivering a desired, user specific net positive profit.
81.
82.
83. Each time a trader executes an order, his odds of winning to losing
are 50/50.
The ZennerGUN Strategy can be viewed as a Trading Chance
Amplifier, as it takes an initial trade with a 50/50 odds of winning to
losing and in the course of 10 Counter Balancing order executions,
it arrives at 91/9 chance of winning to losing, while retaining the
original desired profit target size.
A final equal and opposite trade is placed after the end of the series
of multiple aggregated consecutive orders, capping it into a
neutralized balanced hedge, where there is no further gain or loss
accumulation, and trading could be continued manually by the
account manager…
84. Lot sizes above represent “theoretical” numbers, when Risk/Reward ratios are 1 to 1
and an absolute “Double Up” is required to counter-balance. In reality the
Risk/Reword ratio can be set to 1 to 2, and 1 to 3, which drastically reduces the lot
sizes required to Counter-balance loosing trades…
85. Hedging Sequence: Targeting $6 profit on each subsequent leg
1. 0.1 Lots Short for 6 pip Profit Target 6 pip Stop Loss
2. 0.2 Lots Long for 6 pip Profit Target 6 pip Stop Loss
3. 0.6 Lots Short for 4 pip Profit Target 6 pip Stop Loss
4. 1.5 Lots Long for 4 pip Profit Target 6 pip Stop Loss
5. 7.5 Lots Short for 2 pip Profit Target 6 pip Stop Loss
6. 30 Lots Long for 2 pip Profit Target 6 pip Stop Loss
7. 40 Lots Short for 6 pip Profit Target 6 pip Stop Loss
8. 160 Lots Long for 6 pip Profit Target 6 pip Stop Loss
9. 320 Lots Short for 6 pip Profit Target 6 pip Stop Loss
10. 320 Lots Long Equilibrium Hedge
96. Leg number 6 and 7 are pointing in the same directions, as
leg #7 is attempting to capture profit in the channel that has
been generated by the previous 6 trades, 3 on the long
side and 3 on the short side.
This builds the foundation for the assumption, that the
market is moving sideways.
In such conditions, the tops are being shorted and the
bottoms are being bought.
115. By removing the TP target of the Final EA (with no SL in place), and entering a
Neutralizing, equal and opposite position with no TP and SL as well.
In this way the existing loss floats in the market freely, without the need to RISK
and immediately take a loss at the current time.
You wait and buy time for the Market to pick direction and move out of its
current location, before proceeding further with untying the Equilibrium hedge
in one direction or the other, according to Market footprint…
116. Encapsulated Loss -$1000
10
10
Loss Remains the Same at
this Price Level
10
10
Loss Remains the Same at
this Price Level
10
10
+25 pips
-50 pips
No TPs & No SLs
117. Equilibrium Hedge RANGE
(1) Pays off Short
(2) Pays off previous losses & takes Profit
Cut off the Short Leg of the Equilibrium Hedge after the market has
picked direction on the Long side, and you expect the movement to
continue...
Let it RUN for twice the distance between the hedged positions
118. Equilibrium Hedge RANGE
(1) Pays off Long
(2) Pays off previous losses & takes Profit
Cut off the Long Leg of the Equilibrium Hedge after the market has picked
direction on the Short side, and you expect the movement to continue...
Let it RUN for at least twice the distance between the hedged positions
119.
120.
121.
122.
123.
124.
125. This video demonstrates how the ZennerGUN Expert Adviser has entered into an original short
position, (visually represented by red arrow on the chart) with a preset target 15 pips away on the
down side (visually represented by a yellow line at the bottom)
After a multiple up and down jitters, the market rips through its stop loss/reversal level 15 pips
away in the opposite direction (up side), where a new counter-balancing long order gets
calculated and executed on the fly (visually represented by a green arrow) with a lot size adjusted
to compensate for prior losses and commissions including slippage.
This time the long trade reaches its profit target by design,15 pips away on the up side, relative to
its initial entry point (visually represented by a green arrow) - takes profit at the trailing trigger
price level (visually represented by a yellow line at the top) and automatically re-runs itself from
the beginning, by opening a new short position…
If the directional move had continued upwards, a dynamic position trailing would have occurred
from that price level upwards, increasing expectations for actual profits…
https://youtu.be/ONfeHKq2dOY
The Storyof What it represents?
134. Step 4 – Enter into a new Initial Short Trade (RED arrow)
Profit Target 15 pips below
(Yellow Line below RED arrow)
New Counter-balancing Long Hedge position (GREEN arrow)
established 15 pips above current entry (RED arrow)
137. There is a way in which 4 Automated Trading Software Systems can be
arranged to work concurrently in such a way, that at all times one part of
the system produces direct profit, while the others coil up and get ready to
produce profit on the next swing of the market.
138. The ZennerGUN Z4 consists of 4 (four) antagonistically situated Master EAs, each one of them
containing up to 12 Slave EA, interwoven in such a way, so that regardless of what direction the
markets decide to go, it always crosses through the grid space of one of the 2 (two) Main EAs,
which will take an immediate profit at that time, while its counter image EA will temporarily lose,
as it coils up to make a profit in one of the following steps/moves in the Market.
The Main Long & Short TARGET Eas get executed as Market orders at the London’s Session
Open.
At the same time, their corresponding Satellite Image EAs get activated as Pending Orders at
one target distance away in the respective opposite directions.
In this way a GRID is being laid in front of the Market’s path, triggering one of the corresponding
EA, once the Market enters its territory.
From the figure above we can see how the 2 Main and 2 Satellite EAs cover 8 static grid cells,
which trip the price action, should the market cross its territory.
Usually the Main Long and Short EAs get executed at the same time on the current BID and
ASK, TARGETING 30 pip profit both up and down.
In contrast the Satellite Long and Short EAs get executed as Pending Orders 30 pips away
from the Main EAs entry or at the same level where the Main EAs Profit Targets are situated.
So that when one of the Main EAs exits with profit, the Satellite EAs become active market
orders and begin to work in their respective opposite directions.
139.
140. This is one of the most attractive modes of operations, requiring the
utilization of least financial resources to achieve it goals.
The strategy can be used as an insurance policy against potential risk
from stop outs, for manually trades initiated by traders on technical signals
that have gone bad.
Viewed as an Exit Strategy, it increases the chance for exiting a initial
loosing trade at
• Break Even
• At some fractional desired profit target
141. Second option is to manually execute multiple hedged trades on various price levels
based on market's own footprint
Suggesting Change in Market’s Direction
• Support and Resistance Levels
• Daily Pivots
• Fibonacci Retracements
• Crossing Moving Averages
• Any Other Wild Technical Condition that can affect the Market one way or the other
Thus should one of the12 possible trades turns profitable by reaching its profit target, it
will successfully offset all incurred prior losses and commissions and still produce net
profit on the same initial trade.
142. This method is totally Hands Off
Trader sets the system in auto repeat mode and let it hedge itself in a specific Hedging
Pattern Sequence or Range, until it takes profit on one side or the other, out of 12
possible tries…
The User can preset the Time at which the system will launch its first trade as well as set
the time for exiting its last trade, thus preventing itself from trading during the dead times
after the close of New York or before the London Open for example…
The EA can be set to launch ONLY if a certain price level is being reached regardless of
timing…
143. EA can use both Market and Pending Orders pegged to
specific predefined price levels
When using Pending Order
• Take Profit Target Levels are Visible
• Stop Out Level are Visible (for One-Trade-One-Direction-Only setups with US Brokers)
When using Market Order
• Take Profit Target Levels are Stealthy – InVisible to the Broker
• Stop Out Level are Stealthy – InVisible to the Broker
Thus Broker can’t chase TPs & SL as he is unaware where those actual price
levels are set to be…
144. EA scans price action 10 times per second, to identify
appropriate levels for exit at a specific profit level or at a
stop loss level.
Exits from an existing position can be executed in two ways
• By a corresponding Close Order in the same size to an existing Market
Order
• As part of the Take Profit or Stop Loss accompanying a Pending Order
The Slippage could be a major factor when profit taking is concerned. The EA
has a built in mechanism to compensate for variable slippage when
calculating counter-balancing hedged positions…
145. EA can run in Auto-Repeat ON/OFF:
• Single Run Take profit and Exit
• Run Take Profit and Restart from Last Exit
System can be set up to perform Hedged Execution Sequences
comprised from a customizable number of legs, distances between
offsetting positions as well as position lot sizes and directions
146. EA Supports the following types of currencies:
• US denominated
• Non US denominated
• Crosses like GBP/JPY...
147. EA is sensible to widened spreads
Extended spread protection freezes EA activity in the event that abnormal
spreads take place (with variable spread brokers). A normal spread size base line
has to be specified per currency pair. The moment it is exceeded, no new
positions get opened until spread normalizes. You can specify if you want to
apply this to exiting a trade on a widened spread. By default I allow exiting a
position on a widened spread but hold off from opening the following leg in an
execution sequence, until spread normalizes with its predefined range.
There a brokers who offer FIXED spreads, which could be more desirable
if the broker is STP/ECN not a Market Maker, allows EAs and doesn’t Re-
quote on order execution requests...
148. EA Protects profits by placing Stop Loss levels in front
of the entry level
Dynamic trailing stops protect initial profit targets once the price level is
achieved, so that if directional move continues, trailing gets initiated
with variable trailing tails across forthcoming sections in front of the
track of the trade, as it progresses. The End game is always
desired/predefined profit, stacked on top of extra trailing net profit!
149. Section 3
PROFIT RANGE
Section 1
Trailing
Trigger
Initial Take
Profit
Entry Point
Section 2
36
12 3
9
24
12
8
16
3
9
48
84
Profit
Protection
150. Price Action Script
https://drive.google.com/file/d/0BziL_XM2TaNWTDdrVW03RkViMlk/edit
Active Chart Looks and Feel
https://docs.google.com/file/d/0BziL_XM2TaNWVHBBcTBWSVpqZWc/edit
The Big Picture - Before and After
https://docs.google.com/file/d/0BziL_XM2TaNWX0daM0hjeVNZVHc/edit
Anatomy of a ZennerGUN
https://docs.google.com/file/d/0BziL_XM2TaNWclJvQTZtbThHZHc/edit
Game Plan
https://docs.google.com/file/d/0BziL_XM2TaNWcUJpaTVCbHIxV28/edit
Unemployment Claims - Before and After
https://docs.google.com/file/d/0BziL_XM2TaNWbmhQR3VyTzZQOU0/edit
Real Trading Account Performance - $20K in 1 month
https://docs.google.com/file/d/0BziL_XM2TaNWU3Q2cnZDZG95Z2M