This dissertation proposes a model-based testing approach for real-time embedded systems in the automotive domain. It develops a test framework called MiLEST that allows specifying tests at the model level based on system models. The approach identifies signal features that can be used to abstractly describe test inputs. It addresses testing of both discrete and continuous signals to cover the hybrid behavior of embedded systems. Case studies on adaptive cruise control systems demonstrate the approach and show quality improvements over traditional testing methods.


![iii
Abstract
Software aspects of embedded systems are expected to have the greatest impact on industry,
market and everyday life in the near future. This motivates the investigation of this field. Fur-
thermore, the creation of consistent, reusable, and well-documented models becomes an impor-
tant stage in the development of embedded systems. Design decisions that used to be made at
the code level are increasingly made at a higher level of abstraction. The relevance of models
and the efficiency of model-based development have been demonstrated for software engineer-
ing. A comparable approach is applicable to quality-assurance activities including testing. The
concept of model-based testing is emerging in its application for embedded systems.
Nowadays, 44% of embedded system designs meet only 20% of functionality and performance
expectations [Enc03, Hel+05]. This is partially attributed to the lack of an appropriate test ap-
proach for functional validation and verification. Hence, the problem addressed by this innova-
tion relates to quality-assurance processes at model level, when neither code nor hardware ex-
ists. A systematic, structured, and abstract test specification is in the primary focus of the inno-
vation. In addition, automation of the test process is targeted as it can considerably cut the ef-
forts and cost of development.
The main contribution of this thesis applies to the software built into embedded systems. In par-
ticular, it refers to the software models from which systems are built. An approach to functional
black-box testing based on the system models by providing a test model is developed. It is con-
trasted with the currently applied test methods that form dedicated solutions, usually specialized
in a concrete testing context. The test framework proposed herewith, is realized in the MAT-
LAB®/Simulink®/Stateflow® [MathML, MathSL, MathSF] environment and is called Model-
in-the-Loop for Embedded System Test (MiLEST).
The developed signal-feature – oriented paradigm allows the abstract description of signals
and their properties. It addresses the problem of missing reference signal flows as well as the
issue of systematic test data selection. Numerous signal features are identified. Furthermore,
predefined test patterns help build hierarchical test specifications, which enables a construc-
tion of the test specification along modular divide-and-conquer principles. The processing of
both discrete and continuous signals is possible, so that the hybrid behavior of embedded sys-
tems can be addressed.
The testing with MiLEST starts in the requirements phase and goes down to the test execution
level. The essential steps in this test process are automated, such as the test data generation and
test evaluation to name the most important.
Three case studies based on adaptive cruise control are presented. These examples correspond
to component, component-in-the-loop, and integration level tests. Moreover, the quality of the
test specification process, the test model, and the resulting test cases is investigated in depth.
The resulting test quality metrics are applied during the test design and test execution phases so
as to assess whether and how the proposed method is more effective than established tech-
niques. A quality gain of at least 20% has been estimated.](https://image.slidesharecdn.com/zanderdiss-130217192436-phpapp02/85/Zander-diss-5-320.jpg)
![iv
Zusammenfassung
Die Forschung im Bereich Software-Aspekte von eingebetteten Systemen wird in naher Zu-
kunft entscheidenden Einfluss auf Industrie-, Markt- und Alltagsleben haben. Das regt die Un-
tersuchung dieses Anwendungsgebietes an. Weiterhin wird die Erstellung eines konsistenten,
wiederverwendbaren und gut dokumentierten Modells die wichtigste Aufgabe bei der Entwick-
lung von eingebetteten Systemen. Designentscheidungen, die früher auf der Kodeebene be-
schlossen wurden, werden heute zunehmend auf einer höheren Abstraktionsebene getroffen.
Außerdem, wenn die Debatte über die Relevanz von Modellen und modellbasierter Entwick-
lung für die Softwaretechnik zutreffend ist, dann besitzt sie auch Gültigkeit für Aktivitäten der
Qualitätssicherung einschließlich Testen. Hiermit wird das Konzept des modellbasierten Tes-
tens entwickelt.
Heutzutage erfüllen 44% der eingebetteten Systemdesigns 20% der Erwartungen an Funktiona-
lität und Leistung [Enc03, Hel+05]. Das liegt zum Teil daran, dass ein passender Testansatz für
funktionale Validierung und Verifikation fehlt. Folglich bezieht sich das in dieser Dissertation
besprochene Problem auf den Qualitätssicherungsprozess auf Modellebene, wenn weder Kode
noch Hardware existiert. Eine systematische, strukturierte, wiederholbare und möglichst abs-
trakte Testspezifikation ist der Hauptschwerpunkt dieser Arbeit. Ein weiteres Ziel ist eine Au-
tomatisierung des Testprozesses, da diese den Arbeitsaufwand und die Kosten der Entwicklung
beträchtlich senken kann.
Der Hauptbeitrag dieser Dissertation gilt für Software der eingebetteten Systemen und bezieht
sich die eigentliche Breite dieser Arbeit auf Modelle des Softwares, auf deren Grundlage folg-
lich die Systeme gebaut werden. Ein Ansatz für funktionale Black-Box Tests, die auf den Mo-
dellen basieren und die selbst auch ein Testmodell darstellen, wurde entwickelt. Dem stehen
derzeit verwendete Testmethoden gegenüber, die zweckbestimmte Lösungen für in der Regel
spezialisierte Testzusammenhänge darstellen. Die hier vorgeschlagene Testframework wurde in
einer MATLAB®/Simulink®/Stateflow®-Umgebung realisiert und trägt den Namen Model-in-
the-Loop for Embedded System Test (MiLEST).
Das Signalsmerkmals-orientierte Paradigma erlaubt eine abstrakte Beschreibung eines Signals
und spricht sowohl die Probleme des fehlenden Verlaufes von Referenzsignalen als auch der
systematischen Testdatenauswahl an. Zahlreiche Signalsmerkmale werden identifiziert und
klassifiziert, vordefinierte Testmuster helfen, hierarchische Testspezifikationen zu bilden. Da-
durch wird die Verarbeitung von diskreten und kontinuierlichen Signalen möglich, so dass das
hybride Verhalten des Systems adressiert wird.
Das Testen mittels MiLEST beginnt in der Anforderungsphase und geht hinunter auf das Test-
durchführungsniveau. Einige Prozessschritte sind automatisiert, wobei die Testdatengenerie-
rung und die Testauswertung zu den wichtigsten zählen.
Drei Fallstudien, die auf der Funktionalität des Tempomats basieren, werden vorgestellt. Diese
Beispiele entsprechen den Komponententests, Component-in-the-Loop-Tests und Integrations-
niveautests. Außerdem, werden die Qualität des Testspezifikationsprozesses, des Testmodells
und der resultierenden Testfälle genauer untersucht. Die Testqualitätsmetriken werden dann
während der Testkonstruktion und der Testdurchführung angewendet, um einzuschätzen, ob
und in welchem Maße sich die vorgeschlagene Methode von bekannten Techniken unterschei-
det. Qualitätsgewinn von mindestens 20% wird abgeschätzt.](https://image.slidesharecdn.com/zanderdiss-130217192436-phpapp02/85/Zander-diss-6-320.jpg)
![v
Declaration
The work presented in this thesis is original work undertaken between September 2005 and
August 2008 at the Fraunhofer Institute for Open Communication Systems, Competence Center
– Modeling and Testing for System and Service Solutions, the Technical University of Berlin,
Faculty of Electrical Engineering and Computer Science, and the University of California, San
Diego, Department of Computer Science and Engineering. It has been financed by several
research grants and the doctoral fellowship awarded to the author by Studienstiftung des
deutschen Volkes 1. Portions of this work have been already presented elsewhere due to a num-
ber of research travel scholarships received from the IFIP, IEEE, Siemens, and Métodos y Tec-
nología. They resulted in the following publications:
− ZANDER-NOWICKA, J., SCHIEFERDECKER, I., MARRERO PÉREZ, A.: Automotive Valida-
tion Functions for On-line Test Evaluation of Hybrid Real-time Systems, In Proceed-
ings of the IEEE 41st Anniversary of the Systems Readiness Technology Conference
(AutoTestCon 2006), Pages: 799-805, IEEE Catalog Number: 06CH37750C, ISBN: 1-
4244-0052-X, ISSN: 1088-7725, Anaheim, CA, U.S.A. 2006.
− ZANDER-NOWICKA, J., SCHIEFERDECKER, I., FARKAS, T.: Derivation of Executable
Test Models From Embedded System Models using Model Driven Architecture Arte-
facts - Automotive Domain, In Proceedings of the Model Based Engineering of Em-
bedded Systems II (MBEES II), Editors: Giese, H., Rumpe, B., Schätz, B., TU Braun-
schweig Report TUBS-SSE 2006-01, Dagstuhl, Germany. 2006.
− ZANDER-NOWICKA, J., MARRERO PÉREZ, A., SCHIEFERDECKER, I.: From Functional
Requirements through Test Evaluation Design to Automatic Test Data Retrieval – a
Concept for Testing of Software Dedicated for Hybrid Embedded Systems, In Pro-
ceedings of the IEEE 2007 World Congress in Computer Science, Computer Engineer-
ing, & Applied Computing; The 2007 International Conference on Software Engineer-
ing Research and Practice (SERP 2007), Editors: Arabnia, H. R., Reza, H., Volume II,
Pages: 347-353, ISBN: 1-60132-019-1, Las Vegas, NV, U.S.A. CSREA Press, 2007.
− ZANDER-NOWICKA, J., MARRERO PÉREZ, A., SCHIEFERDECKER, I., DAI, Z. R.: Test De-
sign Patterns for Embedded Systems, In Business Process Engineering. Conquest-
Tagungsband 2007 – Proceedings of the 10th International Conference on Quality En-
gineering in Software Technology (CONQUEST 2007), Editors: Schieferdecker, I.,
Goericke, S., ISBN: 3898644898, Potsdam, Germany. Dpunkt.Verlag GmbH, 2007.
− ZANDER-NOWICKA, J.: Reactive Testing and Test Control of Hybrid Embedded Soft-
ware, In Proceedings of the 5th Workshop on System Testing and Validation (STV
2007), in conjunction with ICSSEA 2007, Editors: Garbajosa, J., Boegh, J., Rodriguez-
Dapena, P., Rennoch, A., Pages: 45-62, ISBN: 978-3-8167-7475-4, Paris, France.
Fraunhofer IRB Verlag, 2007.
1
Studienstiftung des deutschen Volkes – http://www.studienstiftung.de [04/09/2008].](https://image.slidesharecdn.com/zanderdiss-130217192436-phpapp02/85/Zander-diss-7-320.jpg)
![vii
Acknowledgements
“What shall I say?
Everything that I could say would fade into insignificance
compared with what my heart feels […] at this moment.”
- Karol Wojtyła – John Paul II
First of all, I would like to offer my deepest thanks to my supervisor, Professor Dr. Ina
Schieferdecker. She has made this endeavor academically possible, shaped research, and in-
stilled in me the quality to cultivate my own potential. She was one of the first who believed in
me. Her knowledge and suggestions have proven to be invaluable and have contributed pro-
foundly to the results presented in this thesis. It has been an exceptional privilege to work with
her. I dearly appreciate her personality, her work ethics, and the positive energy that she always
emits, as well as how it affects and impacts those around her. These all are rare virtues. I would
like to express my sincerest gratitude towards her. Thank you so much, Ina!
For the invaluable opportunity to work as a visiting scholar in a dynamic environment at the
University of California in San Diego (UCSD) I would like to express my warmest appreciation
to my other supervisor, Professor Dr. Ingolf Heiko Krüger. Providing me scientific support and
professional advice, he has been a person who embodies characteristics that I can only aim to
model myself after. I offer my sincerest gratitude for making me aware of the new perspectives
that have found their way into this work, as well as enlightened my mind.
My genuine appreciation goes out to my former students and wonderful co-workers, especially
Abel Marrero Pérez and Xuezheng Xiong for their invaluable, precise, and diligent contribution
to this work.
Deep respect I express to my work colleagues at Fraunhofer Institute FOKUS in Berlin. In par-
ticular, the discussions with Dr. George Din, Alain Vouffo Feudjio, and Andreas Hoffmann are
truly appreciated. Likewise, I wish to thank all of my colleagues from the UCSD for our fruitful
research interactions and, in particular, Dr. Emilia Farcas for her wonderful charm.
I had the honor of discussing the topics related to this thesis with many skilled people, namely
our partners in industry Dr. Pieter J. Mosterman, Dr. Eckard Bringmann, Dr. Mirko Conrad,
Jens Hermann, and Guy Ndem Collins. It is my privilege to extend my thanks to them for in-
spiring me with their interest in my research and their comments that improved the quality of
this thesis. Also, my visit to The MathWorks helped orient my scientific fundamentals and
shape some interest in my future work.
The members of our doctoral TAV-Junior group are gratefully acknowledged, especially Jür-
gen Großmann, Dr. Stefan Wappler, Abel Marrero Pérez, and Stephan Weißleder as well as the
members of the doctoral working group UML-based Testing: Dr. Zhen Ru Dai, Dr. Dehla
Sokenou, Dr. Dirk Seifert, and Mario Friske for their scientific support.](https://image.slidesharecdn.com/zanderdiss-130217192436-phpapp02/85/Zander-diss-9-320.jpg)


![1 Introduction
“Science arose from poetry… when times change
the two can meet again on a higher level
as friends.”
- Johann Wolfgang von Goethe
1.1 Background and Motivation
The worldwide market for advanced embedded controllers is growing strongly, driven mainly
by the increasing electronic applications in vehicles and the need for comfort and convenience.
Studies in [FS08] expect the European market to grow to € 1.14 billion in 2015 at a compound
annual growth rate (CAGR) of 10.9% from € 499 million in 2007, which substantiates the
growth of the advanced electronic control unit (ECU) market. Giving the background for com-
parison, the worldwide hardware and software market is expected to grow by 8% per annum
[Kri05], whereas the average annual growth rate of the gross domestic product (GDP) has been
5% between 2004 and 2006 [OECD08]. Global light-vehicle production is forecast to grow
from 67 million in 2007 to 80 million in 2015 [AES08].
Furthermore, software shows the highest growth rate within embedded systems. The estimated
average annual growth rates between 2004 and 2009 are 16% for embedded software [Kri05,
Hel+05, OECD05].
Within the past few years the share of software-controlled innovations in the automotive indus-
try has increased from 20% to 85% [Hel+05] and is still growing [MW04, SZ06, BKP+07].
Studies predict that software will determine more than 90% [KHJ07] of the functionality of
automotive systems in the near future. Consequently the impact of software on the customer
and, hence, on market shares and competition will be enormous. [LK08] conclude that software
is established as a key technology in the automotive domain.
1.1.1 Current Trends for Embedded Systems
This thesis is primarily focused on the research on the software aspects of embedded systems,
since this field is expected to have the greatest impact on industry, market, and everyday life in
the near future [BKP+07]. The increasing system functionality can only be realized by a reason-
able shift from hardware to software [LK08]. Software development offers more flexibility,](https://image.slidesharecdn.com/zanderdiss-130217192436-phpapp02/85/Zander-diss-26-320.jpg)
![1 INTRODUCTION 3
more variants can be built and, finally, development time and cost can be reduced. At the same
time, this software often plays a critical role and a failure can result in expensive damage to
equipment, injury, or even death.
Moreover, the widening design productivity gap has to be addressed by advances in design ca-
pabilities. Automation of the process is greatly needed. This applies not only to embedded sys-
tems development and deployment, but also, consequently, to quality assurance of the entire
development process, and the resulting software – not to mention the fundamental research in
any of these areas [Hel+05].
1.1.2 Relevance of Model-based Activities
The creation of consistent, reusable, and well-documented models becomes the important stage
in the development of embedded systems [Hel+05]. Hence, the concept of model-based devel-
opment (MBD) emerges. Due to the increasing complexity of the developed systems it is neces-
sary to model correctly and to implement the chosen design in a correct manner. The future
importance of design-level methods and tools is illustrated by the current shift from implemen-
tation towards design [UL06, CD06]. A lot of decisions formerly made during the implementa-
tion phase should already be done on a higher level of abstraction. The paradigm shift is also
reflected by the increasing use of modeling tools, such as MATLAB®/Simulink®/Stateflow®
(ML/SL/SF) [MathML, MathSL, MathSF] or UML®-based tools [UML, BBH04, BGD07].
With the trend towards behavioral modeling in several embedded systems domains, the imple-
mentation of such models becomes gradually more straightforward. This implies a new stan-
dard of the engineers’ competence at the design level [Hel+05]. Subsequently, the role of the
traditional programmer becomes more restricted since the properly designed models are often
executable. Virtual prototyping, integration, or transformation into different kinds of model is
already possible. Hence, substantial parts of the implementation are generated based on models.
The generated code, if optimized 2, is compiled in the traditional way for different platforms.
Such an approach is manifested within the standardization efforts of the Object Management
Group (OMG) in the context of Model Driven Architecture (MDA) [MDA], where platform-
independent models (PIMs) can be enriched with platform-specific information. The resulting
platform specific models (PSMs) are then the basis for code generation. Also, AUTomotive
Open System Architecture (AUTOSAR) [ZS07] contains the idea of MDA, although a bit more
specific. It shows that in the near future, generation of the optimized code from models will be
possible without losing the precision of handwritten code.
MBD introduction is clearly to be observed in the automotive domain. At the end of the 1990s a
paradigm shift in the development of software-based vehicle functions was initiated. Tradi-
tional software development on the basis of textual specifications and manual coding has not
been possible any more due to the increasing complexity of software-intensive systems, espe-
cially in the context of control theory. Hence, MBD emerged with the application of executable
2
The limited resources of the embedded systems for which the code is generated require optimization techniques to be ap-
plied whenever possible in order to generate efficient code with respect to different dimensions (e.g., memory consump-
tion or execution speed) [SCD+07].](https://image.slidesharecdn.com/zanderdiss-130217192436-phpapp02/85/Zander-diss-27-320.jpg)
![4 1 INTRODUCTION
models and automatic coding [SM01, CFG+05, LK08] in its background. Within MBD, an ex-
ecutable functional model of the ECU is created at an early stage in the development process.
The model consists usually of block diagrams and extended state machines. It can be simulated
together with a plant (e.g., a vehicle) so as to be implemented on the ECU afterwards. Due to
the availability of executable models, analytical methods can be applied early and integrated
into subsequent development steps. The models form a basis for further activities, such as code
generation, model transformations, validation, verification, or testing. The positive effects such
as early error detection and early bug fixing are obvious [CFB04, SG07].
In this thesis, the principles of system development apply to the test system as well. If the dis-
cussion about the relevance of models and model-based development is true for software and
system production, it is also valid for their quality-assurance activities, obviously, including
testing [Dai06, ISTQB06]. With this practice, the concept of model-based testing emerges.
1.1.3 Quality and Testing
An embedded system [BBK98, LV04] is a system built for dedicated control functions. Unlike
standard computer systems, embedded systems do not usually come with peripheral devices,
since hardware is minimized to the greatest possible extent. Embedded software [LV04] is the
software running on an embedded system. Embedded systems have become increasingly so-
phisticated and their software content has grown rapidly in the last few years. Applications now
consist of hundreds of thousands, or even more, lines of code. The requirements that must be
fulfilled while developing embedded software are complex in comparison to standard software.
Embedded systems are often produced in large volumes and the software is difficult to update
once the product is deployed. Embedded systems interact with real-life environment. Hybrid
aspects are often expressed via mathematical formulas. In terms of software development, in-
creased complexity of products, shortened development cycles, and higher customer expecta-
tions of quality implicate the extreme importance of software testing. Software development
activities in every phase are error prone, so the process of defect detection plays a crucial role.
The cost of finding and fixing defects grows exponentially in the development cycle. The soft-
ware testing problem is complex because of the large number of possible scenarios. The typical
testing process is a human-intensive activity and as such it is usually unproductive and often
inadequately done. Nowadays, testing is one of the weakest points of current development prac-
tices. According to the study in [Enc03] 50% of embedded systems development projects are
months behind schedule and only 44% of designs meet 20% of functionality and performance
expectations. This happens despite the fact that approximately 50% of total development effort
is spent on testing [Enc03, Hel+05]. The impact of research on test methodologies that reduce
this effort is therefore very high and strongly desirable [ART05, Hel+05].
Although, a number of valuable efforts in the context of testing already exist, there is still a lot
of space to improve the situation. This applies in particular to the automation potential of the
test methods. Also, a systematic, appropriately structured, repeatable, and consistent test speci-
fication is still an aim to be reached. Furthermore, both abstract and concrete views should be
supported so as to improve the readability, on the one hand, and assure the executability of the
resulting test, on the other. In the context of this work, further factors become crucial. The test-
ing method should address all aspects of a tested system – whether a mix of discrete and con-
tinuous signals, time-constrained functionality, or a complex configuration is considered. In
order to establish a controlled and stable testing process with respect to time, budget and soft-
ware quality, the software testing process must be modeled, measured and analyzed [LV04].](https://image.slidesharecdn.com/zanderdiss-130217192436-phpapp02/85/Zander-diss-28-320.jpg)
![1 INTRODUCTION 5
The existence of executable system models opens the potential for model-based testing (MBT).
Nowadays, MBT is widely used; however, with slightly different meanings. In the automotive
industry MBT is applied to describe all testing activities in the context of MBD [CFS04,
LK08]. It relates to a process of test generation based on the model of a system under test
(SUT). A number of sophisticated methods representing the automation of black-box test de-
sign [UL06] are used. Surveys on different MBT approaches are given in [BJK+05, Utt05,
UL06, UPL06, D-Mint08]. This will be discussed in Section 2.3.4 in detail.
In this thesis, additionally, requirements-based testing is considered. Furthermore, a graphical
form of a test design will increase the readability. The provided test patterns will considerably
reduce the test specifications effort and support their reusability. Then, an abstract and common
manner of describing both discrete and continuous signals will result in automated test signals
generation and their evaluation.
1.1.4 Automotive Domain
Studies show that the strongest impact of embedded systems on the market has to be expected
in the automotive industry. The share of innovative electronics and software in the total value
of an automobile is currently estimated to be at least 25%, with an expected increase to 40% in
2010 and up to 50% after 2010 [Hel+05, SZ06]. Prominent examples of such electronic systems
are safety facilities, advanced driver assistance systems (ADAS), or adaptive cruise control
(ACC). These functionalities are realized by software within ECUs. A modern car has up to 80
ECUs [BBK98, SZ06].
Furthermore, the complexity of car software dramatically increases as it implements formerly
mechanically or electronically integrated functions. Yet, the functions are distributed over sev-
eral ECUs interacting with each other.
At the same time, there is a demand to shorten time-to-market for a car by making its software
components reliable and safe. Additionally, studies in [Dess01] show that the cost of recalling a
car model with a safety-critical failure can be more than the cost of thorough test-
ing/verification. Under these circumstances the introduction of quality-assurance techniques in
the automotive domain becomes obvious and will be followed within this work.
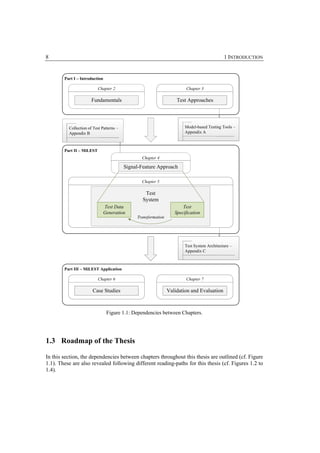
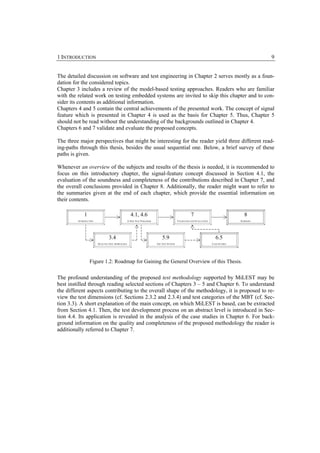
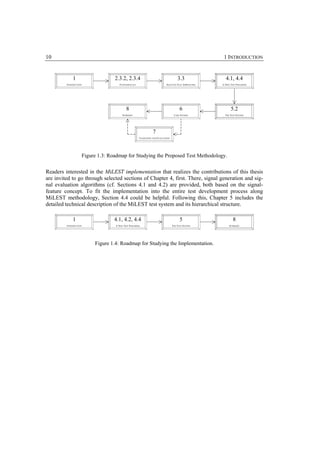
1.2 Scope, Contributions and Structure of the Thesis
After a short motivation on the topic discussed in this thesis, the concrete problems handled
here, are outlined. Then, the structure of the thesis is provided, followed by its roadmap for
reading purposes.
In addition, before the main contributions are explained, a brief report on the scope is given.
The major results achieved in this thesis apply to the software part of embedded systems, in
general. Following the current trends of model-based development, the actual scope of this
work refers to the models of software, on which, the systems are built. To avoid repeating this
term, whenever system (or system model, system design, software) is referred to in the thesis,
the model of a software-intensive embedded system is usually meant, unless the context is ex-
plicitly indicated. This form of reasoning reflects the tendency to study the abstract level of sys-
tems within the considered domain [Pre03b, Con04b, Utt05, BFM+05, CFG+05, AKR+06,
BDG07]. This practice also reflects the trend that the embedded systems are often seen in a ho-](https://image.slidesharecdn.com/zanderdiss-130217192436-phpapp02/85/Zander-diss-29-320.jpg)
![6 1 INTRODUCTION
listic way, i.e., both software and its surrounding hardware trigger the expected functionality
[KHJ07].
The main research problem this thesis is concerned with, relates to assuring the quality of the
embedded system by means of testing at the earliest level of its development. Based on the
analysis of the overall software and test development process, the following questions arise:
1. What is the role of a system model in relation to quality assurance? What is the role of
a test model and what elements does such a test model include? What does MBT mean
in the context of embedded systems? Is it possible to use a common language for both
system and test specifications?
2. How can discrete and continuous signals be handled at the same time? How should a
test framework be designed and a test system realized? What are the reasons and con-
sequences of the design decisions in terms of test generation and test evaluation?
3. How can the process of test specification and test execution be automated to the high-
est possible extent? What is / is not possible to be automated and why?
4. How can the test quality of the test method be assured itself? Which means should be
used and what do they mean in practice?
The resulting contributions of this thesis can be divided into four main areas:
1. Model-based test methodology for testing the functional behavior of embedded, hybrid,
real-time systems based on the current software development trends from practice;
2. In the scope of this methodology, a manner to test the behavior of hybrid systems, in-
cluding the algorithms for systematic test signal generation and signal evaluation;
3. Synthesis of a test environment so as to automate the creation of a comprehensive test
system, which is achieved by means of test patterns application that are organized into
a hierarchy on different abstraction levels;
4. Assurance of the quality of the resulting test by providing the test metrics and support-
ing high coverage with respect to different test aspects.
These are denominated as challenges in the following and the discourses are tackled for each of
them separately, but not in isolation.
For the first challenge, now an introductory remark should already be given. The test frame-
work resulting from this thesis is called Model-in-the-Loop for Embedded System Test
(MiLEST). It is realized in the ML/SL/SF since currently about 50% [Hel+05] of functional be-
havior for embedded systems, particularly in the automotive domain, is modeled using this en-
vironment. Considering the fact that nowadays the integration of validation, verification, and
testing techniques into common design tools is targeted [Hel+05], the argumentation for choos-
ing this framework for test extensions becomes clear. This practice enables to find a common
understanding of software quality problems for both system and test engineers.
In order to clarify and solve the challenges listed above, in the upcoming paragraphs the struc-
ture of this work will be provided with a special emphasis on the given challenges and devel-
oped contributions for each of them.
This thesis is organized as follows. This chapter gives an overview and scope of the research
topics of this thesis. It introduces the problems that the work is dealing with, its objectives, con-
tributions, structure, and roadmap.](https://image.slidesharecdn.com/zanderdiss-130217192436-phpapp02/85/Zander-diss-30-320.jpg)

![2 Fundamentals
“The important thing is not to stop questioning.”
- Albert Einstein
In this chapter the fundamentals of embedded systems, their development and testing are pro-
vided. Firstly, in Section 2.1, the notion of the system under consideration from different per-
spectives is given. Thus, the definitions of embedded, hybrid, reactive, and real-time systems
are explained, respectively. In addition, the backgrounds on electronic control units and control
theory are discussed. Understanding the characteristics of the system under test (SUT) enables
further considerations on its development and quality-assurance methods. Further on, in Section
2.2, the concepts of model-based development from the automotive viewpoint are introduced.
MATLAB/Simulink/Stateflow (ML/SL/SF) as an example of a model-based development
framework is introduced and related approaches are listed.
Section 2.3 gives an insight into the testing world. First, the testing aspects important for the
automotive domain are described in detail by categorizing them into different dimensions.
Then, requirements on testing within the considered domain are specified. Furthermore, a
model-based testing definition and its goals are introduced. A discussion on test patterns com-
pletes the theoretical basics.
2.1 Yet Another System under Test
As already discussed in Chapter 1, the main contribution of this work applies to models of soft-
ware-intensive embedded systems. Whenever a system (or system model, system design, soft-
ware) is referred to in this thesis, the model is usually meant.
2.1.1 Embedded System
An embedded system (ES) is any computer system or computing device that performs a dedi-
cated function or is designed for use with a specific software application [BBK98, Hel+05]. In-
stead of dealing with data files, it deals with the control of physical phenomena. It is frequently
connected to a physical environment through sensors and actuators as shown in Figure 2.1.](https://image.slidesharecdn.com/zanderdiss-130217192436-phpapp02/85/Zander-diss-35-320.jpg)
![12 2 FUNDAMENTALS
Environment (i.e., External Process)
Sensor Actuator
Embedded System
(e.g., Electronic Control Unit)
Embedded Software
Figure 2.1: Interactions of Embedded System with the Environment.
ES [Hel+05] is a specialized computer system that is part of a larger system or machine. All
appliances that have a digital interface – watches, microwaves, cars, planes, industrial robots,
security systems – utilize ESs. Some of them include an operating system, but many are so spe-
cialized that the entire logic can be implemented as a single program. Nowadays, software inte-
grated with the ES, also called embedded software [Con04b], makes up 85% [Hel+05] of the
value of the entire ES.
2.1.2 Hybrid System
Hybrid means generally combining two different technologies or systems. A hybrid system is a
dynamic system that exhibits both continuous and discrete dynamic behavior [Hen00]. Its be-
havior can be described by both differential equations and difference equations. Hybrid systems
evolve in continuous time with discrete jumps at particular time instances [Tiw02]. For exam-
ple, an automobile engine whose continuous fuel injection is regulated by a discrete microproc-
essor is a hybrid system [Hen00].
2.1.3 Reactive System
In opposite to the transformative systems, reactive systems with a typically non-terminating
behavior interact with their environment. As a result, once started, a reactive system operates
continually [Krü00]. It accepts input from its environment, it changes its internal state at the
same time [Hel+05] and produces corresponding outputs. Reactive systems never halt, although
the output of these systems may always be empty from a certain point in time onward.
A reactive system is characterized by a control program that interacts with the environment or
another control program [MW91, HP85]. ESs are usually reactive.](https://image.slidesharecdn.com/zanderdiss-130217192436-phpapp02/85/Zander-diss-36-320.jpg)
![2 FUNDAMENTALS 13
2.1.4 Real-Time System
According to [LL90], a real-time system is a computing system where initiation and termina-
tion of activities must meet specified timing constraints. The correctness of a computation not
only depends on the logical correctness of the system, but also on the time at which the result is
produced. A real-time system has to obey hard, soft, and statistical [Dess01, Hel+05] real-time
properties.
Hard real-time properties are timing constraints which have to be fulfilled in any case. An ex-
ample is the autopilot of an aircraft, where violation of hard real-time constraints might lead to
a crash.
Soft real-time properties are time constraints which need to be satisfied only in the average
case, to a certain percentage, or fast enough. An example is video transmission where a delayed
frame might either be displayed or dropped, which is not perceivable as long as no consecutive
frames are affected [Dess01]. Another example is the software that maintains and updates the
flight plans for commercial airliners.
In statistical real time, deadlines may be missed, as long as they are compensated by faster per-
formance elsewhere to ensure that the average performance meets a hard real-time constraint.
To be able to fully assess the consequences of the statistical behavior, stochastic analysis is re-
quired. However, it is always possible to transform this into a deterministic analysis by investi-
gating the worst case situation [Dess01].
Typical examples of timing constraints are:
− the value from the sensor must be read every 100 ms
− the Worst-Case Execution Time (WCET) of process A is 160 ms
− it is expected that when event B finishes, event A appears after 10 ms
− it is expected that when event B appears, then during 20 ms signal A will be continu-
ously sent
− it is expected that within 5 ms all events stop
2.1.5 Electronic Control Unit in the Automotive
In the automotive domain, an embedded system is called an electronic control unit (ECU). It
controls one or more of the electrical subsystems in a vehicle. In a car, ECUs are connected via
bus systems such as, e.g., CAN 3, LIN 4, MOST 5, FlexRay™ 6 [Sch06] among others.
3
CAN in Automation – www.can-cia.org [04/04/08].
4
LIN Consortium – www.lin-subbus.de [04/04/08].
5
MOST Cooperation – www.mostnet.org [04/04/08].
6
FlexRay Group – www.flexray.com [04/04/08].](https://image.slidesharecdn.com/zanderdiss-130217192436-phpapp02/85/Zander-diss-37-320.jpg)
![14 2 FUNDAMENTALS
An instance of embedded system in the form of an ECU controller has been depicted in Figure
2.1. The external process is a process that can be of physical, mechanical, or electrical nature
[GR06]. Sensors provide information about the current state of the external process by means
of so-called monitoring events. They are transferred to the controller as input events.
The controller must react to each received input event. Events usually originate from sensors.
Depending on the received events from sensors, corresponding states of the external process
are determined.
Actuators receive the results determined by the controller which are transferred to the external
process.
A classification of the application fields of ECUs according to [SZ06] is given below:
− Body (e.g., for headlights, brake lights, air conditioning, power windows)
− Comfort (e.g., for seat and steering-position adjustment, seat heating)
− Engine and power train (e.g., for fuel injection, battery recharging)
− Dashboard for speedometer, odometer, fuel gauge
− Chassis, driving functions
− Telematics and entertainment for audio/video systems
Automotive software, similarly to embedded software for an embedded system, the software is
driving an ECU within automobiles.
2.1.6 Control Theory
Considering the ECUs (in particular, closed-loop ECUs), it is inevitable to introduce the basics
of control theory. Aristotle 7 [Ack81] already started to think about the control theory [Ben79].
Following his statement “… if every instrument could accomplish its own work, obeying or an-
ticipating the will of others … chief workmen would not want servants, nor masters slaves”
[AR], his wish was to automatize the behavior of others (e.g., people, devices) using a set of
clearly defined criteria. This is also the idea behind the development of embedded systems – to
force them so that they work in a manner they are designed. If so, quality assurance for this de-
velopment gains the priority too.
Control theory is an interdisciplinary branch of engineering and mathematics that deals with the
behavior of dynamic systems. The desired output of a system is called the reference. When one
or more output variables of a system need to follow a certain reference over time, a controller
manipulates the inputs to a system to obtain the desired effect on the output of the system.
Control theory introduces a feedback. Feedback is a process whereby some proportion of the
output signal of a system is passed (fed back) to the input. This is often used to control the dy-
namic behavior of the system [SG03, MSF05]. A closed-loop controller uses feedback to con-
trol states or outputs of a dynamic system. Its name is derived from the information path in the
system: process inputs (e.g., voltage applied to an electric motor) have an effect on the process
7
Aristotle (384 B.C. – 322 B.C.) was a Greek philosopher, a student of Plato and teacher of Alexander the Great. He wrote
on many different subjects, including physics, metaphysics, poetry, theater, music, logic, rhetoric, politics, government,
ethics, biology and zoology [Ack81].](https://image.slidesharecdn.com/zanderdiss-130217192436-phpapp02/85/Zander-diss-38-320.jpg)
![2 FUNDAMENTALS 15
outputs (e.g., velocity or torque of the motor), which is measured with sensors and processed by
the controller. The resulting control signal is used as input to the process, closing the loop.
Closed-loop controllers have the following advantages over open-loop controllers [Kil05]:
− guaranteed performance
− rejection of disturbance (e.g., unmeasured friction in a motor)
− capability to stabilize unstable processes
− reduced sensitivity to parameter variations
− improved performance for reference tracking
A simple controller (see Figure 2.2) attempts to correct the error between a measured process
variable (i.e., output – y(t)) and a desired setpoint (i.e., reference – r(t)) by calculating and then
producing a corrective action (i.e., error – e(t)) that can adjust the process accordingly.
In particular, the output of the system y(t) is fed back to the reference value r(t), through a sen-
sor measurement. The controller C then uses the error e(t) (i.e., difference between the refer-
ence and the output) to change the inputs u to the system under control P (e.g., a car).
r + e u y
C P
-
Figure 2.2: A Simple Closed–Loop Controller.
This situation is called a single-input-single-output (SISO) control system. Multi-Input-Multi-
Output (MIMO) systems, with more than one input/output, are common. In such cases, vari-
ables are represented through vectors instead of simple scalar values. For some distributed pa-
rameter systems the vectors may be infinite-dimensional (typically functions).
Common closed-loop controller architecture, widely used in industrial applications, is the pro-
portional-integral-derivative (PID) controller [Kil05]. Its name refers to the three terms operat-
ing on the error signal to produce a control signal. Its general form is:
t
de
u (t ) = K P e(t ) + K I ∫ e(t )dt + K D ,
0
dt
where: KP – proportional gain
KI – integral gain
KD – derivative gain.
Larger KP typically means faster response since the larger the error, the larger the proportional
term compensation. An excessively large proportional gain will lead to process instability and
oscillation. Larger KI implies steady-state errors are eliminated quicker. The trade-off is larger
overshoot. Larger KD decreases overshoot, but slows down transient response and may lead to
instability due to signal noise amplification in the differentiation of the error.
The desired closed-loop dynamics is obtained by adjusting the three parameters KP, KI and KD,
usually iteratively by tuning and without specific knowledge of a model under control [Kil05].](https://image.slidesharecdn.com/zanderdiss-130217192436-phpapp02/85/Zander-diss-39-320.jpg)
![16 2 FUNDAMENTALS
2.2 Model-based Development
The development process of embedded systems usually occurs on at least three different levels.
First a model of the system is built. It simulates the required system behavior and usually repre-
sents an abstraction of the system. When the model is revealed to be correct, code is generated
from the model. This is the software level. Eventually, hardware including the software is the
product of the development. The reason for building those intermediate levels is the fact, that it
is much cheaper and faster to modify a model than to change the final product. The entire proc-
ess is called model-based development (MBD).
The multiple V-model [BN02, SZ06], based on the traditional V-Modell®, takes this phenome-
non into account. The V-Modell is a guideline for the planning and execution of development
projects, which takes into account the whole life cycle of the system. The V-Modell defines the
results that have to be prepared in a project and describes the concrete approaches that are used
to achieve these results [VM06]. In the multiple V-model, each specification level (e.g., model,
software, final product) follows a complete V-development cycle, including design, build, and
test activities as shown in Figure 2.3. The essence of the multiple V-model is that different
physical representations of the same system on different abstraction levels are developed, aim-
ing at the same final functionality. Then, the complete functionality can be tested on those dif-
ferent platforms. Since certain detailed technical properties cannot be tested very well on the
model, they must be tested on the prototype instead. Testing the various SUT representations
often requires specific techniques and a specific test environment. Therefore, a clear relation
between the multiple V-model and the different test environments exists.
Model Software Hardware
Figure 2.3: The Multiple V-Model.
2.2.1 Issues in Model-based Development
In this thesis the automotive specific MBD process is taken into account to illustrate the prob-
lems and prepare the background for further considerations on quality assurance (QA).
Since automotive development is an interdisciplinary business including software, electrical
and mechanical engineering aspects, it is important to create an executable functional and
graphical model. Engineers can find a common functional understanding early in the design
phase and improve communication within their teams, with customers, or between car manu-](https://image.slidesharecdn.com/zanderdiss-130217192436-phpapp02/85/Zander-diss-40-320.jpg)
![2 FUNDAMENTALS 17
facturers and suppliers [BN02, Gri03, Leh03, Con04a, Con04b, CFG+05, LK08]. Moreover,
separation of concerns appears. The core algorithms are isolated from the technical aspects such
as fixed-point scaling (i.e., the transformation of floating-point algorithms to fixed-point com-
putations), calibration data management and the representation of signals in memory [LK08].
That way the complexity of models is still manageable.
This work encompasses the functional and implementation models (i.e., physical behavioral
models) [KHJ07, Con04a] in detail. The objective of a functional model is to demonstrate the
feasibility of new functionalities and algorithms. Functional models are executable, but concen-
trate on the core function of the system. Their testing is reduced to the area of the core func-
tionality. Currently, the tests are nearly automated. Complex functional models are split into
sub-models and tested separately. Further on, if it is planned to generate the code automatically
from such functional models, they are refined and enhanced to the so-called implementation
models [KHJ07]. In such a case, they cover all aspects of the final product, except some parts
that are usually excluded from being developed using model-based techniques, such as signal
I/O code, task scheduling, performance, bootstrap code, or operating system-related functions.
The promise of the model-based design is to simulate, analyze, and validate the models prior to
implementation. Executing analysis early in the development cycle enables the detection and
correction of design problems sooner at a lower cost.
The most important open issue emerging here is how to assure a high quality of the functional
and implementation models. Any error at the early level is distributed down to the code and
hardware realization.
2.2.2 Other Model-based Technologies
The introduction of MBD led to the development of modeling technologies. Consequently ex-
ecutable high-level models can be obtained. The selection of a modeling technology is very
dependent on the type of system being modeled and the task for which the model is being con-
structed [Mos97]. Continuous systems are best modeled by differential equations supplemented
by algebraic constraints, if necessary, whereas discrete systems demand Petri nets, finite state
automata, Timed Communicating Sequential Processes (Timed CSP) [Mos97].
Some currently available modeling techniques offer a generalized environment and allow for
interaction between the methodologies. This enables heterogeneous systems of hybrid nature to
be modeled, combined and different views analyzed based on a common notation or environ-
ment. The modern techniques provide both support for model structure analysis of a dynamic
physical system and a comprehensive, systematic approach to describing differential equations.
Moreover, due to their compositional characteristics, they enable hierarchical modeling as well
as modifying a particular subsystem to a more detailed model. These technologies can be
MATLAB/Simulink/Stateflow (ML/SL/SF), LabView [LabV] and lately also Unified Modeling
Language™ (UML®) [UML], or company-specific.
Since graphical modeling languages increase the productivity benefits of 4 to 10 times as given
in [KHJ07, Hel+05], several efforts have been undertaken in that area. SCADE Suite™
[DCB04], ASCET [DSW+03], Charon [AGH00], Dymola [Soe00], HYSDEL [TB04], Hy-
Visual [LZ05], Modelica [Mod], hySC [GKS99] are some of the examples.
Additionally, methods such as correct-by-construction (CbyC) methods exist [BFM+05]. They
enable automatic code generation ensuring that what is verified on the model level can also be](https://image.slidesharecdn.com/zanderdiss-130217192436-phpapp02/85/Zander-diss-41-320.jpg)
![18 2 FUNDAMENTALS
verified on the embedded code level. Applying CbyC testing is still performed, but its role is to
validate the correct-by-construction process rather than to find faults. With the growing com-
plexity of software-intense embedded systems, CbyC and formal verification methods become
less applicable. It happens because of the increasing state space of the systems. Thus, sample-
based testing based on formal correctness criteria and test hypotheses gains importance
[BFM+05].
In the next section, ML/SL/SF will be discussed in detail since the approach proposed in this
thesis is based on this framework.
2.2.3 MATLAB/Simulink/Stateflow as a Framework
ML/SL/SF 8 is one of the most advanced solutions for modeling embedded systems in the auto-
motive domain. 50% of behavioral models within the control systems are designed applying
this tool, being the de-facto standard in the area [Hel+05].
MATLAB: MATLAB (ML) product [MathML] is a technical computing environment, includ-
ing the m language, for analyzing data and developing algorithms. It integrates computation,
data analysis, visualization, and programming so as to solve mathematical problems in techni-
cal and scientific applications [MathML]. The tool can be used in a number of fields, including
signal and image processing, communications, control design, test and measurement, financial
modeling and analysis, or computational biology.
Simulink: Simulink (SL) product [MathSL] integrated with ML is a software package in the
form of a simulation engine and a customizable set of libraries. It is an interactive graphical
environment enabling simulation and model-based development of dynamic systems.
SL offers different kinds of solvers for the numerical solution of differential equations and dif-
ference equations. SL models are organized as hierarchical block diagrams. Treating an SL
model as a program, the connections between the blocks would be variables, but the value of
such a variable would be a function defined over a continuum [LN05]. SL models are designed
applying blocks available in libraries. SL libraries are collections of special-purpose functions
that can be re-used in models. With this practice the development time is reduced, function re-
usability is supported, and the maintainability is improved. Blocks copied from a library remain
linked to their originals such that changes in the originals automatically propagate to the copies
in a model. Libraries ensure that the models automatically include the most recent versions of
the previously defined blocks and give fast access to the commonly-used functions. Several
dedicated libraries for a number of technical and industrial applications exist. A convenient fea-
ture of the SL environment is the possibility of its extension by creating new libraries. Another
one is the capability of integrating functions written in C using S-Functions.
Moreover, if automatic code generation is used to generate C code from the SL/SF model
(which is possible by applying e.g., Real-Time Workshop) [Tun04], the functions can be exe-
cuted in the real vehicle. Such code is run on hardware systems in real time. They are connected
8
In the context of this thesis the following versions of the software have been used: MATLAB® 7.5.0.342, MATLAB®
Report Generator 3.2.1™ (R2007b), Simulink® Report Generator™ 3.2.1 (R2007b), Simulink® 7.0 and Stateflow® 7.0;
Release R2007b.](https://image.slidesharecdn.com/zanderdiss-130217192436-phpapp02/85/Zander-diss-42-320.jpg)
![2 FUNDAMENTALS 19
to the real plant by special I/O. As a consequence, changes can be made directly to the function
model and tried out by generating code once again [Bod05, BDH05, SCD+07, D-Mint08].
Implementation of the function on a production ECU is also done by automatic or semi-
automatic production code generation. However, the requirements on such a code generator are
much higher than for rapid control prototyping (RCP). The generated code must be highly effi-
cient, error-free, reproducible, and well documented [SCD+07].
A SL model is defined as a tuple SL = (B, root, sub_h, P, rlt, sig, subi, subo, C):
(i) B is the set of blocks in the model. Subsystem blocks Bs, in-blocks in subsystems Bi, out-
blocks in subsystems Bo (representing inputs and outputs of subsystems), merge blocks Bm and
blocks with memory Bmem. When referring to other types of ”basic” blocks Bb is used in this
paper. Furthermore, subsystem can be divided into, normal, virtual subsystems Bvs and non-
virtual subsystems Bns, Bs = Bvs ∪ Bns. The virtual subsystems do not affect the behavioral se-
mantics of SL, whereas the non-virtual can. Subsystems Bs, in-blocks, Bi and out-blocks Bo are
referred to as virtual blocks, since they are used purely for structuring and have no effect on the
behavioral semantics;
(ii) root ∈ Bvs is the root subsystem;
(iii) sub_h: B → Bs is a function that describes the subsystem hierarchy. For every block b,
sub_h.b gives the subsystem b is in. Note that sub_h.root = root;
(iv) P is the set of ports for inputs and output of data to and from blocks. The ports Pi ⊆ P is
the set of in-ports and Po ⊆ P is the set of out-ports, P = Pi ∪ Po;
(v) rlt: P → B is a relation that maps every port to the block it belongs to;
(vi) sig: Pi → Po maps every in-port to the out-port it is connected to by a signal;
(vii) subi: Bs → Po → ρ(Pi) is a partial function that describes the mapping between the in-ports
of a subsystem and the out-ports of the non-virtual block Bi representing the in-port block in
that subsystem;
(viii) subo: Bs → Po → ρ(Pi) is a partial function that describes the mapping between the out-
ports of a subsystem and the in-ports of the non-virtual block Bo representing the out-port block
in that subsystem;
(ix) C is the set of block parameters of the model. The block parameters are a set of constants
defined in ML workspace.
Similar definitions of the SL model are given in [BM07, BMW07] including the examples.
Stateflow: Stateflow (SF) product [MathSF] extends the SL so as to support modeling of dis-
crete systems more easily and readably. SF model is sequential and deterministic. It is a hierar-
chical state machine that includes states labeled with lists of actions and transitions labeled with
guards and actions.
The semantic of SF models defined by [Tiw02] is the following. A SF chart is described by a
tuple SF = (D, E, S, T, f), where:
(i) D = DI ∪ DO ∪ DL is a finite set of typed variables that is partitioned into input variables DI,
output variables DO and local variables DL;
(ii) E = EI ∪ EO ∪ EL is a finite set of events that is partitioned into input events EI, output
events EO and local events EL;
(iii) S is a finite set of states, where each state is a tuple consisting of three kinds of actions:
entry, exit, and during; an action is either an assignment of an expression to a variable or an
event broadcast; When a state has parallel (AND) decomposition, all its substates present at the
same hierarchy level are always active. When a state has exclusive (OR) decomposition, only
one substate can be active at a time.](https://image.slidesharecdn.com/zanderdiss-130217192436-phpapp02/85/Zander-diss-43-320.jpg)
![20 2 FUNDAMENTALS
(iv) T is a finite set of transitions, where each transition is given as a tuple (src, dst, e, c, ca, ta)
in which src ∈ S is the source state, dst ∈ S is the destination state, e ∈ E ∪ {є} is an event, c
∈ WFF(D) is a condition given as a well-formed formula in predicate logic over the variables D
and ca, ta are set of actions (called condition actions and transition actions, respectively);
(v) f : S → ({and, or} × 2S) is a mapping from the set S to the Cartesian product of {and, or}
with the power set of S and satisfies the following properties: (a) there exists a unique root state
sroot, i.e., sroot ∉ ∪ i descendants(si), where descendants(si) is the second component of f (si), (b)
every non-root state s has exactly one ancestor state; that is, if s ∈ descendants(s1) and s ∈
descendants(s2), then s1 = s2, and (c) the function f contains no cycles; that is, the relation < on
S defined by s1 < s2 iff s1 ∈ descendants(s2) is a strict partial order. If f(s) = (and, {s1, s2}), then
the state s is an AND-state consisting of two substates s1 and s2. If f(s) = (or, {s1, s2}), then s is
an OR-state with substates s1 and s2. In the syntactic description of an SF chart, junctions are
ignored for simplicity.
SL Simulation: The SL execution engine, called a solver is a component that determines the
next time step when a simulation needs to meet the target accuracy requirements [MathSL,
LN05]. SL provides an extensive set of solvers, each adept at choosing the next time step for
specific types of applications. They fall into two basic categories fixed-step and variable-step.
Fixed-step solvers solve the model at regular time intervals from the beginning to the end of the
simulation. The size of the interval is known as the step size [MathSL] and will be called time
step size in the following. Decreasing the time step size increases the accuracy of the results
while increasing the time required for simulating the system.
Variable-step solvers vary the time step size during the simulation, reducing the time step size
to increase accuracy when a model's states are changing rapidly and increasing the time step
size to avoid taking unnecessary steps when the model's states are changing slowly. Computing
the time step size adds to the computational overhead at each step but can reduce the total num-
ber of steps and hence, simulation time.
When modeling automotive embedded software solvers with a fixed time step size are used
[Con04a]. SL provides a set of fixed-step continuous solvers. They employ numerical integra-
tion to compute the values of a model's continuous states at the current step from the values at
the previous step and the values of the state derivatives. This allows the fixed-step continuous
solvers to handle models that contain both continuous and discrete states.
In the case studies discussed in this thesis, explicit fixed-step continuous solver ode4 (i.e., ordi-
nary differential equations of 4th computational complexity) has been selected. It is based on the
integration technique defined by the fourth-order Runge-Kutta (RK4) [PFT+92] formula. This
method is reasonably simple and robust. It is a general candidate for numerical solution of dif-
ferential equations when combined with an intelligent adaptive step-size routine.
Let an initial value problem be specified as follows y ' = f (t , y ),
where the initial value y is: y (t0 ) = y0 .
Then, the iterative formula for y applying the RK4 method is given by the following equations:
h (2.1)
y n +1 = y n + (k1 + 2k2 + 2k3 + k4 ) ,
6](https://image.slidesharecdn.com/zanderdiss-130217192436-phpapp02/85/Zander-diss-44-320.jpg)
![2 FUNDAMENTALS 21
t n+1 = t n + h (2.2)
where yn+1 is the RK4 approximation of y(tn+1) and
k1 = f (tn , yn ) (2.3)
⎛ h h ⎞
k2 = f ⎜ tn + , yn + k1 ⎟ (2.4)
⎝ 2 2 ⎠
⎛ h h ⎞
k3 = f ⎜ t n + , yn + k 2 ⎟ (2.5)
⎝ 2 2 ⎠
k 4 = f (t n + h, yn + hk 3 ). (2.6)
Thus, the next value (yn+1) is determined by the present value (yn) plus the product of the size of
the interval (h) and an estimated slope.
The slope is a weighted average of slopes:
− k1 is the slope at the beginning of the interval
− k2 is the slope at the midpoint of the interval, using slope k1 to determine the value of y
at the point t n + h 2 using Euler's method
− k3 is again the slope at the midpoint, but now using the slope k2 to determine the y
value
− k4 is the slope at the end of the interval, with its y value determined using k3.
In averaging the four slopes, greater weight is given to the slopes at the midpoint:
k1 + 2k 2 + 2k3 + k4
slope = (2.7)
6
The RK4 method is a fourth-order method, meaning that the error per step is on the order of h5,
while the total accumulated error has order h4. The above formulas are valid for both scalar-
and vector-valued functions (i.e., y can be a vector and f an operator).
Further details about the ML/SL/SF framework can be found in [MathML, MathSL, MathSF].
2.3 Testing
2.3.1 Software Testing
Testing, an analytic means for assessing the quality of software [Wal01, UL06], is one of the
most important phases during the software development process with regard to quality assur-
ance. It „can never show the absence of failures“ [Dij72], but it aims at increasing the confi-
dence that a system meets its specified behavior. Testing is an activity performed for improving
the product quality by identifying defects and problems. It cannot be undertaken in isolation.
Instead, in order to be in any way successful and efficient, it must be embedded in an adequate
software development process and have interfaces to the respective sub-processes.](https://image.slidesharecdn.com/zanderdiss-130217192436-phpapp02/85/Zander-diss-45-320.jpg)
![22 2 FUNDAMENTALS
The fundamental test process according to [BS98, SL05, ISTQB06] comprises (1) planning, (2)
specification, (3) execution, (4) recording (i.e., documenting the results), (5) checking for com-
pletion, and test closure activities (e.g., rating the final results).
Test planning includes the planning of resources and the laying down of a test strategy: defining
the test methods and the coverage criteria to be achieved, the test completion criteria, structur-
ing and prioritizing the tests, and selecting the tool support as well as configuration of the test
environment [SL05]. In the test specification the corresponding test cases are specified using
the test methods defined by the test plan [SL05]. Test execution means the execution of test
cases and test scenarios. Test records serve to make the test execution understandable for peo-
ple not directly involved (e.g., customer) and prove afterwards, whether and how the planned
test strategy was in actual fact executed. Finally, during the test closure step data is collected
from completed test activities to consolidate experience, testware, facts, and numbers. The test
process is evaluated and a report is provided [ISTQB06].
In addition, [Dai06] considers a process of test development. The test development process,
related to steps 2 – 4 of the fundamental test process, can be divided into six phases, which are
usually consecutive, but may be iterated: test requirements, test design, test specification, test
implementation, test execution, and test evaluation.
The test process aimed at in this work covers with the fundamental one, although only steps 2 –
4 are addressed in further considerations. Compared to [Dai06] the test development process is
modified and shortened. It is motivated by the different nature of the considered SUTs. Within
traditional software and test development, phases are clearly separated [CH98]. For automotive
systems a closer integration of the specification and implementation phases occurs. Hence, after
defining the test requirements, the test design phase encompasses the preparation of a test har-
ness. The detailed test specification 9 and test implementation are done within one step as the
applied modeling language is executable. Up to this point, the test development process sup-
ported in this thesis, is very similar to the one defined by [Leh03]. Further on, test execution
and test evaluation are performed simultaneously. The details of the proposed test methodology
and test development process will be given in Chapters 4 and 5.
In addition, apart from testing, validation, and verification as further QA activities are espe-
cially important in the domain of embedded systems due to the usually high dependability re-
quirements (e.g., safety, reliability, and security). The purpose of validation is to confirm that
the developed product meets the user needs and requirements. Verification ensures that it is
consistent, complete, and correct at the different steps of the life cycle. Testing means exercis-
ing an implementation to detect faults and can be used both for verification and for validation.
A further important aspect is the application of QA for the certification of products, especially
in safety-critical domains. New certification standards (e.g., IEC 61508 [IEC05] and ISO 26262
[ISO_SF] for the automotive or the followers of the DO-178B [RT92] in the avionics industry)
increasingly require the creation of formal models [Hel+05] and reliable QA techniques.
9
Test specification phase is called test design in a number of sources [Gri03, ISTQB06, Din08].](https://image.slidesharecdn.com/zanderdiss-130217192436-phpapp02/85/Zander-diss-46-320.jpg)
![2 FUNDAMENTALS 23
2.3.2 Test Dimensions
Tests can be classified in different levels, depending on the characteristics of the SUT and the
test system. [Neu04] aims at testing the communication systems and categorizes testing in the
dimensions of test goals, test scope, and test distribution. [Dai06] replaces the test distribution
by a dimension describing the different test development phases, since she is testing both local
and distributed systems. In this thesis embedded systems are regarded as SUTs, thus, the test
dimensions are modified as shown in Figure 2.4.
In the following the analysis of the current test process for embedded systems reveals a gap that
if bridged, will contribute to the overall development cost and time reduction at most. Herewith,
the concrete aims of the test methodology proposed in this thesis, are established.
Test Abstraction
Non-
functional
Test Execution
Platform
Non-abstract
Functional PiL
Test Goal
HiL
Structural Abstract Test Reactiveness
SiL
Reactive
MiL
Static
Non-reactive
Component Integration System
Test Scope
Figure 2.4: The Five Test Dimensions.
Test Goal: During the software development systems are tested with different purposes (i.e.,
goals). They can be categorized into static testing, also called review, and dynamic testing,
whereas the latter is distinguished between structural, functional, and non-functional testing. In
the automotive, after the review phase, the test goal is usually to check the functional behavior
of the system. Non-functional tests appear in later development stages.](https://image.slidesharecdn.com/zanderdiss-130217192436-phpapp02/85/Zander-diss-47-320.jpg)
![24 2 FUNDAMENTALS
− Static Test: Testing is often defined as the process of finding the errors, failures, and
faults. Errors in a program can be revealed without execution by just examining its
source code [ISTQB06]. Similarly, other development artefacts can be reviewed (e.g.,
requirements, models, or test specification itself). This process is called static testing.
Dynamic testing in contrast, bases on execution.
− Structural Test: Structural tests cover the structure of the SUT during test execution
(e.g., control or data flow). To achieve this, the internal structure of the system (e.g.,
code or model) needs to be known. Therefore, structural tests are also called white-box
or glass-box tests [Mye79, ISTQB06].
− Functional Test: Functional testing is concerned with assessing the functional behavior
of an SUT against the functional requirements. In contrast to structural tests, functional
tests do not require any knowledge about system internals. They are therefore called
black-box tests [Bei95]. In this category functional safety tests are also included. Their
purpose is to determine the safety of a software product. They require a systematic,
planned, executed, and documented procedure. At present, safety tests are only a small
part of software testing in the automotive area. By introduction of safety standards such
as IEC 61508 [IEC05] and ISO 26262 [ISO_FS] the meaning of software safety tests
will, however, increase considerably within the next few years.
− Non-functional Test: Similar to functional tests, non-functional tests are performed
against requirements specification of the system. In contrast to pure functional testing,
non-functional testing aims at the assessment of non-functional, such as reliability,
load, or performance requirements. Non-functional tests are usually black-box tests.
Nevertheless, for retrieving certain information, e.g., internal clock, internal access
during test execution is required.
For example, during the robustness test the system is tested with invalid input data
which are outside the permitted ranges to check whether the system is still safe and
works properly. As a rule, the robustness is ensured by dedicated plausibility checks in-
tegrated into the automotive software.
The focus of this thesis is put on functional tests. However some timing 10 and safety aspects are
included as well.
10
In traditional understanding the purpose of real-time tests is to find system paths for whose time response of individual
tasks or the whole ECU is critical. Since the results of the timing behavior depend strongly on the target architecture, real-
time tests are carried out mostly on target systems [Leh03, Con04a, KHJ07].
The context of real-time testing in this thesis refers to the situation when the real-time properties are related to functional
behavior. In that case they cannot be tested on their own, but require a test case which also involves the associated func-
tional events for stimulating and observing the SUT [Neu04, Dai06]. Thus, real-time testing is incorporated into functional
testing and is understood as functional testing of timing constraints rather than real-time properties in the traditional sense.](https://image.slidesharecdn.com/zanderdiss-130217192436-phpapp02/85/Zander-diss-48-320.jpg)
![2 FUNDAMENTALS 25
Test Abstraction: As far as the abstraction level of the test specification is considered, the
higher the abstraction, the better test understandability, readability, and reusability is observed.
However, the specified test cases must be executable at the same time. The non-abstract tests
are supported by a number of tool providers (see Chapter 3) and they do not scale for larger
industrial projects [LK08]. Hence, the abstraction level should not affect the test execution in a
negative way.
This thesis develops a conceptual framework for abstract test specification; however, simulta-
neously an executable technical framework for a selected platform is built.
Test Execution Platform: The test execution is managed by so-called test platforms. The pur-
pose of the test platform is to stimulate the test object (i.e., SUT) with inputs, and to observe
and analyze the outputs of the SUT.
The test platform is a car with a test driver. The test driver determines the inputs of the SUT by
driving scenarios and observes the reaction of the car supported by special diagnosis and meas-
urement hardware/software that records the test data during the test drive and allows the behav-
ior to be analyzed offline. An appropriate test platform has to be chosen depending on the test
object, the test purpose, and the necessary test environment.
− Model-in-the-Loop (MiL): The first integration level, MiL, is based on the model of the
system itself. In this platform the SUT is a functional model or implementation model
that is tested in an open-loop (i.e., without any plant model in the first place) or closed-
loop test with a plant model (i.e., without any physical hardware) [KHJ07, SZ06,
LK08]. The test purpose is basically functional testing in early development phases in
simulation environments such as ML/SL/SF.
− Software-in-the-Loop (SiL): During SiL the SUT is software tested in a closed or open-
loop. The software components under test are usually implemented in C and are either
hand-written or generated by code generators based on implementation models. The
test purpose in SiL is mainly functional testing [KHJ07]. If the software is built for a
fixed-point architecture, the required scaling is already part of the software.
− Processor-in-the-Loop (PiL): In PiL embedded controllers are integrated into embed-
ded devices with proprietary hardware (i.e., ECU). Testing on PiL level is similar to
SiL tests, but the embedded software runs on a target board with the target processor or
on a target processor emulator. Tests on PiL level are important because they can re-
veal faults that are caused by the target compiler or by the processor architecture. It is
the last integration level which allows debugging during tests in a cheap and manage-
able way [LK08]. Therefore, the effort spent by PiL testing is worthwhile in almost all
cases.
− Hardware-in-the-Loop (HiL): When testing the embedded system on HiL level the
software runs on the final ECU. However the environment around the ECU is still a
simulated one. ECU and environment interact via the digital and analog electrical con-
nectors of the ECU. The objective of testing on HiL level is to reveal faults in the low-
level services of the ECU and in the I/O services [SZ06]. Additionally, acceptance tests
of components delivered by the supplier are executed on the HiL level because the
component itself is the integrated ECU [KHJ07]. HiL testing requires real-time behav-](https://image.slidesharecdn.com/zanderdiss-130217192436-phpapp02/85/Zander-diss-49-320.jpg)
![26 2 FUNDAMENTALS
ior of the environment model to ensure that the communication with the ECU is the
same as in the real application.
− Car: Finally, the last integration level is obviously the car itself, as already mentioned.
The final ECU runs in the real car which can either be a sample or a car from the pro-
duction line. However, these tests, as performed only in late development phases, are
expensive and do not allow configuration parameters to be varied arbitrarily [LK08].
Hardware faults are difficult to trigger and the reaction of the SUT is often difficult to
observe because internal signals are no longer accessible [KHJ07]. For these reasons,
the number of in-car tests decreases while model-based testing gains more attention.
This thesis encompasses mainly the system design level so as to start testing as early as possible
in the development cycle. Thus, the MiL platform is researched in detail. The other platforms
are not excluded from the methodological viewpoint. However, the portability between differ-
ent execution platforms is beyond the scope of this work.
Test Reactiveness: A concept of test reactiveness emerges when test cases are dependent on
the system behavior. That is, the execution of a test case depends on what the system under test
is doing while being tested. In this sense the system under test and the test driver run in a
‘closed loop’.
In the following, before the test reactiveness will be elaborated in detail, the definition of open-
and closed-loop system configuration will be explicitly distinguished:
− Open-loop System Configuration: When testing a component in a so-called open-loop
the test object is tested directly without any environment or environmental model. This
kind of testing is reasonable if the behavior of the test object is described based on the
interaction directly at its interfaces (I/O ports). This configuration is applicable for SW
modules and implementation sub-models, as well as for control systems with discrete
I/O.
− Closed-loop System Configuration: For feedback control systems and for complex con-
trol systems it is necessary to integrate the SUT with a plant model so as to perform
closed-loop tests. In early phases where the interaction between SUT and plant model
is implemented in software (i.e., without digital or analog I/O, buses etc.) the plant
model does not have to ensure real-time constraints. However, when the HiL systems
are considered and the communication between the SUT and the plant model is imple-
mented via data buses, the plant model may include real hardware components (i.e.,
sensors and actuators). This applies especially when the physics of a system is very
crucial for the functionality or when it is too complex to be described in a model.
− Test Reactiveness: Reactive tests are tests that apply any signal or data derived from
the SUT outputs or test system itself to influence the signals fed into the SUT. With
this practice, the execution of reactive test cases varies depending on the SUT behav-
ior. The test reactiveness as such gives the test system a possibility to immediately re-
act to the incoming behavior by modifying the test according to the predefined deter-
ministic criteria. The precondition for achieving the test reactiveness is an online moni-
toring of the SUT, though. The advantages can be obtained in a number of test specifi-](https://image.slidesharecdn.com/zanderdiss-130217192436-phpapp02/85/Zander-diss-50-320.jpg)
![2 FUNDAMENTALS 27
cation steps (e.g., an automatic sequencing of test cases, online prioritizing of the test
cases).
For example, assume that the adaptive cruise control (ACC) activation should be
tested. It is possible to start the ACC only when a certain velocity level has been
reached. Hence, the precondition for a test case is the increase of the velocity from 0 up
to the point when the ACC may be activated. If the test system is able to detect this
point automatically, the ACC may be tested immediately.
Although the existing approaches support reactive testing by means of script lan-
guages, it is often difficult to understand the test evaluation part of such textually writ-
ten test cases.
A discussion about possible risks and open questions 11 around reactive tests can be
found in [Leh03].
In this work, both open- and closed-loop system configurations as well as reactive and non-
reactive tests will be regarded. The concept of test reactiveness and the ‘closed-loop’ between
the SUT and test system will be described in Section 5.6 and instantiated in Section 6.4.
Test Scope: Finally, the test scope has to be considered. Test scopes describe the granularity of
the SUT. Due to the composition of the system, tests at different scopes may reveal different
failures [ISTQB06, D-Mint08, Wey88]. Therefore, they are usually performed in the following
order:
− Component: At the scope of component testing, the smallest testable component (e.g.,
a class in an object-oriented implementation or a single ECU 12) is tested in isolation.
− Integration: The scope of integration test is to combine components with each other
and test those not yet as a whole system but as a subsystem (i.e., ACC system com-
posed of a speed controller, a distance controller, switches, and several processing
units). It exposes defects in the interfaces and in the interactions between integrated
components or systems [ISTQB06].
− System: In a system test, the complete system (i.e., a vehicle) consisting of subsystems
is tested. A complex embedded system is usually distributed; the single subsystems are
connected via buses using different data types and interfaces through which the system
can be accessed for testing [Het98].
This thesis encompasses the component level test, including both single component and compo-
nent in-the-loop test, and the integration level test.
11
The main risks are the following: The test might run in a different way than intended by the test designer. In that case, the
scenario of interest may not be checked at all. Also, by only slight adjustments of the SUT, the execution flow of a test
case may change considerably. A possible solution to these problems would be to introduce monitoring means watching
the test execution.
12
For the purpose of this thesis, the component test scope includes both component testing and component in-the-loop test-
ing. The former applies to a single ECU (e.g., open-loop ECU) testing, the latter holds for a test of an ECU configured to-
gether with a plant to form a loop (e.g., closed-loop ECU connected to the car model).](https://image.slidesharecdn.com/zanderdiss-130217192436-phpapp02/85/Zander-diss-51-320.jpg)
![28 2 FUNDAMENTALS
2.3.3 Requirements on Embedded Systems Testing within Automotive
Along with the growing functionality of embedded systems in the automotive and the introduc-
tion of model-based development processes, the demands on QA have also increased [LK08].
The QA activities should be systematic, well structured, repeatable, understandable, and possi-
bly automatic. It is a challenge not only because of the time pressure, but also due to the soft-
ware distribution, its reactive, hybrid nature, and the development process to be obeyed.
Model-based development enables system engineers to test the system in a virtual environment
when they are inexpensive. In practice there are just a few testing procedures that address the
automotive domain-specific requirements of model-based testing sufficiently [LK08]. As an
example, despite the past few years’ intensive efforts of automobile manufacturers and their
suppliers to enhance the QA of their products, the problems of testing steadily increase in com-
plexity and interconnectedness are still not solved. The variety of proprietary test systems and
solutions do not allow an integrated definition, transfer, re-use, and execution of tests for auto-
mobile manufacturers, suppliers, and test equipment manufacturers [SG07]. The reason of this
state lies in the historical data. About 15 – 20 years ago there was no need for dedicated func-
tional testing methods because the functional complexity was comparatively low and limited
mainly to hardware. With the increasing popularity of MBD the engineering discipline of
automotive model-based testing has been neglected for a long time [LK08].
The main problems recognized within the existing test solutions encompass the following is-
sues. Only manual test data specification is supported, so that the process of their selection is
long and costly. If an automatic generation of test data is possible, then it is based almost only
on the criteria resulting from the internal SUT structure. As a consequence, the produced test
data are not systematic enough for functional testing. Regarding the test evaluation, entire ref-
erence signal flows are needed for the assessment, which are however not available at the early
stage of the software development. Only several test patterns exist what implicates the test en-
gineer to start every test project almost from scratch. The entire test specification process is still
almost purely manual and no interaction is supported. The issues listed herewith will be dis-
cussed in detail based on the concrete test realizations in Sections 3.3 – 3.4.
Hence, new test methodologies should emerge as soon as possible. They should suit the current
MBD process and lead to a common understanding of model-based testing concepts. They must
enable the testing of the time constraints, discrete and continuous signals as well as their rela-
tions. Also, assessment of the expected system behavior should be possible and the reusability
of the test specification elements (e.g., in the form of patterns [TYZ05] or libraries) is of high
importance.
In particular, the test system should enable the specication and preprocessing of the signals pre-
sent on the buses including their cycle times in millisecond ranges. The description of signals
should proceed on an abstract level. Thus, in this thesis the signal properties (i.e., features con-
strained with selected predicates) are considered. The timing relations between properties re-
garding a single signal or a number of signals must be captured. The local and global time con-
cepts are needed. Also, the possibility to define closed-loop tests, called reactive tests [Leh03],
is of high importance. The test system should be able to react to events, states, or signal proper-
ties in deterministic time (e.g., in real time at hardware level). Watchdog-similar solutions must
be applied to diagnose the SUT behavior on the fly. Synchronization of the applied/obtained
signals or the test system with the SUT is needed. The specification of the test cases as well as
the measurement of events, states, or signal properties need to be time dependent. The test data](https://image.slidesharecdn.com/zanderdiss-130217192436-phpapp02/85/Zander-diss-52-320.jpg)
![2 FUNDAMENTALS 29
and their variants should be treated externally. The test evaluation and assessment of the signals
should be adjusted to the time concepts, traced, and logged. Even the distribution or a parallel
execution of the tests is not out of consideration.
Standard test specification algorithms (e.g., loops for test flow specification, test control for test
cases ordering, sleeping or waiting of the test system, test configuration parameterization, or
arbitration mechanism) should obviously be supported. Further on, the functional test specifica-
tion should be split from the concrete SUT implementation by application of test adapters. Be-
sides, an integrated and manufacturer independent test technology is aimed at. Clear relation
between the test specification elements and the test objectives should be supported too.
The next important issue is to provide a testing technology which is understandable to a number
of stakeholders interested in the development of embedded systems. Hence, a graphical format
for the test specification and the implicated model-based testing [BJK+05, UPL06] is de-
manded. Finally, the quality of the resulting test methodology has to be measured and improved
if needed.
The advantages and limitations of the existing test approaches dealing respectively with the set
of requirements listed above will be exhaustively discussed in Chapter 3, in particular in Sec-
tion 3.3.
2.3.4 Definition and Goals of Model-based Testing
Model-based testing (MBT) relates to a process of test generation from an SUT model by appli-
cation of a number of sophisticated methods. MBT is the automation of black-box test design
[UL06]. Several authors [Utt05, KHJ07] define MBT as testing in which test cases are derived
in whole or in part from a model that describes some aspects of the SUT based on selected cri-
teria. [Dai06] denotes MBT into model-driven testing (MDT) since she proposes the approach
in the context of Model Driven Architecture (MDA). [UPL06] add that MBT inherits the com-
plexity of the domain or, more particularly, of the related domain models.
MBT allows tests to be linked directly to the SUT requirements, makes readability, understand-
ability and maintainability of tests easier. It helps to ensure a repeatable and scientific basis for
testing and it may give good coverage of all the behaviors of the SUT [Utt05]. Finally, it is a
way to reduce the efforts and cost for testing [PPW+05].
The term MBT is widely used today with slightly different meanings. Surveys on different MBT
approaches are given in [BJK+05, Utt05, UL06, UPL06, D-Mint08]. In the automotive industry
MBT is used to describe all testing activities in the context of MBD [CFS04, LK08]. [Rau02,
LBE+04, Con04a, Con04b] define MBT as a test process that encompasses a combination of
different test methods which utilize the executable model as a source of information. Thus, the
automotive viewpoint on MBT is rather process-oriented. A single testing technique is not
enough to provide an expected level of test coverage. Hence, different test methods should be
combined to complement each other relating to all the specified test dimensions (e.g., func-
tional and structural testing techniques should be combined). If sufficient test coverage has
been achieved on model level, the test cases can be reused for testing the control software gen-
erated from the model and the control unit within the framework of back-to-back tests
[WCF02]. With this practice, the functional equivalence between executable model, code and
ECUs can be verified and validated [CFS04].](https://image.slidesharecdn.com/zanderdiss-130217192436-phpapp02/85/Zander-diss-53-320.jpg)
![30 2 FUNDAMENTALS
For the purpose of this thesis, the following understanding of MBT is used:
Model-based testing is testing in which the entire test specification is derived in whole or in
part from both the system requirements and a model that describe selected functional aspects of
the SUT. In this context, the term entire test specification covers the abstract test scenarios
substantiated with the concrete sets of test data and the expected SUT outputs. It is organized in
a set of test cases.
Further on, the resulting test specification is executed together with the SUT model so as to
provide the test results. In [Con04a, CFS04] no additional models are being created for test
purposes, but the already existent functional system models are utilized for the test. In the test
approach proposed in this thesis (see Chapters 4 – 5) the system models are exploited too. In
addition, however, a test specification model (also called test case specification, test model, or
test design in the literature [Pre03b, ZDS+05, Dai06]) is created semi-automatically. Concrete
test data variants are derived automatically from it.
Moreover, since the MBT approaches have to be integrated into the existing development proc-
esses and combined with the existing methods and tools, in this thesis ML/SL/SF has been se-
lected as both system and test modeling framework and execution platform. By that, MBD and
MBT are supported using the same environment.
2.3.5 Patterns
The concept of patterns emerges when software reusability is targeted. A pattern is a general
solution to a specific recurring design problem. It explains the insight and good practices that
have evolved to solve a problem. It provides a concise definition of common elements, context,
and essential requirements for a solution as discussed in [Ale79, VS04, Neu04, PTD05]. Pat-
terns were first used to describe constellations of structural elements in buildings and towns
[Ale79].
The purpose of software patterns is to capture software design know-how and make it reusable.
They can enhance the structure of software and simplify its maintenance. Patterns also improve
communication among software developers and empower less experienced engineers to pro-
duce high-quality results. They contribute the efficiency due to a common and understandable
vocabulary for problem solutions that they provide [Neu04].
Similarly to the manner software patterns contribute to the software development process, test
patterns enhance progress in testing. Test patterns [VS04] represent a form of reuse in test de-
velopment in which the essences of solutions and experiences gathered in testing are extracted
and documented so as to enable their application in similar contexts that might arise in the fu-
ture. Test patterns aim at capturing test design knowledge from past projects in a canonical
form, so that future projects would benefit from it.
2.4 Summary
The first aim of this chapter was to discuss the backgrounds of embedded systems and their
development. Herein, the details on their different aspects have been presented. Further on,](https://image.slidesharecdn.com/zanderdiss-130217192436-phpapp02/85/Zander-diss-54-320.jpg)
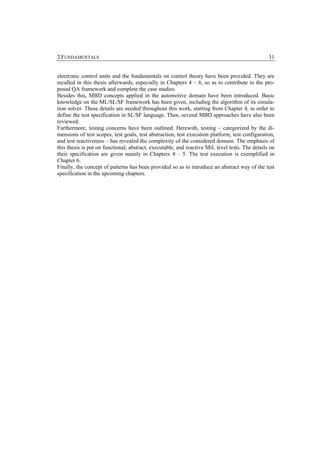
![3 Selected Test Approaches
“Contradiction is not a sign of falsity,
nor the lack of contradiction a sign of truth.“
- Blaise Pascal
This chapter reviews related work on the model-based testing (MBT) of embedded, hybrid real-
time systems. Firstly, in Section 3.1, an overview of taxonomy for MBT, introduced initially by
[UPL06], is analyzed and extended for the needs of the considered domain. Further on, con-
straints on nature of the embedded system models are explicitly given. Afterwards, the particu-
lar categories of the taxonomy are discussed in detail. These relate to test generation, test exe-
cution, and test evaluation.
In Section 3.2, a short report on the current test trends recognized in the automotive domain is
outlined. Then, in Section 3.3, a trapezoid narrowing the range of MBT approaches is formed.
It is derived based on the analysis of the test dimensions given in Section 2.3.1 and the test
categories of the MBT taxonomy. Several test approaches are selected for further analysis. Fi-
nally, a comparison of the selected solutions is provided and their challenges and limitations are
pointed out.
A comprehensive list of the corresponding test tools available in the academia or industry is
presented in Appendix A. Moreover, a brief description of the test method proposed in this the-
sis is given. Finally, conclusions are taken. A summary completes the chapter.
3.1 Categories of Model-based Testing
In [UPL06, UL06] a comprehensive taxonomy for MBT identifying its three general classes:
model, test generation, and test execution is provided. Each of the classes is divided into further
categories. The model-related ones are subject, independence, characteristics, and paradigm.
Further on, the test generation is split into test selection criteria and technology, whereas the
test execution partitions into execution options.
In the following work, the taxonomy is enriched with an additional class, called test evaluation.
The test evaluation means comparing the actual system under test (SUT) outputs with the ex-
pected SUT behavior based on a test oracle. Test oracle enables a decision to be made as to
whether the actual SUT outputs are correct. It is, apart from the data, a crucial part of a test
case. The test evaluation is divided into two categories: specification and technology.](https://image.slidesharecdn.com/zanderdiss-130217192436-phpapp02/85/Zander-diss-56-320.jpg)
![3 SELECTED TEST APPROACHES 33
Furthermore, in this thesis only one selected class of the system model is investigated. For clari-
fication purposes, its short description based on the options available in the taxonomy of
[UPL06, UL06] will be given. The subject is the model (e.g., Simulink/Stateflow (SL/SF)
model) that specifies the intended behavior of the SUT and its environment, often connected via
a feedback loop. Regarding the independence level this model can be generally used for both
test case 13 and code generation. Indicating the model characteristics, it provides deterministic
hybrid behavior constrained by timed events, including continuous functions and various data
types. Finally, the modeling paradigm combines a history-based, functional data flow paradigm
(e.g., SL function blocks) with a transition-based notation (e.g., SF charts).
The overview of the resulting, slightly modified and extended MBT taxonomy is illustrated in
Figure 3.1. The modification results from the focus of this thesis, which is put on embedded
systems. All the categories are split into further instances which influence each other within a
given category or between them. The notion of ‘A/B/C’ at the leaves indicates mutually exclu-
sive options, while the straight lines link further instantiations of a given dimension without
exclusion. It is a good practice since, for example, applying more than one test selection crite-
rion and by that, more generation technologies can provide a better test coverage, eventually.
13
In the test approach proposed in this thesis (see Chapter 4), firstly, a test specification model is created semi-automatically
and then the test data variants forming the test cases are derived automatically out of the test model.](https://image.slidesharecdn.com/zanderdiss-130217192436-phpapp02/85/Zander-diss-57-320.jpg)
![34 3 SELECTED TEST APPROACHES
Classes: Categories: Options:
Model +
Structural Model Coverage
Data Coverage
Test Selection Requirements Coverage
Criteria Test Case Specifications
Random and Stochastic
Test Fault-Based
Generation Automatic / Manual
Random Generation
Graph Search Algorithms
Technology Model-checking
Symbolic Execution
Theorem Proving
Online / Offline
Execution MiL / SiL / HiL / PiL
Test Execution
Options Reactive / Non-reactive
Reference Signal-Feature – based
Reference Signal-based
Specification
Requirements Coverage
Test Evaluation Specifications
Test
Evaluation
Automatic / Manual
Technology
Online / Offline
Figure 3.1: Overview of the Taxonomy for Model-based Testing.
In the next three sections the classes of the MBT taxonomy are referred to and the particular
categories and options are explained in depth. The descriptions of the most important options
following in this thesis contain examples of their realization, respectively.
3.1.1 Test Generation
The process of test generation starts from the system requirements, taking into account the test
objectives. It is defined in a given test context and leads to the creation of test cases. A number
of approaches exist depending on the test selection criteria and generation technology. They are
reviewed below.
Test selection criteria: Test selection criteria define the facilities that are used to control the
generation of tests. They help to specify the tests and do not depend on the SUT code [UL06].
In the following, the most commonly-used criteria are investigated. Referring to the discussion
given in Section 2.4.4, different test methods should be combined to complement each other so](https://image.slidesharecdn.com/zanderdiss-130217192436-phpapp02/85/Zander-diss-58-320.jpg)
![3 SELECTED TEST APPROACHES 35
as to achieve the best test coverage. Hence, there is no best suitable criterion for generating the
test specification.
− Structural model coverage criteria: These exploit the structure of the model to select
the test cases. They deal with coverage of the control-flow through the model, based on
ideas from control-flow through code.
In [Pre03] it is shown how test cases can be generated that satisfy the Modified Condi-
tion/Decision Coverage (MC/DC) coverage criterion. The idea is to first generate a set
of test case specifications that enforce certain variable valuations and then generate test
cases for them.
Similarly, Safety Test Builder (STB) [STB] or Reactis Tester [ReactT, SD07] generate
test sequences covering a set of SF test objectives (e.g., transitions, states, junctions,
actions, MC/DC coverage) and a set of SL test objectives (e.g., boolean flow, look-up
tables, conditional subsystems coverage) (see Section 3.3 for more detail).
− Data coverage criteria: The idea is to split the data range into equivalence classes and
select one representative from each class. This partitioning is usually complemented by
the boundary value analysis [KLP+04], where the critical limits of the data ranges or
boundaries determined by constraints are additionally selected.
An example is the MATLAB Automated Testing Tool (MATT) [MATT] enabling
black-box testing of SL models and code generated from it by Real-Time Workshop®.
It generally enables the creation of custom test data for model simulations by setting
their types for each input. Further on, accuracy, constant, minimum, and maximum
values can be provided to generate the test data matrix.
Another realization of this criterion is provided by Classification Tree Editor for Em-
bedded Systems (CTE/ES) [CTE] implementing the Classification Tree Method
(CTM) [GG93, Con04a]. The SUT inputs form the classifications in the roots of the
tree. Then, the input ranges are divided into classes according to the equivalence parti-
tioning method. The test cases are specified by selecting leaves of the tree in the com-
bination table. A line in the table specifies a test case. CTE/ES provides a way of find-
ing test cases systematically. It breaks the test scenario design process down into steps.
Additionally, the test scenario is visualized in a graphical user interface (GUI).
− Requirements coverage criteria: These aim to cover all the informal SUT require-
ments. Traceability of the SUT requirements to the system or test model/code can sup-
port the realization of this criterion. It is targeted by almost every test approach.
− Test case specifications: When the test engineer defines a test case specification in
some formal notation, these can be used to determine which tests will be generated. It
is explicitly decided which set of test objectives should be covered. The notation used
to express these objectives may be the same as the notation used for the model
[UPL06]. Notations commonly used for test objectives include FSMs, UML Testing
Profile (UTP) [UTP], regular expressions, temporal logic formulas, constraints, and
Markov chains (for expressing intended usage patterns).
A prominent example of applying this criterion is described in [Dai06], where the test
case specifications are retrieved from UML® models and transformed into executable
tests in Testing and Test Control Notation, version 3 (TTCN-3) [ETSI07] by using](https://image.slidesharecdn.com/zanderdiss-130217192436-phpapp02/85/Zander-diss-59-320.jpg)
![36 3 SELECTED TEST APPROACHES
Model Driven Architecture (MDA) [MDA] methods [ZDS+05]. The work of [Pre03,
Pre04] is also based on this criterion (see symbolic execution in the next paragraph).
− Random and stochastic criteria: These are mostly applicable to environment models,
because it is the environment that determines the usage patterns of the SUT. A typical
approach is to use a Markov chain to specify the expected SUT usage profile. Another
example is to use a statistical usage model in addition to the behavioral model of the
SUT [CLP08]. The statistical model acts as the selection criterion and chooses the
paths, while the behavioral model is used to generate the oracle for those paths.
Exemplifying, Markov Test Logic (MaTeLo) [MaTL] can generate test suites according
to several algorithms. Each of them optimizes the test effort according to the objectives
such as boundary values, functional coverage, and reliability level. Test cases are gen-
erated in XML/HTML format for manual execution or in TTCN-3 for automatic exe-
cution [DF03].
Another instance, Java Usage Model Builder Library (JUMBL) [JUMB] can generate test
cases either as a collection of test cases which cover the model with the minimum cost
or by random sampling with replacement, or in order by probability, or by interleaving
the events of other test cases. There is also an interactive test case editor for creating
test cases by hand.
− Fault-based criteria: These rely on knowledge of typically occurring faults, often de-
signed in the form of a fault model.
Test generation technology: One of the most appealing characteristics of model-based testing
is its potential for automation. The automated generation of test cases usually necessitates the
existence of kind of test case specifications [UPL06].
− Automatic/Manual technology: Automatic test generation refers to the situation when
the test cases are generated automatically from the information source based on the
given criteria. Manual test generation refers to the situation when the test cases are
produced by hand.
− Random generation: Random generation of tests is done by sampling the input space
of a system. It is easy to implement, but it takes a long time to reach a certain satisfying
level of model coverage as [Gut99] reports.
− Graph search algorithms: Dedicated graph search algorithms include node or arc cov-
erage algorithms such as the Chinese Postman algorithm 14, which covers each arc at
least once. For transition-based models, which use explicit graphs containing nodes
and arcs, there are many graph coverage criteria that can be used to control test genera-
tion. The commonly used are all nodes, all transitions, all transition pairs, and all cy-
cles. The method is exemplified by [LY94], additionally based on structural coverage
of FSM models.
14
Chinese Postman algorithm, http://www.uclic.ucl.ac.uk/harold/cpp/ [04/20/08].](https://image.slidesharecdn.com/zanderdiss-130217192436-phpapp02/85/Zander-diss-60-320.jpg)
![3 SELECTED TEST APPROACHES 37
− Model checking: Model checking is a technology for verifying or falsifying properties
of a system. A property typically expresses an unwanted situation. The model checker
verifies whether this situation is reachable or not. It can yield counter examples when a
property is not satisfied. If no counter example is found, then the property is proven
and the situation has never been reached. Such a mechanism is implemented in
CheckMate [ChM, SRK+00], Safety Checker Blockset (SCB) [SCB], or in Embedded-
Validator [EmbV].
The general idea of test case generation with model checkers is to first formulate test
case specifications as reachability properties, for instance, “eventually, a certain state is
reached or a certain transition fires”. A model checker then yields traces that reach the
given state or that eventually make the transition fire. Other variants use mutations of
models or properties to generate test suites.
− Symbolic execution: The idea of symbolic execution is to run an executable model not
with single input values but with sets of input values instead [MA00]. These are repre-
sented as constraints. With this practice, symbolic traces are generated. By instantiation
of these traces with concrete values the test cases are derived. Symbolic execution is
guided by test case specifications. These are given as explicit constraints and symbolic
execution may be done randomly by respecting these constraints.
In [Pre03b] an approach to test case generation with symbolic execution on the back-
grounds of Constraint Logic Programming (CLP), initially transformed from the Auto-
Focus models [AuFo], is provided. [Pre03b, Pre04] concludes that test case generation
for both functional and structural test case specifications limits to finding states in the
model’s state space. Then, the aim of symbolic execution of a model is then to find a
trace representing a test case that leads to the specified state.
− Theorem proving: Usually theorem provers are used to check the satisfiability of for-
mulas that directly occur in the models. One variant is similar to the use of model
checkers where a theorem prover replaces the model checker.
The technique applied in Simulink® Design Verifier™ (SL DV) [SLDV] uses mathe-
matical procedures to search through the possible execution paths of the model so as to
find test cases and counter examples.
− Online/Offline generation technology: With online test generation, algorithms can react
to the actual outputs of the SUT during the test execution. This idea is used for imple-
menting the reactive tests too.
Offline testing means that test cases are generated before they are run. A set of test
cases is generated once and can be executed many times. Also, the test generation and
test execution can be performed on different machines, levels of abstractions, or in dif-
ferent environments. Finally, if the test generation process is slower than test execu-
tion, then there are obvious advantages to doing the test generation phase only once.
3.1.2 Test Execution
The test execution options in the context of this thesis have been already described in Section
2.4.2. Hence, in the following only reactive testing and the related work on the reactive/non-
reactive option is reviewed.](https://image.slidesharecdn.com/zanderdiss-130217192436-phpapp02/85/Zander-diss-61-320.jpg)
![38 3 SELECTED TEST APPROACHES
Execution options: Execution options refer to the execution of a test.
− Reactive/Non-reactive execution: Reactive tests are tests that apply any signal or data
derived from the SUT outputs or test system itself to influence the signals fed into the
SUT. Then the execution of reactive test cases varies depending on the SUT behavior,
in contrast to the non-reactive test execution, where the SUT does not influence the test
at all.
Reactive tests can be implemented within AutomationDesk [AutD]. Such tests react to
changes in model variables within one simulation step. The scripts run on the proces-
sor of the HiL system in real time, synchronously to the model.
The Reactive Test Bench [WTB] allows for specification of single timing diagram test
benches that react to the user's Hardware Description Language (HDL) design files.
Markers are placed in the timing diagram so that the SUT activity is recognized.
Markers can also be used to call user-written HDL functions and tasks within a dia-
gram.
[DS02] conclude that a dynamic test generator and checker are more effective in creat-
ing reactive test sequences. They are also more efficient because errors can be detected
as they happen. Resigning from the reactive testing methods, a simulation may run for
a few hours only to find out during the post-process checking that an error occurred a
few minutes after the simulation start.
In [JJR05], in addition to checking the conformance of the implementation under test
(IUT), the goal of the test case is to guide the parallel execution towards satisfaction of
a test purpose. Due to that feature, the test execution can be seen as a game between
two programs: the test case and the IUT. The test case wins if it succeeds in realizing
one of the scenarios specified by the test purpose; the IUT wins if the execution cannot
realize any test objective. The game may be played offline or online [JJR05].
3.1.3 Test Evaluation
The test evaluation, also called the test assessment, is the process that exploits the test oracle. It
is a mechanism for analyzing the SUT output and deciding about the test result. As already dis-
cussed before, the actual SUT results are compared with the expected ones and a verdict is as-
signed. An oracle may be the existing system, test specification, or an individual’s specialized
knowledge. The test evaluation is treated explicitly in this thesis since herewith a new concept
for the test evaluation is proposed.
Specification: Specification of the test assessment algorithms may be based on different foun-
dations that cover some criteria. It usually forms a kind of model or a set of ordered reference
signals/data assigned to specific scenarios. Considering continuous signals the division into
reference-based and reference signal-feature – based evaluation becomes particularly important:
− Reference signal-based specification: Test evaluation based on reference signals as-
sesses the SUT behavior comparing the SUT outcomes with the previously specified
references.
An example of such an evaluation approach is realized in the MTest [MTest, Con04a]
or SystemTest™ [STest]. The reference signals can be defined using a signal editor or
they can be obtained as a result of a simulation. Similarly, test results of back-to-back
tests can be analyzed with the help of MEval [MEval, WCF02].](https://image.slidesharecdn.com/zanderdiss-130217192436-phpapp02/85/Zander-diss-62-320.jpg)
![3 SELECTED TEST APPROACHES 39
− Reference signal-feature – based specification: Test evaluation based on reference sig-
nal feature 15 assesses the SUT behavior comparing the SUT outcomes partitioned into
features with the previously specified reference values for those features.
Such an approach to test evaluation is supported in the Time Partitioning Test (TPT)
[TPT, Leh03, LKK+06]. It is based on the script language Python extended with some
syntactic test evaluation functions. By that, the test assessment can be flexibly de-
signed and allows for dedicated complex algorithms and filters to be applied to the re-
corded test signals. A library containing complex evaluation functions is available.
− Requirements coverage criteria: Similar to the case of test data generation, they aim to
cover all the informal SUT requirements, but this time with respect to the expected
SUT behavior (i.e., regarding the test evaluation scenarios) specified there. Traceability
of the SUT requirements to the test model/code can support the realization of this crite-
rion.
− Test evaluation specifications: This criterion refers to the specification of the outputs
expected from the SUT after the test case execution. Already authors of [ROT98] de-
scribe several approaches to specification-based test selection and build them up on the
concept of test oracle, faults and failures. When the test engineer defines test scenarios
in some formal notation, these can be used to determine how, when and which tests
will be evaluated.
Technology: The technology of the test assessment specification enable an automatic or man-
ual process, whereas the execution of the test evaluation occurs online or offline.
− Automatic/Manual technology: The option can be understood twofold, either from the
perspective of the test evaluation definition, or its execution. Regarding the specifica-
tion of the test evaluation, when the expected SUT outputs are defined by hand, then it
is a manual test specification process. In contrast, when they are derived automatically
(e.g., from the behavioral model), then the test evaluation based on the test oracle oc-
curs automatically. Usually, the expected reference signals/data are defined manually;
however, they may be facilitated by parameterized test patterns application.
The activity of test assessment itself can be done manually or automatically.
Manual specification of the test evaluation means is supported in Simulink® Verifica-
tion and Validation™ (SL VV) [SLVV], where the predefined assertion blocks can be
assigned to the test signals defined in the Signal Builder block in SL. With this prac-
tice, functional requirements can be verified during model simulation. The evaluation
itself then occurs automatically.
15
A signal feature (called also signal property in [GW07, SG07, GSW08]) is a formal description of certain defined attribu-
tes of a signal. In other words, it is an identifiable, descriptive property of a signal. It can be used to describe particular
shapes of individual signals by providing means to address abstract characteristics of a signal. Giving some examples: in-
crease, step response characteristics, step, maximum etc. are considerable signal features [ZSM06, GW07, SG07, GSW08,
ZXS08]. A feature can be predicated by other features. Generally, predicates on signals (or on signal features), temporal
fragmentation of the signal or temporal relation between more than one signal (or signal feature) are distinguished. This
definition will be extended and clarified in Section 4.1.](https://image.slidesharecdn.com/zanderdiss-130217192436-phpapp02/85/Zander-diss-63-320.jpg)
![40 3 SELECTED TEST APPROACHES
The tests developed in SystemTest exercise MATLAB (ML) algorithms and SL mod-
els. The tool includes predefined test elements to build and maintain standard test rou-
tines. Test cases, including test assessment, can be specified manually at a low abstrac-
tion level. A set of automatic evaluation means exists and the comparison of obtained
signals with the reference ones is done automatically.
− Online/Offline execution of the test evaluation: The online (i.e., on the fly) test evalua-
tion happens already during the SUT execution. Online test evaluation enables the con-
cept of test control and test reactiveness to be extended. Offline means the opposite.
Hence, the test evaluation happens after the SUT execution.
Watchdogs defined in [CH98] enable online test evaluation. It is also possible when
using TTCN-3. TPT [Leh03] means for online test assessment are limited and are used
as watchdogs for extracting any necessary information for making test cases reactive.
The offline evaluation is more sophisticated in TPT.
Tools realizing the selected test approaches can be classified according to the criteria listed in
the MBT taxonomy. A comprehensive list of the MBT tools from academia and industry is also
provided in Appendix A. In Section 3.3 a short description of the automotive trends is reported
and in Section 3.4 the comparison of test approaches is analyzed.
3.2 Automotive Practice and Trends
Established test tools from, e.g., dSPACE GmbH [dSP], Vector Informatik GmbH [VecI],
MBTech Group [MBG] etc. are highly specialized for the automotive domain and usually come
together with a test scripting approach which is directly integrated to the respective test device.
All these test definitions pertain to a particular test device and by that not portable to other plat-
forms and not exchangeable.
Recently, the application of model-based specifications in development enables more effective
and automated process reaching a higher level of abstraction.
Thereby, model-based testing and platform-independent approaches have been developed such
as CTE/ES [Con04a], MTest, and TPT [Leh03]. As already mentioned CTE/ES supports the
CTM with partition tests according to structural or data-oriented differences of the system to be
tested. It also enables the definition of sequences of test steps in combination with the signal
flows and their changes along the test. Because of its ease of use, graphical presentation of the
test structure, and the ability to generate all possible combination of tests, it is widely used in
the automotive domain. Integrated with the MTest, test execution, test evaluation, and test man-
agement become possible. After the execution, SUT output signals can be compared with pre-
viously obtained reference signals. MTest has, however, only limited means to express test be-
haviors which go beyond simple sequences, but are typical for control systems. The test evalua-
tion bases only on the reference signals which are often not yet available at the early develop-
ment phase yet and the process of test development is fully manual.
TPT addresses some of these problems. It uses an automaton-based approach to model the test
behavior and associates with the states pre- and post-conditions on the properties of the tested
system (including the continuous signals) and on the timing. In addition, a dedicated run-time
environment enables the execution of the tests. The test evaluation is based on a more sophisti-
cated concept of signal feature. However, the specification of the evaluation happens in Python](https://image.slidesharecdn.com/zanderdiss-130217192436-phpapp02/85/Zander-diss-64-320.jpg)
![3 SELECTED TEST APPROACHES 41
language, without any graphical support. TPT is a dedicated test technology for embedded sys-
tems controlled by and acting on continuous signals, but the entire test process is manual and
difficult to learn.
Current research work aims at designing a new platform-independent test specification lan-
guage, one of the branches called TTCN-3 continuous 16 [SBG06, BKL07, SG07, GSW08]. Its
fundamental idea is to obtain a domain-specific test language, which is executable and unifies
tests of communicating, software-based systems in all of the automotive subdomains (e.g.,
telematics, power train, body electronics, etc.) integrating the test infrastructure as well as the
definition, and documentation of tests. It should keep the whole development and test process
efficient and manageable. It must address the subjects of test exchange, autonomy of infrastruc-
ture, methods and platforms, and the reuse of tests.
TTCN-3 has the potential to serve as a testing middleware. It provides concepts of local and
distributed testing. A test solution based on this language can be adapted to concrete testing
environments. However, while the testing of discrete controls is well understood and available
in TTCN-3, concepts for specification-based testing of continuous controls and for the relation
between discrete and the continuous system parts are still under ongoing research [SBG06,
SG07, GSW08].
This option becomes interesting, especially in the context of a new paradigm – AUTomotive
Open System Architecture (AUTOSAR) 17 that has been observed as an automotive develop-
ment trend for the last few years. Traditional TTCN-3 is already in use to test discrete interac-
tions within this architecture. The remaining hybrid or continuous behavior could be tested with
TTCN-3 embedded.
Another graphical test specification language being already in the development stage is UML
Testing Profile for Embedded Systems [DM_D07, D-Mint08, Liu08]. Its backgrounds root
from UTP, TPT, and Model-in-the-Loop for Embedded System Test, abbreviated as MiLEST
(the approach proposed in this thesis). These are coordinated and synchronized with the con-
cepts of TTCN-3 embedded too.
Apart from the tools commonly known in the automotive industry, further approaches exist and
are applied for testing the embedded systems. Referring to the constraints 18 on the topic of this
thesis, a further comprehensive analysis is done in the upcoming section.
3.3 Analysis and Comparison of the Selected Test Approaches
In the following, numerous test approaches are analyzed. Firstly, several, randomly selected
academic achievements on testing embedded systems are considered, in general. Then, the test
16
The resulting profile will be called TTCN-3 embedded, http://www.temea.org/ [04/22/08].
17
AUTOSAR is an open and standardized automotive software architecture, jointly developed by automobile manufacturers,
suppliers and tool developers. AUTOSAR Consortium, http://www.autosar.org [04/22/08].
18
The emphasis of this thesis is put on functional, abstract, executable and reactive MiL level tests of hybrid embedded sys-
tems (see also Section 2.4).](https://image.slidesharecdn.com/zanderdiss-130217192436-phpapp02/85/Zander-diss-65-320.jpg)
![42 3 SELECTED TEST APPROACHES
methods restricted by a concrete set of criteria (cf. Figure 3.2) and applied in the industry are
compared.
3.3.1 Analysis of the Academic Achievements
The approach, of which the realization is called Testing-UPPAAL [MLN03], presents a frame-
work, a set of algorithms, and a tool for the testing of real-time systems based on symbolic
techniques used in the UPPAAL model checker. The timed automata network model is ex-
tended to a test specification. This one is used to generate test primitives and to check the cor-
rectness of system responses. Then, the retrieved timed traces are applied so as to derive a test
verdict. Here, online manipulation of test data is an advantage and this concept is partially re-
used in MiLEST (cf. test reactiveness on the test data level in Section 5.5.1). After all, the state-
space explosion problem experienced by many offline test generation tools is reduced since
only a limited part of the state space needs to be stored at any point in time. The algorithms use
symbolic techniques derived from model checking to efficiently represent and operate on infi-
nite state sets. The implementation of the concept shows that the performance of the computa-
tion mechanisms is fast enough for many realistic real-time systems [MLN03]. However, the
approach does not deal with the hybrid nature of the system at all.
Similar as in MiLEST the authors of [BKB05] consider that a given test case must address a
specific goal, which is related to a specific requirement. The proposed approach computes one
test case for one specific requirement. This strategy avoids handling the whole specification at
once, which reduces the computation complexity. However, here again, the authors focus on
testing the timing constraints only, leaving the hybrid behavior testing open.
The authors of [CLP08] use two distinct, but complementary, concepts of sequence-based
specification (SBS) and statistical testing. The system model and the test model for test case
generation are distinguished, similar as in MiLEST. The system model is the black-box specifi-
cation of the software system resulting from the SBS process. The test model is the usage
model that models the environment producing stimuli for the software system as a result of a
stochastic process. The framework proposed in this approach automatically creates Markov
chain test models from specifications of the control model (i.e., SF design). The test cases with
an oracle are built and statistical results are analyzed. Here, the formerly mentioned JUMBL
methods are applied [Pro03]. Statistics are used as a means for planning the tests and isolating
errors with propagating characteristics. The main shortcoming of this work is that mainly SF
models are analyzed, leaving the considerable part of continuous behavior open (i.e., realized in
SL design). This is not sufficient for testing the entire functionality of the systems considered in
this thesis.
In contrast, the authors of [PHPS03] present an approach to generating test cases for hybrid
systems automatically. These test cases can be used both for validating models and verifying
the respective systems. This method seems to be promising, although as a source of test infor-
mation two types of system models are used: a hybrid one and its abstracted version in the form
of a discrete one. This practice may be very difficult when dealing with the continuous behavior
described purely in SL.
The authors of [PPW+05] evaluate the efficiency of different MBT techniques. They apply the
automotive network controller case study to assess different test suites in terms of error detec-
tion, model coverage, and implementation coverage. Here, the comparison between manually or](https://image.slidesharecdn.com/zanderdiss-130217192436-phpapp02/85/Zander-diss-66-320.jpg)
![3 SELECTED TEST APPROACHES 43
automatically generated test suites both with and without models, at random or with dedicated
functional test selection criteria is aimed at. As a result, the test suites retrieved from models,
both automatically and manually, detect significantly more requirements errors than hand-
crafted test suites derived only from the requirements. The number of detected programming
errors does not depend on the use of models. Automatically generated tests find as many errors
as those defined manually. A sixfold increase in the number of model-based tests leads to an
11% increase [PPW+05] in detected errors.
Algorithmic testbench generation (ATG) technology [Ole07], though commercially available, is
an interesting approach since here the test specification is based on the rule sets. These rule sets
show that the high-level testing activities can be performed as a series of lower-level actions.
By that, an abstraction level is introduced. This hierarchical concept is also used in MiLEST
while designing the test system. ATG supports some aspects of test reactiveness, similar to
MiLEST, and includes metrics for measuring the quality of the generated testbench specifica-
tion. Finally, it reveals cost and time reduction while increasing the quality of the SUT as
claimed in [Ole07].
3.3.2 Comparison of the Test Approaches Applied in the Industry
Based on the analysis of the test dimensions given in Section 2.4.1 and the test categories of the
MBT taxonomy (see Section 3.2) a trapezoid shown in Figure 3.2 is derived. It narrows the
range of the test approaches that are compared in the further part of this section in detail.
of the considerable test approaches.
Dynamic tests considered.
Criteria narrowing the range
ML/SL/SF model as an abstract SUT.
Focus on the functional tests.
The SUT model (MiL) tested in the first place,
though SiL/HiL/PiL not excluded.
Praxis relevance in the automotive domain.
Figure 3.2: Trapezoid Selecting the Range of the Test Approaches.
Firstly, in this thesis only dynamic tests are considered, leaving the static reviews open. Several
researches on static testing are to be found in [AKR+06, ALS+07, SDG+07, FD07]. Further on,
only the class of models defined in Section 3.2 is investigated. ML/SL/SF is selected as the en-
vironment enabling instantiation of such models. Although structural test methods have been
briefly outlined, the focus of this thesis is put on functional testing. Finally, having the previous
constraints in mind, praxis relevant approaches are to be elaborated.
Hence, the test approaches influencing this work conceptually and technically are analyzed in
Table 3.1 and Table 3.2 in terms of the MBT taxonomy. The characteristic of the approach en-
compassed in this thesis is introduced at the end of this chapter.](https://image.slidesharecdn.com/zanderdiss-130217192436-phpapp02/85/Zander-diss-67-320.jpg)
![44 3 SELECTED TEST APPROACHES
Table 3.1: Classification of the Selected Test Approaches based on the MBT Taxonomy.
MBT Test
Test Generation Test Execution
Categories, Evaluation
Options
Test Selection Execution
Selected Test Technology Specification Technology
Criteria Options
Tools
- does not - automatic - MiL, SiL - requirements - manual
EmbeddedValidator apply 19 generation - non-reactive coverage specification
[EmbV] - model checking - does not apply
- does not apply - does not apply - MiL, SiL, PiL, - reference - manual
since here back- HiL signals-based specification
to-back regres- - non-reactive - offline
MEval [MEval]
sion tests are evaluation
considered
- data coverage - manual - MiL, SiL, PiL, - reference - manual
- requirements generation HiL signals-based specification
coverage - non-reactive - offline
MTest with CTE/ES - test case evaluation
[MTest, CTE] specification
- offline
generation
- structural - automatic - MiL, SiL, HiL - test evaluation - automatic
model coverage generation - non-reactive specifications specification
Reactis Tester
- offline - model - offline
[ReactT]
generation checking 20 evaluation
- structural - automatic - MiL, SiL - test evaluation - manual
model coverage generation - non-reactive specifications specification
- requirements - model checking - online
Reactis Validator
coverage evaluation
[ReactV]
- offline
generation
- does not apply - manual - MiL - requirements - manual
Simulink®
generation - non-reactive coverage specification
Verification and
- online
Validation™
evaluation
[SLVV]
- structural - automatic - MiL, SiL - requirements - manual
model coverage generation - non-reactive coverage specification
Simulink® Design
- offline - theorem - test evaluation - online
Verifier™ [SLDV]
generation proving specifications evaluation
19
Unless otherwise noted, the expression ‘does not apply’ is used when the particular option is not explicitly named for the
given test approach. In that case either further deep investigation is needed to assess the option or the assessment plays no
role for further analysis.
20
The tool employs an approach called guided simulation to generate quality input data automatically. The idea behind this
approach is to use algorithms and heuristics so as to automatically obtain inputs covering the targets (i.e., model elements
to be executed at least once). The author decided to classify this approach as a sophisticated variant of model checking
technology.](https://image.slidesharecdn.com/zanderdiss-130217192436-phpapp02/85/Zander-diss-68-320.jpg)
![3 SELECTED TEST APPROACHES 45
- data coverage - automatic - MiL, SiL, HiL - reference - manual
- offline generation 21 - non-reactive signals-based specification
SystemTest™
generation - offline
[STest]
evaluation
- data coverage - manual - MiL, SiL, PiL, - reference - manual
- requirements generation HiL signal-feature specification
coverage - reactive – based - online and
- test case offline
TPT [TPT] specification evaluation
- offline and
online gen-
eration
- structural - automatic - MiL, SiL - test evaluation - automatic
model coverage generation - non-reactive specifications specification
- data coverage [ROT98] - does not apply
- requirements
T-VEC [TVec]
specification
- offline
generation
Considering the test approaches introduced in Table 3.1, several diversities may be observed.
EmbeddedValidator [EmbV, BBS04] uses model checking as test generation technology and
thus, is limited to discrete model sectors. The actual evaluation method offers a basic set of
constraints for extracting discrete properties, not addressing continuous signals. Only a few
temporal constraints are checked. However, the mentioned properties of the model deal with the
concept on signal features, whereas the basic verification patterns contribute to the test patterns
and their reusability within the technique proposed in this thesis.
MEval [MEval] is especially powerful for back-to-back-tests and for regression tests, since
even very complex reference signals are already available in this case. The option is excluded
from further consideration.
MTest [MTest] with its CTE/ES [CTE], as already mentioned in the previous section, gives a
good background for partitioning of test inputs into equivalence classes. The data coverage and
test case specifications criteria are reused in MiLEST to some extent. Similarly as in System-
Test, the test evaluation is based only on reference signal-based specification, which constitutes
a low abstraction level, thus it is not adopted for further development.
Reactis Tester [ReactT], T-VEC [TVec], or the method of [Pre03] present approaches for com-
puting test sequences based on structural model coverage. It is searched for tests that satisfy
MC/DC criteria. Their value is that the test suites are generated for units (functions, transitions)
but also for the entire system or on integration level. Although the methods seem to be very
promising due to their scope and automation grade, this thesis is focused on functional testing
only. Structural testing is left open as a complementary method.
21
The test vectors may be defined using MATLAB expressions or generated randomly applying probability distributions for
Monte Carlo simulation [DFG01].](https://image.slidesharecdn.com/zanderdiss-130217192436-phpapp02/85/Zander-diss-69-320.jpg)
![46 3 SELECTED TEST APPROACHES
In Reactis Validator [ReactV, SD07] only two predefined validation patterns are available.
Hence, a systematic test specification is not possible. This gap is bridged in MiLEST that pro-
vides assertion – precondition pairs. They enable the test evaluation functions to be related with
the test data generation.
For SL DV [SLDV] a similar argumentation applies, although another test generation technol-
ogy is used. An advantage of these three solutions is their possibility to cover both functional
and structural test goals, at least to some extent.
SL VV [SLVV] gives the possibility of implementing a test specification directly next to the
actual test object, but the standard evaluation functions cover only a very limited functionality
range, a test management application is missing and test data must be created fully manually. A
similar test assessment method, called ‘watchdog’ and ‘observer’, has been introduced by
[CH98, DCB04], respectively.
TPT [TPT], as discussed in the previous section, is platform-independent and can be used at
several embedded software development stages, which is not directly supported with MiLEST,
although extensions are possible. It is the only tool from the list in Table 3.1 that enables reac-
tive testing and signal-feature – based specification of the test evaluation algorithms. These
concepts are reused and extended in the solution proposed in this thesis.
The classification of the selected test approaches based on the test dimensions can be derived
from the discussion above. However, the summary is given explicitly for complementary pur-
poses. Further details can be found in Appendix A annexed to this thesis.
Table 3.2: Classification of the Selected Test Approaches based on the Test Dimensions.
Test
Dimensions Test
Test Test Test Test
Execution
Goal Abstraction Reactiveness Scope
Selected Test Platform
Tools
EmbeddedValidator - functional - abstract - MiL, SiL 22 - non-reactive
MEval - functional - non-abstract - MiL, SiL, PiL, HiL - non-reactive
MTest with CTE/ES - functional - semi-abstract - MiL, SiL, PiL, HiL - non-reactive
Reactis Tester - structural - non-abstract - MiL, SiL, HiL - non-reactive
Reactis Validator - functional - abstract - MiL, SiL - non-reactive
Simulink® - component
Verification and - functional - abstract - MiL - non-reactive - integration
Validation™
Simulink® Design - structural
- abstract - MiL, SiL - non-reactive
Verifier™ - functional
SystemTest™ - functional - non-abstract - MiL, SiL, HiL - non-reactive
- reactive
TPT - functional - abstract - MiL, SiL, PiL, HiL
T-VEC - structural - non-abstract - MiL, SiL - non-reactive
22
For SiL, PiL and HiL test adapters and test drivers are usually needed.](https://image.slidesharecdn.com/zanderdiss-130217192436-phpapp02/85/Zander-diss-70-320.jpg)

![48 3 SELECTED TEST APPROACHES
Table 3.3: Classification of the Test Approaches based on the Selected Criteria.
Criteria Test Specification
Transforma-
Test Test
Manual Automatic tion and
Selected Test Evaluation Formal Patterns
Test Case / Test Case / Automation
Methodologies, Scenarios Verifica- Support
Test Data Test Data Facilities
Technologies, Tools as Driving tion
Specification Generation
Force
EmbeddedValidator + +
(15 patterns)
MTest with CTE/ES +
Reactis Tester + +
Reactis Validator + + –/+
(2 patterns)
Simulink®
Verification and + + +
Validation™ (12 patterns)
Simulink® Design –/+
Verifier™ + + (4 patterns)
SystemTest™ +
TPT + +
T-VEC + +
Transformations
Approach [Dai06] + +
Watchdogs [CH98] +
MiLEST + + + (over 50 +
patterns)
A starting point applying the method is to design the test specification model in MiLEST. Fur-
ther on, generic test data patterns are retrieved automatically from some marked portions of the
test specification. The test data generator concretizes the data. Its functionality has some simi-
larities to the CTM method and aims at systematic signal production. The SUT input partitions
and boundaries are used to find the meaningful representatives. Additionally, the SUT outputs
are considered too. Hence, instead of searching for a scenario that fulfills the test objective it is
assumed that this has already been achieved by defining the test specification. Further on, the
method enables to deploy a searching strategy for finding different variants of such scenarios
and a time point when they should start/stop.
Since at the early stage of new system functionalities development reference signals are not
available, another solution has to be provided. In this thesis a new method for describing the
SUT behavior is given. It is based on the assessment of particular signal features specified in
the requirements. For that purpose a novel, abstract understanding of a signal is defined. This is
the fundamental contribution of this work as both test case generation and test evaluation are
based on this concept. Numerous signal features are identified; feature extractors, comparators,
and feature generators are implemented. Due to their application, the test evaluation may be
performed online which enables an active test control, opens some perspectives for test genera-
tion algorithms and provides extensions of reactive testing, but at the same time reduces the
performance of the test system. Also, new ways for first diagnosis activities and failure man-
agement are possible.](https://image.slidesharecdn.com/zanderdiss-130217192436-phpapp02/85/Zander-diss-72-320.jpg)
![3 SELECTED TEST APPROACHES 49
Finally, the introduced reactive testing concept relates to the test control, but it is more power-
ful, especially in the context of hybrid systems. [Leh03] defines the test reactiveness as a reac-
tion of the test data generation algorithm on the SUT outputs during the test execution. In par-
ticular, the test case reacts to a defined SUT state, instead of on a defined time point. This defi-
nition is extended in this thesis as the test data can be additionally influenced by signals from
the test evaluation. Combining this method with the traditional test control definition, the se-
quence of test cases execution can be organized and test data generation can be influenced de-
pending on the verdict of the previous test case (as in TTCN-3); depending on the SUT outputs
(as in TPT and in TTCN-3) and on other test evaluation signals (e.g., reset, trigger, activation).
The options that MiLEST covers with respect to the MBT taxonomy are listed in Table 3.4.
Table 3.4: Classification of MiLEST with respect to the MBT Taxonomy.
Test Test Generation: Test Execution Options Test Evaluation:
Approach Selection Criteria Specification
and Technology and Technology
- data coverage - MiL - reference signal-feature – based
- requirements coverage - reactive - requirements coverage
- test case specifications - test evaluation specifications
MiLEST - automatic generation - automatic and manual
- offline generation (depending on the process step)
- online evaluation
In this chapter, the first set of questions arisen in the introduction to this thesis has been consid-
ered. The role of system model in relation to the quality-assurance process has been established.
Since black-box testing is aimed at the availability of the system model and an access to its in-
terfaces became the crucial issue. It has been decided to provide a test model including all the
parts of a complete test specification. Also, a common language for both system and test speci-
fications have been used.
3.4 Summary
In this chapter related work on MBT has been introduced and its analysis has been done. At
first, MBT taxonomy has been elaborated, extended and presented on a diagram. Then, the sys-
tem model has been fixed as a concrete instantiation of one of the categories from the taxon-
omy. Further categories and options from the taxonomy have been discussed in detail. They are
related to the test generation, test execution and test evaluation.
Then, in Section 3.2, the current testing situation identified in the automotive domain has been
reported. In Section 3.3, a trapezoid has been introduced so as to narrow the range of MBT ap-
proaches investigated further on. Then, an analysis of the selected test methods followed, re-
sulting in a list of the corresponding test tools available in the academia or industry. Their com-
prehensive classification of the MBT solutions has been attached in Appendix A as a table.
Hence, it should be referred to while analyzing the contents of this chapter. For additional work
on MBT the reader is linked to the surveys given in [BJK+05, UL06].](https://image.slidesharecdn.com/zanderdiss-130217192436-phpapp02/85/Zander-diss-73-320.jpg)

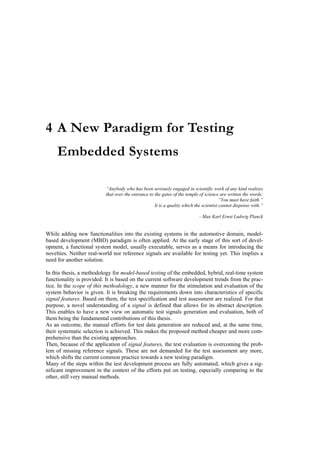
![4 A NEW PARADIGM FOR TESTING EMBEDDED SYSTEMS 53
In the following chapter the conceptual contents of the method proposed in this thesis are intro-
duced. Its realization is called Model-in-the-Loop for Embedded System Test and abbreviated
as MiLEST. In Section 4.1, the basics on signal and signal feature are presented. Also, different
combinations of such features are investigated. Then, in Section 4.2, they are classified accord-
ing to the availability in time and assessment delay. Every entry of this classification is re-
viewed from the perspective of signal generation and signal evaluation. At any one time, a re-
alization proposal is given. This gives the possibility to deal with an automatic test generation
and evaluation and by that, the manual efforts spent on such activities are considerably reduced.
Section 4.3 introduces the concept of test patterns that are applicable in the proposed method
and outlines the characteristics of the selected solution. The collection of the MiLEST test pat-
terns is attached as a table in Appendix B. These ease the application of the methodology and
structure the knowledge on the test system being built. As a consequence, flexible test specifi-
cations can be obtained systematically. In Section 4.4, process of test specification and test exe-
cution is briefly described. Finally, Section 4.5 provides related work on the test paradigms ap-
plied in this thesis, whereas Section 4.6 completes the chapter with a summary.
4.1 A Concept of Signal Feature
Before the signal-feature approach and features classification will be presented, fundamental
knowledge on signal and signal processing is given. Additionally, also logical connectives and
temporal relations between features are introduced for completeness of the discussion on test
specification.
4.1.1 A Signal
A signal is any time-varying or spatial-varying quantity [KH96, NM07]. It represents a pattern
of variation of some form [EMC+99]. Signals are variables that carry information.
Mathematically, signals are represented as a function of one or more independent variables. As
a matter of example, a black and white video signal intensity is dependent on x, y coordinates
and time t, which is described as f(x,y,t).
In this thesis, exclusively signals being a function of time – f(t) will be concerned. Giving some
examples: velocity of a car over time is classified as a mechanical signal, voltage, and current
in a circuit are electrical signals and acoustic pressure over time belongs to acoustic signals
[KH96].
Signals can be categorized in various ways. The distinction regarded in this thesis is reduced to
the difference between discrete and continuous time that the functions are defined over and be-
tween their discrete and continuous values. Most signals in the real world are time-continuous,
as the scale is infinitesimally fine. Differential equations are used for representing how con-
tinuous signals are transformed within time-continuous systems, whereas difference equations
enable discrete signals to be transformed within most time-discrete systems. An analog signal is
a kind of signal that is continuously variable in time, as opposed to digital signal which is vary-
ing in a limited number of individual steps along its range [KH96]. Analog signal differs from a
digital signal in that small fluctuations in the signal are meaningful. Digital signals are value-
discrete, but are often derived from an underlying value-continuous physical process.](https://image.slidesharecdn.com/zanderdiss-130217192436-phpapp02/85/Zander-diss-77-320.jpg)
![54 4 A NEW PARADIGM FOR TESTING EMBEDDED SYSTEMS
Furthermore, in this thesis causal systems are discussed. A system is causal if the output at a
time only depends on input values up to that time, not on the future values. It is referred to as
non-anticipative, because the system output does not anticipate future values of the input
[KH96, EMC+99].
Mathematically, a system x(t) → y(t) is causal if x1(t) → y1(t), x2(t) → y2(t) and given two input
signals x1(t), x2(t) have the relation x1(t) = x2(t) for all t ≤ t0 , then y1(t) = y2(t) for all t ≤ t0.
All real-time physical systems are causal, because time only moves forward, i.e., effect occurs
after cause [EMC+99].
In Simulink (SL) even the events are described using signals with a value at every simulation
time step. The realization of time-continuous and time-discrete signals is based on the same
principle. Time-discrete signals are a subset of analog signals, although their representation
seems to be redundant from some viewpoints.
Moreover, a continuous signal in SL is actually time-sampled continuous signal represented as
an equation:
x[k] = x(kT), where:
− T is sample time 23
− k is the simulation time step.
Hence, the prototypical realization of the test technology introduced in this thesis limits its
scope to the generation, controlling, and assessment of value-continuous and time-sampled con-
tinuous signals, although the system behavior expressed by those signals can be of continuous
and discrete nature. Thus, theoretically, the separation of concerns still applies and the signals
will be considered as both time-continuous and time-discrete.
To sum up, the test system proposed hereby utilizes the basic principles of signal processing 24.
Subsequently, the two main tasks, namely test data generation and test evaluation, can be re-
named to signal generation and signal evaluation with respect to the lowest level of abstraction
as presented in Figure 4.1. The system specification is used as a decisive factor about the type
of signals that are generated and evaluated within functional tests. Additionally, the feedback
path supports the test reactiveness (cf. Section 3.4).
23
The sample time also known as simulation time step size is called step size in ML/SL/SF [MathSL]. In this thesis it will be
denominated to time step size.
24
Signal processing is the analysis, interpretation and manipulation of signals.](https://image.slidesharecdn.com/zanderdiss-130217192436-phpapp02/85/Zander-diss-78-320.jpg)
![4 A NEW PARADIGM FOR TESTING EMBEDDED SYSTEMS 55
u(kT) y(kT)
h(kT) u(kT) y(kT) z(kT)
SUT
kT h(kT) z(kT) kT
feedback (test reactiveness)
Figure 4.1: A Hybrid Embedded System with Discrete- and Continuous-timed Signals.
4.1.2 A Signal Feature
A signal feature (SigF), also called signal property in [GW07, SG07, GSW08], is a formal de-
scription of certain predefined attributes of a signal. In other words, it is an identifiable, de-
scriptive property of a signal. It can be used to describe particular shapes of individual signals
by providing means to address abstract characteristics of a signal. Giving some examples: step
response characteristics, step, minimum etc. are considerable SigFs.
Whereas the concept of SigF is known from the signal processing theory [KH96, Por96], its
application in the context of software testing has been revealed by [Leh03, LKK+06, ZSM06,
MP07, GW07, SG07, GSW08, ZXS08]. In this thesis, the SigF is additionally considered as a
means for test data generation and, similar to [Leh03], evaluation of the SUT outputs.
Graphical instances of SigFs are given in Figure 4.2. The signal presented on the diagram is
fragmented in time according to its descriptive properties resulting in: decrease, constant, in-
crease, local maximum, decrease, and step response, respectively. This forms the backgrounds
of the solution presented in this work.
Figure 4.2: A Descriptive Approach to Signal Feature.](https://image.slidesharecdn.com/zanderdiss-130217192436-phpapp02/85/Zander-diss-79-320.jpg)
![56 4 A NEW PARADIGM FOR TESTING EMBEDDED SYSTEMS
A feature can be predicated by other features, logical connectives, or timing relations.
In mathematics, a predicate is either a relation or the boolean-valued function that amounts to
the characteristic function or the indicator function of such a relation [Cop79, Men97]. A func-
tion P: X→ {true, false} is called a predicate on X or a property of X. In this sense, a SigF is a
predicate on a signal. Sometimes it is inconvenient or impossible to describe a set by listing all
of its elements. Another useful way to define a set is by specifying a property that the elements
of the set have in common. P(x) notation is used to denote a sentence or statement P concerning
the variable object x. The set defined by P(x) written {x | P(x)}, is a collection of all the objects
for which P is sensible and true. Hence, an element of {x | P(x)} is an object y for which the
statement P(y) is true.
For instance, assuming that the object is a SigF A over the signal sigA and the predicate P(SigF
A) is a maximum, the following is obtained: {SigF A(sigA) | SigF A(sigA) is a maximum} is the
set of all maximums within the signal sigA, called here setMax(sigA).
Further on, looking for a particular value of the maximum: {setMax(sigA) | setMax(sigA) is
equal to v} outputs a set of such maximums that are equal to value v.
4.1.3 Logical Connectives in Relation to Features
A logical connective 25 is a logical constant which represents a syntactic operation on well-
formed formulas. It can be seen as a function which maps the truth-values of the sentences to
which it is applied [Cop79, CC00].
The basic logical connectives applied in the prototypical realization of the test method in this
thesis are the following, also listed in [Cop79]:
− negation (NOT) – (¬)
− conjunction (AND) – (&) 26
− disjunction (OR) – ()׀׀
− material implication (IF … , THEN … ) – (→)
They are used for formalization of the test specification. The detailed description of their appli-
cation follows in Section 4.4 and in Section 5.2.
4.1.4 Temporal Expressions between Features
A temporal relation is an inter-propositional relation that communicates the simultaneity or or-
dering in time of events, states, or SigFs. In logic, the term temporal logic is used to describe
25
A logical connective is also called a truth-functional connective, logical operator or propositional operator.
26
For boolean arguments, the single ampersand ("&") constitutes the (unconditional) "logical AND" operator, called logical
conjunction [Men97], while the double ampersand ("&&") is the "conditional logical AND" operator. That is to say that
the single ampersand always evaluates both arguments whereas the double ampersand will only evaluate the second argu-
ment if the first argument is true. – as retrieved from: http://www.jguru.com/faq/view.jsp?EID=16530 [04/24/2008].](https://image.slidesharecdn.com/zanderdiss-130217192436-phpapp02/85/Zander-diss-80-320.jpg)
![4 A NEW PARADIGM FOR TESTING EMBEDDED SYSTEMS 57
any system of rules and symbolism for representing and reasoning about propositions qualified
in terms of time.
In this thesis a set of temporal expressions from these available in [BBS04, GW07, GHS+07]
has been chosen for introducing the relations between features:
− after (d1, d2) B − SigF B occurs after time specified in the range be-
tween d1 and d2, where 0 <= d1 <= d2
− after (A) B − if SigF A occurs, SigF B occurs afterwards
− before (A)B − if SigF A occurs, than SigF B must have occurred be-
fore
− during (d1, d2) B − SigF B occurs continuously during time specified in
the range between d1 and d2
− during (A)B − if SigF A occurs, SigF B occurs continuously during
activation of SigF A
− every nth occurrence (A) − SigF A occurs every nth time
− within (d1, d2) B − SigF B occurs at least once in time specified in the
range between d1 and d2
− within (A)B − if SigF A occurs, SigF B occurs at least once whereas
SigF A is active
The selection has been done based on the experience analysis from model checking as de-
scribed in [GW07]. The test specification may be combined from SigFs, logical operators, and
temporal expressions. Giving an example: IF A & after(d1, d2) B ׀׀C, THEN during(d3, d4) D –
means that if SigF A on sigA holds and after a period of time not lower than d1 and not higher
than d2 SigF B on sigB holds or SigF C on sigC holds, then SigF D on sigD should hold during
the time period starting from d3 until d4.
Additionally, the following selected temporal expressions [KM08] are covered by the corre-
sponding statements:
− always(A) is covered by IF true THEN A
− never(A) is covered by IF true THEN ¬A.
− eventually(A) is covered by IF true THEN A at least once 27
Similar to the logical connectives, the temporal relations are used for formalization of the test
specification. The description of their application follows in Section 4.4 and in Section 5.2.
The combinations of predicates can be defined either between features characterizing one signal
or more signals, using both logical connectives and temporal relations. For the examples below,
the following assumption is valid: A1 and A2 are SigFs characterizing a time-continuous signal
sigA. A and B are SigFs characterizing two different time-continuous signals, C represents a
SigF characterizing a discrete signal sigC.
27
At least once means in this context at least once until the end of the predefined simulation time for a particular model.](https://image.slidesharecdn.com/zanderdiss-130217192436-phpapp02/85/Zander-diss-81-320.jpg)
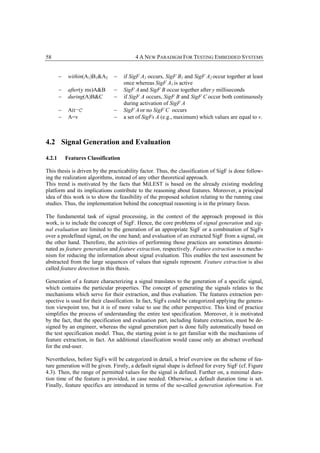
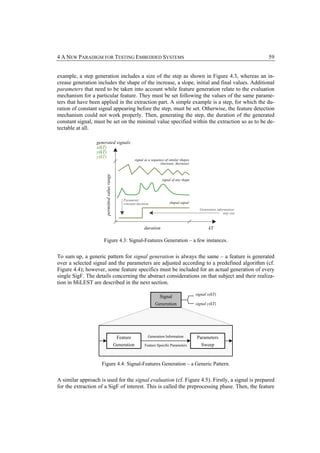
![60 4 A NEW PARADIGM FOR TESTING EMBEDDED SYSTEMS
is extracted to be finally compared with the reference value. A verdict is set based on the ap-
plied arbitration mechanism. The details w.r.t. extraction of the concrete SigFs are given in Sec-
tion 4.2, whereas the patterns classification leading to the test architecture and the arbitration
mechanism are elaborated in the upcoming chapter.
The time step size employed in the process of signal-features extraction is a critical factor in
establishing its success. The choice of the time step size is dependent on the different rates of
response that the system exhibits. If it is chosen too small, it may result in a lack of sensitivity
to changes: too large – it may produce incorrect inferences. Decreasing the time step may help
in differentiating between discontinuities, abrupt changes, and continuous effects. On the other
hand, if the time step is too small when applied to a variable with a relatively slowly decreasing
slope, it appears that the signal does not change for a period of time; therefore, it is reported to
be normal or to have reached steady state. In reality it is decreasing, and reporting it as normal
may result in premature elimination of true faults [Mos97].
InOut pass (1)
Bus Signal
Evaluation fail (0)
Signal Feature Comparison
Preprocessing Extraction & Arbitration
Ref
Figure 4.5: Signal-Features Evaluation – a Generic Pattern.
The concept of feature extraction and features classification were already given in the previous
work of the author [ZSM06]. Then, the types of features discussed in this thesis and the sub-
stantial parts of the evaluation implementation are directly adopted from [MP07, ZMS07a].
Extracting SigF from a signal can be generally seen as a transformation of SUT signals to so-
called feature signals (not to be confused with signal feature, also called SigF or simply feature
in the following). The concrete values of an extracted feature signal represent the considered
SigF at every time step. The feature signal is then compared with the reference data according
to a specific, SigF related algorithm.
The scope of the online evaluation is reduced to all the past time steps until the actual one.
Many features are not immediately identifiable, though. Taking an example of a maximum, it
can only be detected at least one time step after it takes place. Some features are only identifi-
able with a delay, that might be known in advance (determinate) or not (indeterminate). This
phenomenon is revealed in the naming convention for SigFs applied in this thesis.
The feature extraction realization determines the two aspects according to which the features
can be classified. In Figure 4.6, one example for every combination is drawn, including the ac-
tual signal and the feature signal (i.e., result of the feature extraction). For triggered features an
additional trigger signal exists.](https://image.slidesharecdn.com/zanderdiss-130217192436-phpapp02/85/Zander-diss-84-320.jpg)
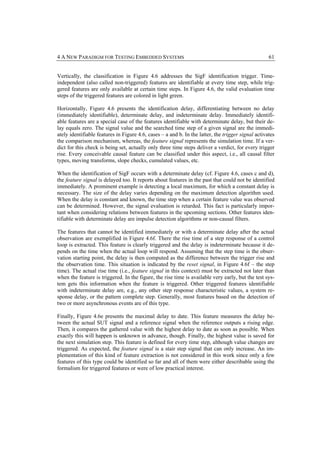
![62 4 A NEW PARADIGM FOR TESTING EMBEDDED SYSTEMS
Identifiable Identifiable
Immediately identifiable
with determinate delay with indeterminate delay
signal signal reference
Time-independent
kT
signal
kT kT
feature feature
kT
feature
kT kT kT
a) Signal value c) Detect maximum e) Maximal delay
to date
signal signal reset
x
signal kT
kT kT
trigger trigger
Triggered
trigger kT
kT kT
feature feature kT
feature
kT kT kT
b) Time when signal = x d) Signal value f) Step response rise
when maximum time
Figure 4.6: Signal-Features Classification based on the Feature Identification Mechanism.
The classification of different feature types given in Figure 4.6 is comprehensive as far as the
output signals of a casual system are evaluated. Using the presented mechanisms, SigFs that are
observable in the past up to the current time step, can be identified and assessed.
Under these circumstances, the classification of feature types is completed. Though, the in-
stances representing those types may lead to inconsistencies, as Gödel’s theorem [Fra05] would
imply. Indeed, the different types of SigFs may often be implemented using different mecha-
nisms depending on the current needs of the test system (cf. Figure 5.10).
The realization of the test evaluation enables to run it online, i.e., during the execution of the
SUT. This implies that the feature extraction algorithm is run cyclically in SL. Hence, verdicts
are computed at every time step on the fly.
In the next three sections, the three types of SigFs are explained in detail. The scheme of de-
scription is always the same. Firstly, the definitions are given. Then, a few generic examples are](https://image.slidesharecdn.com/zanderdiss-130217192436-phpapp02/85/Zander-diss-86-320.jpg)
![4 A NEW PARADIGM FOR TESTING EMBEDDED SYSTEMS 63
provided, on the basis of which feature generation principles follow. They are listed in tables.
Furthermore, the implementation examples are described in depth. In particular, algorithms for
feature extraction are reviewed and the mechanisms for feature generation are discussed.
The separation into different feature types is motivated mainly by the fact that several features
are not available at every time step and not all features can be extracted causally. For the time
steps when the feature is not available, a none verdict is set.
4.2.2 Non-Triggered Features
Time-independent (non-triggered) features identifiable with or without a delay (TI) are avail-
able to be extracted at every time step. Thus, they can be described using a single feature sig-
nal. The generation of SigF simply produces a signal including this SigF. The SigF extraction is
an algorithm that computes the actual value of the feature signal at every time step.
Table 4.1 outlines the examples of detection and generation algorithms for features classified as
TI identifiable immediately or with a determined delay. The list is obviously not exhaustive.
Only a set of basic examples are given based on the analysis of mathematical functions or fea-
tures included in [Men97, MSF05, LKK+06, SZ06, MathSL, WG07]. They enable, however,
creation of more comprehensive features. In the further part of this section the details regarding
the realization of the features generation and evaluation, both being the contribution of this the-
sis are explained.
Both activities – feature extraction and feature generation are parameterized. Since the signals
generation occurs automatically (cf. Sections 5.3 – 5.5) additional issues on their derivation are
given explicitly. These are generation information and a set of parameters strongly related to
the extraction of features. These are of particular importance since they must be set on exactly
the same values in the feature generation as in the respective feature extraction blocks. The pa-
rameters for the feature extraction may be found in the MiLEST library, instead.](https://image.slidesharecdn.com/zanderdiss-130217192436-phpapp02/85/Zander-diss-87-320.jpg)
![64 4 A NEW PARADIGM FOR TESTING EMBEDDED SYSTEMS
Table 4.1: TI Features – Evaluation and Generation Algorithms.
Evaluation View Generation View
SigF
Time-independent (TI)
1-1. Signal value detection 1-1. Any curve crossing the value of interest in the permitted range of values,
Immediately identifiable
[LKK+06] where duration time = default
Generation information:
– value of interest
1-2. Basic mathematical opera- 1-2. Any curve described by a basic mathematical operations, e.g., crossing
tions, e.g., zero detection zero value in the permitted range of values, where duration time = default
[MathSL] Generation information:
– time of zero crossing
1-3. Any ramp increasing with a default/given slope in the permitted range of
1-3. Increase detection values, where duration time = default
[MathSL, LKK+06] Generation information:
– slope
– initial output
– final output
1-4. Decrease detection 1-4. Any ramp decreasing with a default/given slope in the permitted range of
[MathSL, LKK+06] values, where duration time = default
Generation information:
– slope
– initial output
– final output
1-5. Constant detection 1-5. Any constant in the permitted range of values, where duration time =
[MathSL, LKK+06] default
Generation information:
– constant value
1-6. Signal continuity detection 1-6. Any continuous curve in the permitted range of values, where duration
[Men97] time = default
1-7. Derivative continuity de- 1-7. Any continuous curve in the permitted range of values, where duration
tection [Men97] time = default
1-8. Linearity (with respect to 1-8. Any linear function in the permitted range of values, e.g., described by the
the first value) detection equation y =ax+b, where duration time = default
Generation information:
– slope
– y-intersept
Parameter:
– linearity constant
1-9. Functional relation y = f(x) 1-9. Any function in the permitted range of values described by a concrete
detection y=f(x), where duration time = default
1-10. Maximum to date detection 1-10. Any curve containing at least one maximum in the permitted range of
values, where duration time is at least the time of date
Generation information:
– time of date
1-11. Minimum to date detection 1-11. Any curve containing at least one minimum in the permitted range of
values, where duration time is at least the time of date
Generation information:
– time of date
1-12. Causal filters and moving 1-12. Application specific
transformations [SZ06]
1-13. Actual/cumulated emis- 1-13. Application specific
sions, consumption [SZ06]](https://image.slidesharecdn.com/zanderdiss-130217192436-phpapp02/85/Zander-diss-88-320.jpg)
![4 A NEW PARADIGM FOR TESTING EMBEDDED SYSTEMS 65
Identifiable with determined delay
2-1. Detection of local maxi- 2-1. Increasing and decreasing ramps one after another forming a maximum in
mum [LKK+06] the permitted range of values, where duration time = default
Generation information:
– duration of the increase and decrease
– limits of the ramps in value range
Parameter:
– delay value while maximum detection
2-2. Detection of local mini- 2-2. Decreasing and increasing ramps one after another forming a minimum in
mum [LKK+06] the permitted range of values, where duration time = default
Generation information:
– duration of the increase and decrease
– limits of the ramps in value range
Parameter:
– delay value while minimum detection
2-3. Detection of inflection 2-3. A curve, containing a point at which the tangent crosses this curve itself
point [MSF05] e.g., a curve y = x3 forming an inflection point at point (0,0), where dura-
tion time = default
Generation information:
– inflection point
Parameter:
– delay value while inflection point detection
2-4. Peak detection [MSF05] 2-4. Decreasing and increasing ramps one after another forming a peak in the
permitted range of values, where duration time = default
Generation information:
– duration of the increase and decrease
– limits of the ramps in value range
Parameters:
– minimal peak size
– peak sensibility
– delay value while peak detection
2-5. Impulse detection [MSF05] 2-5. An impulse signal with a given impulse size and impulse duration in the
permitted range of values, where duration time = default
Generation information:
– impulse size
– impulse duration
Parameters:
– minimal impulse size
– delay value while impulse detection
2-6. Step detection [LKK+06] 2-6. Any step in the permitted range of values, where duration time = default
Generation information:
– step time
– initial value
– step size
Parameters:
– minimal step size
– constant duration before a step
2-7. Non-causal filters and 2-7. Application specific
moving transformations
[SZ06]
In the upcoming paragraphs, a further explanation of the selected TI features is presented and
the SL implementation of their generation and extraction is shown.
By now, only the generation of single features is provided, omitting the concepts for adjusting
their duration, their sequencing, or variants generation. These issues will be addressed in Sec-
tions 5.3 – 5.5.
Thereby, considering the signal value feature, its generation is reduced to producing any curve
which crosses the value of interest within a predefined duration time. For signal value detec-](https://image.slidesharecdn.com/zanderdiss-130217192436-phpapp02/85/Zander-diss-89-320.jpg)
![66 4 A NEW PARADIGM FOR TESTING EMBEDDED SYSTEMS
tion, the role of feature extraction block is to pass signal values to the comparison block. More
complex features can be extracted applying the mathematical functionality of the standard SL
libraries.
For generation of increase, decrease, or a constant various solutions are possible, e.g., ramps,
logarithmic, or exponential functions. The features can be detected by analyzing their deriva-
tive. This can be approximated using the actual signal value and the past one (backward differ-
ence):
f(kT) = sign [signal (kT) − signal ((k − 1) · T)] (4.1)
The feature signal f(kT) is 1 if the signal increases, 0 if it is constant, and −1 if it decreases.
Similarly, the continuity of a signal can be checked by the argument of the sign function. If the
backward difference exceeds a certain value, the existence of a step is assumed and a disconti-
nuity is detected. The continuity of the derivative can be extracted in the same manner [MP07].
In the proposed approach, the realization of an increase is a simple ramp, of which two types
are possible. One for an increase limited in time and in signal value range, the other for a
change with a given slope and limited in value range. A simplified version of this feature gen-
eration algorithm is shown in Figure 4.7, including masks for the corresponding blocks in SL.
Option 3 is not covered in the prototype.
no. Options Generated signals
Criteria:
signal (kT)
time + max
1 signal
+
range
min
tangent
(angle) t1 kT
Criteria:
signal (kT)
time max
2 signal
+
range angle1
min
tangent
+
(angle) kT
Criteria:
signal (kT)
time +
3 signal
range angle1
min
tangent
+
(angle) t1 kT
Figure 4.7: Feature Generation: Increase Generation and the Corresponding SL Block masks.](https://image.slidesharecdn.com/zanderdiss-130217192436-phpapp02/85/Zander-diss-90-320.jpg)
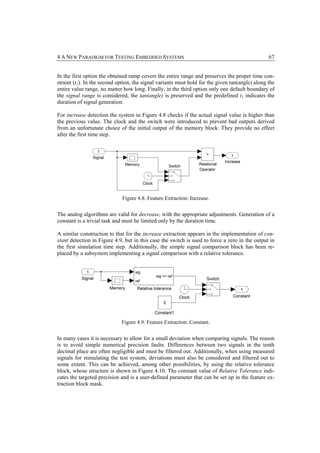
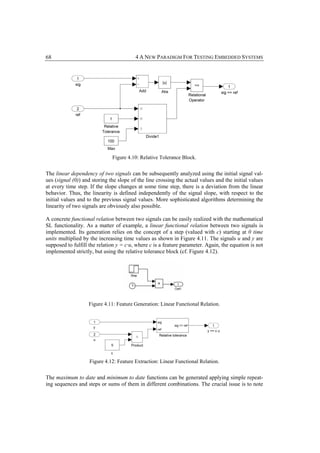
![4 A NEW PARADIGM FOR TESTING EMBEDDED SYSTEMS 69
their duration time and synchronize them with the entire test case generation sequence; how-
ever, this problem will be discussed in Section 5.5.
The considered functions recursively compute the maximal or minimal signal value to date as
follows:
max to date (kT) = max [max to date ((k − 1) · T) , signal (kT)] (4.2)
min to date (kT) = min [min to date ((k − 1) · T) , signal (kT)] (4.3)
Figure 4.13 shows the blocks implementing the minimum to date feature extraction. The last
minimal value is saved in the memory block for the next time step.
Figure 4.13: Feature Extraction: Minimum to Date.
The local maximum or peaks can also be easily produced using a repeating sequence function.
The objective of local maximum detection is to check if the last backward difference was nega-
tive and the last before last positive. If that is the case, the feature signal is triggered, indicating
the presence of a maximum with a time step delay, i.e., the maximum takes place one time step
before it is actually noticed. The feature signal itself does not need to be retarded; it is already
delayed.
A basic algorithm for detecting local maxima and minima starts from the value of the backward
difference in the actual and next time step. By using the next time step, the feature extraction is
delayed by one time step. If the backward difference changes its sign from positive to negative,
there is a maximum, whereas a change from negative to positive points at a minimum. The
situation is presented in Figure 4.14.
Figure 4.14: Feature Extraction: Local Maximum.](https://image.slidesharecdn.com/zanderdiss-130217192436-phpapp02/85/Zander-diss-93-320.jpg)
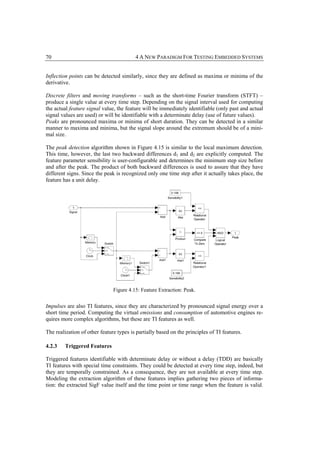
![4 A NEW PARADIGM FOR TESTING EMBEDDED SYSTEMS 71
Thereby, the generation of TDD feature requires information about the trigger and about the
delay (if it exists).
In this context, the feature signal introduced for extraction of TI features is reused and com-
pleted by a trigger signal. The trigger signal indicates the time steps when the feature signal is
valid. It can only take the values true and false. Trigger and feature signal should not be sepa-
rated, since they do not contain enough meaning when isolated.
Normally, feature and trigger signal are computed separately, because the trigger signal repre-
sents usually the temporal constraints on the feature signal. Both are often independent. As al-
ready mentioned, this does not necessarily have to be the case, but it appears to be frequently
that way. In consequence, the feature extraction problem for TDD features can be interpreted as
the extraction of two separate TI features (cf. Section 4.2.1), resulting in feature and trigger
signal.
In the same manner as for TI features, the examples of detection and generation algorithms for
TDD features are listed in Table 4.2. Several of them are based on TI features with an addi-
tional time constraint.
Any immediately identifiable TI features over a time, e.g., signal value at time1, signal value
within [time1, time2] or any immediately identifiable TI features when a value is reached, e.g.,
time at value1, time while maximum to date, increase within [value1, value2] belong to the cate-
gory of TDD features.](https://image.slidesharecdn.com/zanderdiss-130217192436-phpapp02/85/Zander-diss-95-320.jpg)
![72 4 A NEW PARADIGM FOR TESTING EMBEDDED SYSTEMS
Table 4.2: TDD Features – Evaluation and Generation Algorithms.
Evaluation View Generation View
SigF
Triggered (TDD)
3-1. Detection of signal value at 3-1. Any curve crossing the value of interest in the permitted range of values,
Immediately identifiable
a certain time step where duration time = default, but not less than a given certain time step
Generation information:
– signal value
Parameter:
– duration of the feature not less than the given time step
3-2. Detection of time stamp of 3-2. Any curve where an event appears in the permitted range of values, where
an event, i.e., time of an duration time = default e.g., a signal flow consisting of increasing ramp,
event peak, increasing ramp, where duration time = default
Generation information:
– time stamp
Parameter:
– triggering value (e.g., event)
3-3. Detection of increase rate 3-3. Any ramp increasing with a default/given slope in the permitted range of
values, where duration time = default
Generation information:
– slope
– initial output
– final output
3-4. Detection of decrease rate 3-4. Any ramp decreasing with a default/given slope in the permitted range of
values, where duration time = default
Generation information:
– slope
– initial output
– final output
3-5. Detection of the signal 3-5. Constant in the permitted range of values, where duration time = default
value when signal is con- Generation information:
stant – signal value
3-6. Detection of time point 3-6. Constant following a non-constant curve in the permitted range of values,
since signal is constant where duration time = default
Generation information:
– starting time of constant
3-7. Step size detection 3-7. Any step in the permitted range of values, where duration time = default
[LKK+06] Generation information:
– step time
– initial value
– sample time size
Parameters:
– minimal step size
– constant duration before a step
3-8. Detection of functional 3-8. Any function in the permitted range of values described by a concrete y
relation in the first t sec- =f(x), where duration time is at least time of t seconds
onds of the test Generation information:
– slope
– y-intersept
Parameter:
– time t](https://image.slidesharecdn.com/zanderdiss-130217192436-phpapp02/85/Zander-diss-96-320.jpg)
![4 A NEW PARADIGM FOR TESTING EMBEDDED SYSTEMS 73
Identifiable with determined delay
4-1. Value detection when TI 4-1. e.g., Increasing and decreasing ramps one after another forming a maxi-
feature identifiable with a mum in the permitted range of values, where duration time = default
delay is active, e.g., signal Generation information:
value when there is a local – signal value
maximum Parameter:
– delay value while maximum detection, i.e., here specific for the
maximum detection algorithm
4-2. Detection of time stamp for 4-2. e.g., Increasing and decreasing ramps one after another forming a maxi-
TI features identifiable with mum in the permitted range of values, where duration time = default
a delay Generation information:
– time stamp
Parameter:
– delay value
4-3. Extraction of signal energy 4-3. An impulse signal with a given impulse size and impulse duration in the
during an impulse [MSF05] permitted range of values, where duration time = default
Generation information:
– Signal energy
Parameter:
– delay value
Signal value at a certain time step is the simplest example of a TDD feature. From the extrac-
tion point of view, it is actually a TI feature with an additional trigger signal given by the ex-
plicit time constraint. The constraint can also be determined by an event that activates the trig-
ger. Any signal including an event (e.g., signal value=x1) that appears at a given time t1 satis-
fies the requirements for generation of this feature (cf. Figure 4.16).
Concerning the feature extraction in Figure 4.17 the actual time is continuously output, whereas
the trigger becomes active only when an event occurs. In this case it happens when the input
signal reaches a certain value. Both trigger and feature signal are computed separately by two
different TI features completing each other.
signal (kT)
max
x1
min
t1 duration
Figure 4.16: Feature Generation: Time Stamp of an Event.](https://image.slidesharecdn.com/zanderdiss-130217192436-phpapp02/85/Zander-diss-97-320.jpg)
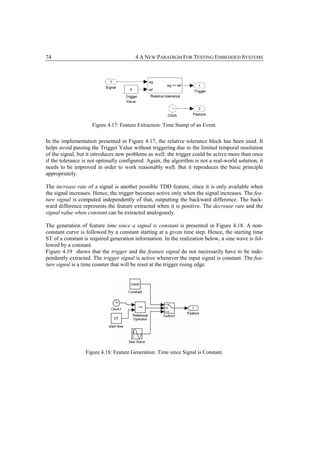
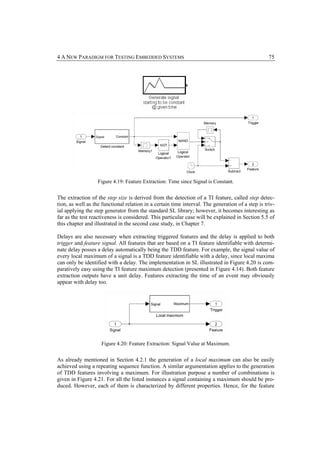
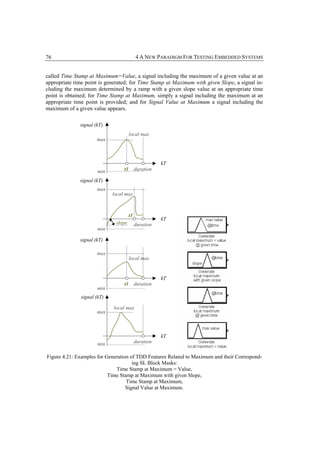
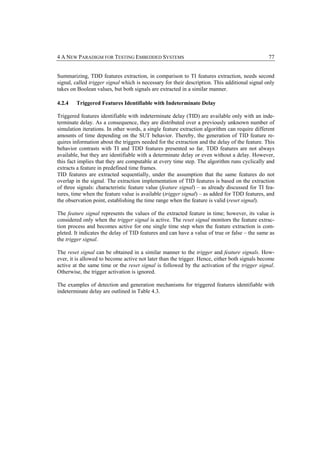
![78 4 A NEW PARADIGM FOR TESTING EMBEDDED SYSTEMS
Table 4.3: TID Features – Evaluation and Generation Algorithms.
Evaluation View Generation View
SigF
Triggered (TID)
5-1. Detection of time between 5-1. Any non-constant curve where two concrete events appear one after an-
Identifiable with undetermined delay
two events other in the permitted range of values within the given time range
Generation information:
– time of event1 (t1)
– time of event2 (t2) not exceeding the permitted duration, where t1<t2
5-2. Detection of signal mean 5-2. Any non-constant curve intersected by two concrete events sequenced one
value in the interval be- after another in the permitted range of values within the given time range
tween two events Generation information:
– signal mean value
5-3. Detection of response delay 5-3. A stabilized constant followed by a step response characteristics with
[MSF05] given response delay in the permitted range of values within the given
time range
Generation information:
– response delay
5-4. Complete step detection 5-4. At least two steps one after another starting at a default/given value with a
[MSF05, LLK+06] default/given step size and a default/given time between them and in the
permitted range of values within the given time range
Generation information:
– step size
– time between steps
Parameters:
– constant duration before a step
– minimal step size
5-5. Detection of step response 5-5. A stabilized constant followed by a step response characteristics in the
characteristics [LLK+06], permitted range of values and time
e.g., Generation information:
– steady-state error – steady-state error
– rise time – rise time
– overshoot – overshoot
– settling time – settling time
Parameters:
– constant duration before a step
– minimal step size
– systems static gain
– rise time interval lower limit (in set point %)
– rise time interval upper limit (in set point %)
– maximum overshoot - moving average weight
– settling time range (in set point %)
– steady-state error - moving average weight](https://image.slidesharecdn.com/zanderdiss-130217192436-phpapp02/85/Zander-diss-102-320.jpg)
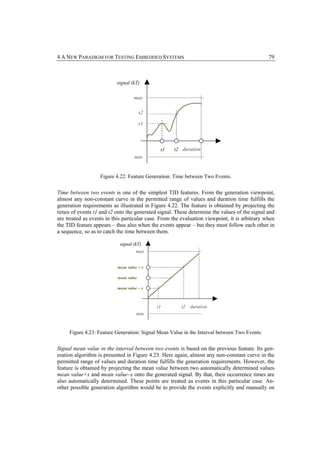
![80 4 A NEW PARADIGM FOR TESTING EMBEDDED SYSTEMS
the curve by preserving the mean value of interest. Numerous other features alike and combina-
tions of them are possible.
The response delay can be measured in a situation when an input step is applied on a stabilized
system. The time needed for a system to respond is the delay. In the evaluation system the reset
signal becomes active at the time of step occurrence – it being the decisive factor for any rela-
tions with other features.
A generation algorithm for a complete step will be described in Section 5.5 as it exploits the
concept of test reactiveness. It can be extracted by analyzing a step and the signal right before
the step, which must be constant. The situation becomes even more complex when a steady
state of a system is considered. In that case, both SUT input and output signals should be con-
stant for a minimum time, before the step eventually appears.
The detection of a complete step can be used to analyze the system step response, since it in-
cludes all preconditions necessary for the correct measurement of the step response characteris-
tics. The step response is widely used for the description of the behavior of control systems.
A common step response of a second-order linear system 28 is drawn in Figure 4.24. Here four
characteristics of the step response are marked. The upper plot shows the corresponding step
signal causing the step response below.
In the following paragraphs, the step response characteristics will be defined, before some in-
depth insight is given into the implementation of the actual feature generation and extraction.
Hence, the rise time (tr) is defined as the time the system response needs to get from 10% to
90% of the set point yss after the step. Thus, a short rise time will mean a rapid system response
to the new input situation. Shorter rise times are commonly associated with a larger maximum
overshoot, i.e., the step response shoots over the actual target. For the maximum overshoot
many different definitions are used. A widespread one defines it as a percentage of the set point
as:
M p − y ss (4.4)
y ss
where Mp is the step response value at the maximum peak.
A further step response parameter is the settling time. It indicates how long it takes to leave the
transient state and thus reach the steady state. In practical terms, this is the time between the
input step and the last time point when the signal crosses into a user-defined tolerance range
around the set point. Finally, the steady-state error provides information about the final devia-
tion of the signal from the expected reference value (r) in the steady state. Before this deviation
can be measured it must be assured that the steady state has been reached. Further step response
characteristics such as the delay time or the peak time will not be considered in this work.
28
Second-order linear systems are the simplest systems that exhibit oscillations and overshoot [Kuo03].](https://image.slidesharecdn.com/zanderdiss-130217192436-phpapp02/85/Zander-diss-104-320.jpg)
![4 A NEW PARADIGM FOR TESTING EMBEDDED SYSTEMS 81
a) u (kT)
kT
ts
b) y (kT)
yss + d
r yss
0.9·yss yss - d
Maximum ess = yss - r
overshoot
0.1·yss
tr kT
Figure 4.24: Reaction on a Step Function:
a) A Step Function – u(kT).
b) Step Response Characteristics y(kT): rise time (tr), maximum overshoot,
settling time (ts) and steady-state error (ess).
Generation of a step response is of lower practical importance than its evaluation as usually the
controller outputs are to be checked and not produced. However, a proposal for a simple gen-
eration will be introduced for reasons of completeness. It is realized as a MATLAB (ML)
script. It is based on adjusting the damping ratio and natural frequency 29 assuming that one unit
step is applied at the input.
The simplest second-order system satisfies a differential equation of this form [Kuo03,
EMC+99]:
d2y dy
+ 2ζω n + ωn y = GDCωn u (t )
2 2
2
(4.5)
dt dt
where:
− y(t) – response of the system
− u(t) – input to the system
− ζ – damping ratio
− GDC – DC (direct current) gain of the system
− ωn – undamped natural frequency
29
A normalized step response computed as a result of adjustment of the considered parameters can be animated by accessing
the dedicated web page of University of Hagen: http://www.fernuni-hagen.de/LGES/playground/miscApplets/ Sprungant-
wort.html [04/30/2008].](https://image.slidesharecdn.com/zanderdiss-130217192436-phpapp02/85/Zander-diss-105-320.jpg)
![82 4 A NEW PARADIGM FOR TESTING EMBEDDED SYSTEMS
The parameters determine different aspects of various kinds of responses. Whenever an impulse
response, step response, or response to other inputs is concerned, the following relations apply
[Kuo03, EMC+99]:
− ωn will determine how fast the system oscillates during any transient response
− ζ will determine how much the system oscillates as the response decays towards steady
state
− Gdc will determine the size of steady-state response when the input settles out to a con-
stant value.
Deriving the response ys(t) to a step of unit amplitude, the forced differential equation is:
d 2 ys dy
+ 2ζω n s + ωn ys = u s (t )
2
2
(4.6)
dt dt
where us(t) is the unit step function.
To illustrate, the solution obtained for the equation (4.6), where ζ = 1, is:
ys (t ) =
1
ωn 2
[1 − e −ω n t
− ωnte −ω n t ] for ζ = 1. (4.7)
The second-order system step response is a function of both the system damping ratio ζ and the
undamped natural frequency ωn. For damping ratios less than one, the solutions are oscillatory
and overshoot the steady-state response. In the limiting case of zero damping the solution oscil-
lates continuously about the steady-state solution yss with a maximum value of ymax = 2yss and a
minimum value of ymin = 0, at a frequency equal to the undamped natural frequency ωn. As the
damping is increased, the amplitude of the overshoot in the response decreases, until at critical
damping ζ = 1, the response reaches steady-state with no overshoot. For damping ratios greater
than unity, the response exhibits no overshoot, and as the damping ratio is further increased the
response approaches the steady-state value more slowly.
Manipulating the damping ratio and natural frequency enables different graphs with various
characteristics to be obtained. The possible step responses of stable second-order systems are
plotted in Figure 4.25 in terms of non-dimensional time ωnt and normalized amplitude y(t)=yss.](https://image.slidesharecdn.com/zanderdiss-130217192436-phpapp02/85/Zander-diss-106-320.jpg)
![4 A NEW PARADIGM FOR TESTING EMBEDDED SYSTEMS 83
Figure 4.25: Step Response of Stable Second-Order System for Different Damping Ratios.
Then, the realization of an online extraction algorithm for the step response characteristics in
SL is a more complex task due to their dependency on the input signal. It has been originally
proposed by [MP07]. Starting with the extraction of the newly introduced reset signal the im-
plementation is presented in Figure 4.26. The reset signal is common to all four considered fea-
tures and it becomes active whenever a step appears under the condition that SUT input and
output have been constant for some time. The memory block in Figure 4.26 is necessary to de-
lay the result of this extraction by one unit.
Figure 4.26: Reset Signal Extraction for Step Response Evaluation.
The diagram checking if both signals are constant for some user-specified time is shown in
Figure 4.27. The TDD feature extraction block time since signal constant has been utilized
twice; the minimum of both TDD features delivers the time since both signals were constant. If](https://image.slidesharecdn.com/zanderdiss-130217192436-phpapp02/85/Zander-diss-107-320.jpg)
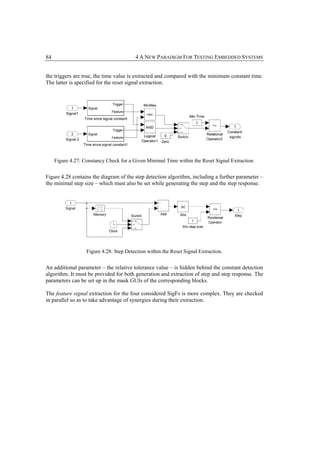
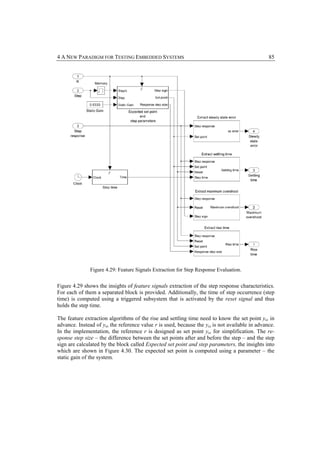
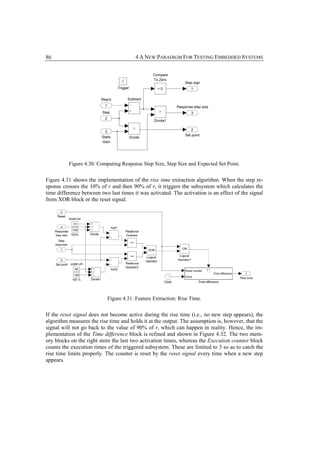
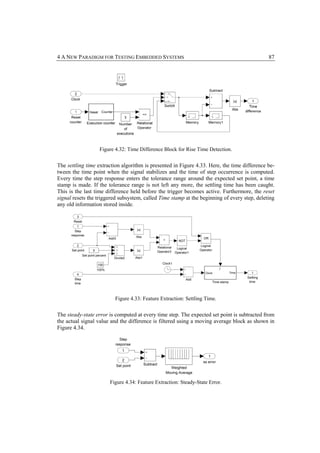
![88 4 A NEW PARADIGM FOR TESTING EMBEDDED SYSTEMS
The extraction of the maximum overshoot is more complicated and the implementation details
are left out of the scope in this description. They can be found in the work of [MP07].
Finally, also the trigger signal must be computed so as to let the evaluation mechanism work
properly. The trigger for the steady-state error is activated when the step response has stabi-
lized and the SUT input signal has not changed its value after the step. These constraints also
guard the termination of the extraction algorithms for the other three features. For checking
them, the algorithm presented previously in Figure 4.27 is used in combination with the TI fea-
ture detect increase for detecting the rising step. With this practice, the trigger signal becomes
active for only one time step. Additionally, the steady-state error should remain within a cer-
tain range so as to guarantee that the proper stabilization has been reached. The trigger algo-
rithm is shown in Figure 4.35.
Figure 4.35: Extraction of Trigger Signals.
To sum up, generation of the TID features is relatively similar for TI and TDD features since
only more parameters appear, making the implementation not exceptionally difficult. Their
evaluation, however, needs three types of signals for the proper extraction: feature, trigger and
reset. Such an approach reduces the complexity, which otherwise becomes large.
4.3 The Resulting Test Patterns
Test patterns [VS04] can effectively facilitate the automation, reusability, and maintenance of
the test specification process if used appropriately. Hence, cost, time, and resources planned for
the development of quality assured embedded systems decrease.
In this work the patterns for test harness, test data generation, test specification, SigF genera-
tors, SigF extractors, test evaluation, and test control are discussed. Their realization is provided
in MiLEST library.
[Bert07] argues that any good testing practices need to be collected by a systematic effort so as
to organize recurring effective solutions into a catalog of test patterns, similarly to what is now
a well-established scheme for design approaches. Such a test pattern extraction [VS04] is the
process of abstracting from existing problem-solution-benefit triples in the test developing
process, to obtain patterns suitable for reuse in future contexts. Although the process of going
through existing test artifacts and trying to identify patterns for later reuse might appear costly
and unrewarding at first sight, it pays off in the long term [VS04]. This argumentation espe-
cially applies to the testing of embedded software, where reusability of some common test pro-](https://image.slidesharecdn.com/zanderdiss-130217192436-phpapp02/85/Zander-diss-112-320.jpg)
![4 A NEW PARADIGM FOR TESTING EMBEDDED SYSTEMS 89
cedures is appreciated. The test patterns provide means for test system developers to focus more
on what to test and less on the notation itself. With this practice, they simplify the test devel-
opment process, increase the level of automation and facilitate the understandability of the test.
The patterns proposed in this thesis support both a manual and an automated test generation
approach as [Neu04, PTD05] discuss. In a manual development approach, a developer can re-
use patterns. An automated approach may benefit from an automatic identification of patterns
so as to provide further solutions for the revealed issue [Neu04].
The already discussed features classification reveals that the features themselves follow some
patterns. The realization of features generation and extraction constitutes the lowest abstraction
level of the test data, test evaluation, and test oracle patterns. Further on, test control patterns
are distinguished in the proposed approach. A test control is a specification for the invocation
of test cases assuming that a concrete set of test cases within a given test configuration exist.
Hence, the considered patterns can in fact be seen as parametrizable libraries. However, the
customization possibility makes them more abstract than a library is in a traditional meaning. In
[PTD05] a variant of patterns called idiom is considered. Idioms provide solutions for general
problems arising using a certain executable programming language. In that sense, whenever
ML/SL/SF is understood as a programming language, the test patterns presented in this thesis
can be considered as such idioms because they are implemented in this language; however, they
will be called test patterns here. All the mentioned test patterns present abstract solutions for
generic problems. They are instantiated in MiLEST and summarized in Appendix B and will be
explained in detail in further sections.
The test design patterns are provided in a graphical form. Thus, the textual table-form templates
suggested by [Bin99] are not used. Instead, it is assumed that a short explanation of a graphical
user interface (GUI) for each pattern block is informative enough to express its meaning, con-
text and the application sense.
4.4 Test Development Process for the Proposed Approach
The signal generation and signal evaluation in isolation, no matter how sophisticated, neither
test the system automatically nor make testing systematic or completed. These activities as such
should be embedded in a clear and well-defined test process. Moreover, an appropriate frame-
work has to deliver easy means for test specification, generation, and execution. For these rea-
sons a method specific test development process is introduced in this section and a hierarchical
architecture of the resulting test system in Chapter 5. Both are facilitated by application of test
patterns in different constellations.
The origin of any test specification is the document that specifies the SUT requirements. Usu-
ally, they are available in a textual form. System requirements are often hierarchical, starting
from high level, down to concrete technical specification. In some cases formalized versions are
provided. From such textual documents, test requirements (here also called test objectives)
should be derived. According to the general test process these can be classified as a set of the](https://image.slidesharecdn.com/zanderdiss-130217192436-phpapp02/85/Zander-diss-113-320.jpg)
![90 4 A NEW PARADIGM FOR TESTING EMBEDDED SYSTEMS
abstract 30 test scenarios. These test scenarios can be described by a conditional form which re-
lates incoming SUT stimulation to the resulting SUT behavior by IF–THEN rules (4.8).
A technically-oriented MiLEST test development process proposed in this thesis is shown in
Figure 4.36. The MBD paradigm assumes that the SUT model is already available and that the
input/output interfaces are clearly defined and accessible.
Besides the analysis of the SUT specification, a proper functional, dynamic testing also requires
a systematic selection of test stimuli, appropriate test evaluation algorithms, and obviously a
test execution or simulation environment. Thereby, if the above assumptions hold, pattern for
the generation of test harness 31 model can be applied to the SUT model as denoted by step I in
Figure 4.36. This is done automatically with a MiLEST transformation function, giving an ab-
stract frame for test specification. This phase together with the definition of IF-THEN rules is
called the test design. Further on, the test specification and test implementation phase is carried
out in step II, where the test definition in MiLEST is concretized based on the test require-
ments. The test engineer manually refines the test specification using the concept of validation
function patterns, which include the test scenarios. This issue has been already mentioned in
Chapter 3 and will be explained later in depth too. Afterwards, in step III, structures for test
stimuli and concrete test signals are generated. This step occurs automatically with application
of the transformations. The test control design can be added automatically too. In that case, step
IV would be omitted. However, if the advantages of the test reactiveness are targeted, it should
be refined manually. Finally, in the test execution and test evaluation phase in step V, the tests
(i.e., test cases) may be executed and the test results obtained in the form of verdicts. At the
same time the quality of the produced test system specification is also assessed.
SUT as a Model
automatic generation – step I
Test Harness Pattern Application
manual refinement – step II
Test Specification
automatic generation – step III
Test Data Generation
manual refinement – step IV
Test Control Generation
automatic execution – step V
Verdicts Analysis
Figure 4.36: Test Development Process.
30
An abstract test scenario means that it is valid for a certain generic description of the SUT behavior, without including the
concrete data.
31
In [ISTQB06] a test harness is defined as a test environment comprised of stubs and drivers needed to execute a test. In
this thesis, the test harness pattern refers to the design level and is specified as an automatically created test frame includ-
ing the generic hierarchical structure for the test specification. Together with the test execution engine (i.e, SL engine) it
forms a test harness.](https://image.slidesharecdn.com/zanderdiss-130217192436-phpapp02/85/Zander-diss-114-320.jpg)
![4 A NEW PARADIGM FOR TESTING EMBEDDED SYSTEMS 91
In Figure 4.37, a generic pattern of the test harness is presented. The test data (i.e., test signals
produced for the test cases) are generated within the test data generator shown on the left-hand
side. The test specification, on the right-hand side, is constructed by analyzing the SUT func-
tionality requirements and deriving the test objectives from them. It includes the abstract test
scenarios, test evaluation algorithms, test oracle, and an arbitration mechanism. The structural
details and functionalities of the corresponding units will be elaborated in the next chapter 32.
InOut
Test Data SUT Bus Test Verdict
Generator Specification
Test
test reactiveness
Control
Figure 4.37: A Test Harness Pattern.
The test specification is built by applying the test patterns available in the MiLEST library. It is
developed in such a way that it includes the design of a test evaluation as well – opposite to a
common practice in the automotive domain, where the test evaluation design is considered last.
Afterwards, based on the already constructed test model, the test data generators are retrieved.
These are embedded in a dedicated test data structure and are derived from the test design
automatically. The generation of test signals variants, their management, and their combination
within a test case is also supported, analogous to the synchronization of the obtained test stim-
uli. Finally, the SUT model stimulated with the previously created test data is executed and the
evaluation unit supplies verdicts on the fly.
The first step in the test development process is to identify the test objectives based on the SUT
requirements. For that purpose a high-level pattern within the test specification unit is applied.
The number of test requirements can be chosen in the graphical user interface (GUI) that up-
dates the design and adjusts the structural changes of the test model (e.g., it adjusts the number
of inputs in the arbitration unit). The situation is illustrated in Figure 4.38.
32
Parts of the test process have been published in [ZSM07b], the test evaluation in [ZSM06, MP07], the test signals genera-
tion in [ZMS07a, ZXS08], whereas the test control and reactive testing in [Zan07]. This thesis is the most up to date and
presents the most current progress.](https://image.slidesharecdn.com/zanderdiss-130217192436-phpapp02/85/Zander-diss-115-320.jpg)
![92 4 A NEW PARADIGM FOR TESTING EMBEDDED SYSTEMS
a)
b)
Figure 4.38: A Pattern for the Test Requirement Specification.
a) Instantiation for One Test Requirement.
b) Instantiation for Three Test Requirements.
Next, validation functions (VFs) [ZSM06, MP07] are introduced to define the test scenarios,
test evaluation, and test oracle in a systematic way. VFs serve to evaluate the execution status
of a test case by assessing the SUT observations and/or additional characteristics/parameters of
the SUT. A VF is created for any single requirement according to the conditional rules:
IF preconditi ons set THEN assertions set (4.8)
A single informal requirement may imply multiple VFs. If this is the case, the arbitration algo-
rithm accumulates the results of the combined IF-THEN rules and delivers an aggregate ver-
dict. Predefined verdict values are pass, fail, none, and error. Retrieval of the local verdicts for
a single VF is also possible.
A preconditions set consists of at least one extractor for signal feature or temporally and logi-
cally related signal features, a comparator for every single extractor, and one unit for precondi-
tions synchronization (PS).
An assertions set is similar, it includes, however, at least one unit for preconditions and asser-
tions synchronization (PAS), instead of a PS.
VFs are able to continuously update the verdicts for a test scenario already during test execu-
tion. They are defined to be independent of the currently applied test data. Thereby, they can set
the verdict for all possible test data vectors and activate themselves (i.e., their assertions) only if
the predefined conditions are fulfilled.
An abstract pattern for a VF (shown in Figure 4.39) consists of a preconditions block that acti-
vates the assertions block, where the comparison of actual and expected signal values occurs.
The activation and by that, the actual evaluation proceeds only if the preconditions are fulfilled.](https://image.slidesharecdn.com/zanderdiss-130217192436-phpapp02/85/Zander-diss-116-320.jpg)
![4 A NEW PARADIGM FOR TESTING EMBEDDED SYSTEMS 93
Figure 4.39: Structure of a VF – a Pattern and its GUI.
The easiest assertion blocks checking time-independent features are built following the schema
presented in Figure 4.40.
Figure 4.40: Assertion Block – a Pattern.
They include a SigF extraction part, a block comparing the actual values with the expected ones
and a PAS synchronizer. Optionally, some signal deviations within a permitted tolerance range
are allowed. Further schemas of preconditions and assertions blocks for triggered features are
discussed in [MP07] in detail.
A further step in the test development process is the derivation of the corresponding structures
for test data sets and the concretization of the signal variants. The entire step related to test data
generation is completely automatic by merit of the application of transformations. Similar to the
test specification side, the test requirements level for the test data is generated. This is possible
because of the knowledge gained from the previous phase. The pattern applied in this step is
shown in Figure 4.41.
Figure 4.41: Test Requirement Level within the Test Data Unit – a Pattern.
Moreover, concrete SigFs on predefined signals are produced afterwards. The test signals are
generated following a conditional rule in the form (see 4.9):
IF preconditi ons set THEN generation s set (4.9)](https://image.slidesharecdn.com/zanderdiss-130217192436-phpapp02/85/Zander-diss-117-320.jpg)
![94 4 A NEW PARADIGM FOR TESTING EMBEDDED SYSTEMS
Knowing the SigFs appearing in the preconditions of a VF, the test data can be constructed
from them. The preconditions typically depend on the SUT inputs; however, they may also be
related to the SUT outputs at some points in time. Every time a SigF extractor is present for the
assertion activation, a corresponding SigF generator may be applied for the test data creation.
Giving a very simple example: for detection of a given signal value in a precondition of a VF, a
signal crossing this value during a default time is required. Apart from the feature generation,
the SUT output signals may be checked for some constraints if necessary (cf. Figure 4.42). The
feature generation is activated by a Stateflow (SF) diagram sequencing the features in time ac-
cording to the default temporal constraints (i.e., after(time1)). A switch is needed for each SUT
input to handle the dependencies between generated signals. Initialization & Stabilization block
enables to reset the obtained signal so that there are no influences of one test case on another.
Figure 4.42: Structure of the Test Data Set – a Pattern.
The patterns in Figure 4.42 and the concrete feature generators are obtained as a result of the
automatic transformations. The general principle of the transformation is that if a given feature
or feature dependency extraction is detected in the source (i.e., preconditions part of a VF),
then the action to generate the target (i.e., feature generator in the test data structure) is per-
formed. A set of transformation rules has been implemented. Afterwards, the concrete test data
variants are constructed based on the generators obtained from the transformations. The as-
sumption and necessary condition for applying the variants generation method is the definition
of the signal ranges and partition points on all the stimuli signals according to the requirements
or engineer’s experience. Equivalence partitioning and boundary value analysis are used in dif-
ferent combinations to then produce concrete variants for the stimuli.
When a test involves multiple signals, the combination of different signals and their variants
have to be computed. Several combination strategies are known to construct the test cases –
minimal combination, one factor at a time, and n-wise combination [LBE+04, GOA05]. Combi-
nation strategies are the selection methods where test cases are identified by combining values
of different test data parameters according to some predefined criteria. In this thesis, the first
two strategies have been used.
A similar sequencing algorithm like for the test data applies for ordering the test cases on a
higher hierarchy level while dealing with a number of requirements. This aspect is called test
control. A traditional understanding of the control makes it responsible for the order of test
cases over time [ETSI07]. It may invoke, change, or stop the test case execution due to the in-
fluence of the verdict values coming from the test evaluation. Thus, the test cases are sequenced
according to the previously specified criteria (e.g., pass verdict). An extended definition of the
test control is considered in Section 5.5.
The test patterns used for realizing a test specification proposed in this thesis are collected in a
library and can be applied during the test design phase. In Table 4.4 two patterns are presented,](https://image.slidesharecdn.com/zanderdiss-130217192436-phpapp02/85/Zander-diss-118-320.jpg)
![4 A NEW PARADIGM FOR TESTING EMBEDDED SYSTEMS 95
each of them corresponding to a selected testing activity. Since they will be applied in the case
studies part in Section 6.4, their meaning will be explained afterwards. The full collection of
MiLEST patterns enabling the entire test system to be built is attached to this thesis in Appen-
dix B.
Table 4.4: Illustration of Reasoning about Patterns.
Test Test Pattern Context Problem Solution
Activity Name Instance
Test Detect SigF Test of a control Assessment of a control unit behavior in
evaluation unit terms of a selected SigF
Test data Generate Evaluation of a Generation of the proper signal to stimu-
generation SigF step response late a selected feature on the SUT output
function signal
After the test specification has been completed, the resulting test design can be executed in SL.
Additionally, a report is generated including the applied test data, their variants, test cases, test
results, and the calculated quality metrics.
4.5 Related Work
4.5.1 Property of a Signal
Property of a signal, called SigF in this thesis, has been introduced in hybrid Sequence Charts
notation [GKS99] used for describing the behavior of hybrid systems. The language is based on
Message Sequence Charts [ITU96, ITU99], including some concepts of timing diagrams
[ABH+97]. Already there, the signal has been partitioned according to its characteristics and
constraints put on it. This technique will be recalled in Chapter 6 to illustrate some of the de-
veloped concepts.
[GW07] indicates that the descriptive approach to the signals reveals some advantages over the
commonly-used constructive approach, especially in the context of SUT behavior evaluation.
Here, an obvious link to the test evaluation in MiLEST exists.
Further on, the consortium developing the Testing and Test Control Notation (TTCN-3) for
embedded systems [Tem08] incorporates the paradigm of SigF into the ongoing research on the
test assessment functions.
Finally, the timing relations between signals classified in [GHS+07] contribute to the develop-
ment of temporal expressions within the test specification proposed in MiLEST.
4.5.2 Test Patterns
Referring to the test patterns, [Bin99] describes object-oriented test strategy patterns. They
handle several strategies to derive test cases for testing object-oriented software. However, this
definition cannot be adapted in this thesis as object orientation is out of its scope. [Din08]
elaborates a set of methods and patterns to design and implement efficient performance tests.
These are also only related to the test patterns presented in this thesis. In [Neu04] Real-Time](https://image.slidesharecdn.com/zanderdiss-130217192436-phpapp02/85/Zander-diss-119-320.jpg)
![96 4 A NEW PARADIGM FOR TESTING EMBEDDED SYSTEMS
Communication patterns are used in the form of time relations among communication opera-
tions. They describe real-time requirements related to delay, throughput, periodic events, and
jitter. These patterns are applicable to the telecommunication systems mainly.
[Neu04] also presents a detailed survey through test patterns regarding a number of criteria.
According to his classification the proposed patterns are categorized as functional in the context
of the test goals, as test design patterns in the sense of the test development and as component
level considering the scope of testing.
[TYZ+03] argue that developers often specify embedded systems using scenarios and a typical
medium-size system has hundreds of thousands of scenarios. Each scenario requires at least one
test case, which in turn requires individual development and debugging. Verification patterns
(VP) are proposed to address this problem. The VP approach classifies system scenarios into
patterns. For each scenario pattern (SP), the test engineer can develop a template to test all the
scenarios that belong to the same pattern. This means that the engineer can reuse the test tem-
plates to verify a large number of system scenarios with minimum incremental cost and effort.
Each scenario has preconditions (causes), postconditions (effects), and optional timing con-
straints. A SP [TYZ+03] is defined as a specific temporal template or cause-and-effect relation
representing a collection of requirements with similar structures. A VP [TYZ+03] is a prede-
fined mechanism that can verify a group of behavioral requirements that describe similar sce-
narios. A GUI-based specification tool to facilitate the scenario specification is available. In this
work the focus is put on the test specification patterns, which mainly relate to the test behavior
similarly to [TYZ+03]. However, both discrete and continuous signals are handled, while
[TYZ+03] addresses only scenarios describing discrete behavior.
4.6 Summary
In this chapter the second set of the research questions given in the introduction to this thesis
has been addressed. In particular, a new way for handling the discrete and continuous signals at
the same time, based on the SigFs, has been provided. By that, a first sketch of the test frame-
work realizing this concept has been given, indicating the design decisions in terms of test gen-
eration and test evaluation.
The main technical intention of this chapter was to introduce a new way of signal description
by application of the SigFs. These have been discussed in Section 4.1. Further on, based on the
previous assumptions, Section 4.2 introduced the classified means for signal generation and
signal detection. The challenges and limitations of the realization have been discussed.
In Section 4.3, test patterns have been investigated, with a particular emphasis on the hierarchi-
cal architecture of the proposed test system. The MiLEST test patterns have been attached to
this thesis as a table in Appendix B. These will be carefully reviewed in Chapter 5 and applied
to a number of case studies in Chapter 6.
Furthermore, Section 4.4 elaborated on the proposed test specification process and its develop-
ment phases starting from requirements analysis until the test execution. Finally, the related
work on SigFs and test patterns has been described in Section 4.5.
The detailed discussion on the test development process artifacts will be continued in Chapter
5.](https://image.slidesharecdn.com/zanderdiss-130217192436-phpapp02/85/Zander-diss-120-320.jpg)
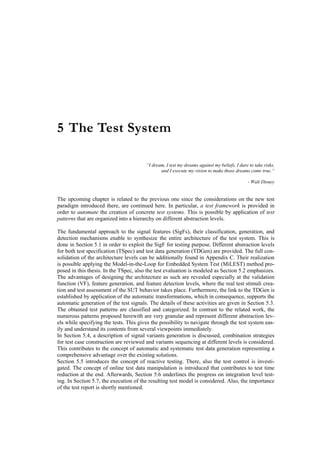
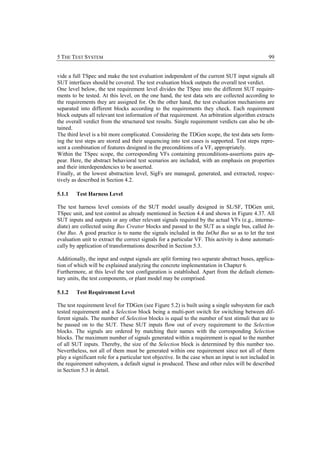
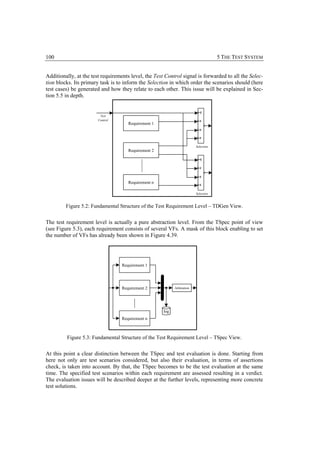
![5 THE TEST SYSTEM 101
At the test requirement level, the InOut Bus coming from the test harness level is passed to each
requirement subsystem, which in turn, lets the test system to evaluate the SUT and collect the
assessment information, including verdicts and arbitration mechanism.
The test results of all requirements are logged using the signal logging capabilities of SL. Tech-
nically, the pin after the Bus Creator block in Figure 4.38 indicates that the signal values are
logged to the MATLAB (ML) workspace during the simulation. The logged signals include all
information about the test assessment. Hence, the log file size depends on the size of the entire
test evaluation system. All abstraction levels can be identified in the logged structure.
Figure 5.4 additionally shows the implementation of an arbitration algorithm. It determines the
global overall verdict from all local verdicts of the VFs. As a matter of example, three local
verdicts are passed on. The minimum among the local verdicts constitutes the global, i.e., over-
all one.
Figure 5.4: Arbitration Mechanism.
The arbitration algorithm is based on the minimum computation, because the verdicts are de-
fined in descending priority (cf. the last paragraph of Section 5.1.4). The feedback Memory
block enables the algorithm to retain the worst verdict found to date. Thus, the overall verdict
equals to pass if any local verdict has been at least once pass and no local verdict has been fail
or error during the test. An important implementation detail is that the initial output value of the
Memory block must be set on a value not less than two (in contrast to the standard value that is
zero). Otherwise one for pass or two for none can never be reached. The value of the overall
verdict once set on a lower case, will it never come back on the upper case.
Additionally, from the technical perspective, the data type conversion for the InOut Bus is sup-
ported at this level (cf. Figure 4.38). Signal Conversion block is applied for automatically cast-
ing the data types of all signals of a bus to the format required by the destination blocks.
The requirement blocks in the test requirement level, for both TDGen and TSpec views should
be named, which improves the readability and enables a straightforward tracing to the textual
requirements. This option is technically supported by several interfaces between requirements
tools and SL/SF 33.
33
The requirements tracing [SLVV] is possible using the Requirements Management Interface for Telelogic DOORS® soft-
ware [TelD] or selection-based linking for Microsoft® Word and Excel® documents – to name the two examples.](https://image.slidesharecdn.com/zanderdiss-130217192436-phpapp02/85/Zander-diss-125-320.jpg)
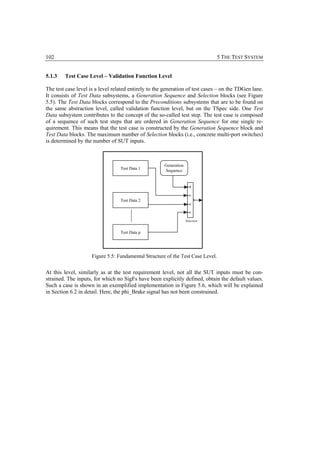
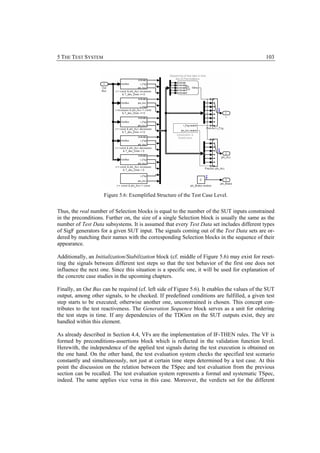
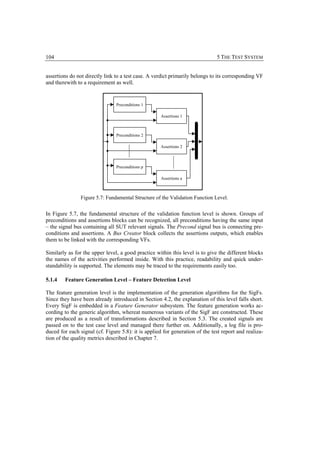
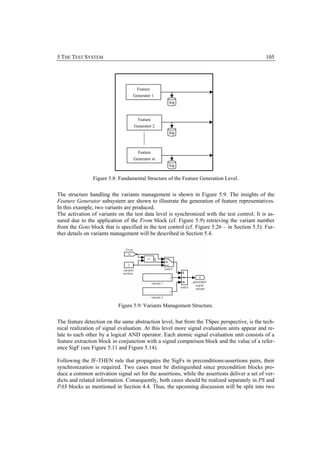
![106 5 THE TEST SYSTEM
topics: the realization of preconditions and assertions. Before, a short description of the syn-
chronization algorithm assumption will be given. The granular implementation details concern-
ing the mechanism for both elementary parts of the feature detection level can be found in
[MP07] (pages: 55 – 66 and 71 – 83, respectively).
Detection of TI features can be modeled as an identification of TDD features that are triggered
at every time step. Respectively, detection of TDD features can be described as the extraction
of TID features that have a constant delay as shown in Figure 5.10. This principle is utilized in
the implementation of the synchronization algorithm. Firstly, the detection mechanisms of all
features are transformed to the most complex form including A, T, and R signals. Then, a
common activation signal bus is generated; it is built from the feature, trigger, and reset signals
and a mode signal indicating what kind of feature description has been applied – TI, TDD, or
TID. The assertions are only activated at these time steps when all preconditions are active
[MP07].
Identification mechanism using Identification mechanism using
trigger signal – T trigger signal – T ,
Identification mechanism using and activate signal – A,
activate signal – A. activate signal – A. and reset signal – R.
R
T
A kT
T
converted to A kT converted to
kT
A kT
kT
kT
Figure 5.10: Conversions of the identification mechanisms for TI – TDD and TDD – TID features.
Test Specification: Feature Detection Level: Preconditions. The feature detection level for
the preconditions is structured as shown in Figure 5.11. In the schematic structure only TI fea-
tures are considered, since the extraction blocks only output a feature signal. In the implemen-
tation, however, the trigger (T), and reset signals (R) can be utilized by the PS block for syn-
chronization too.](https://image.slidesharecdn.com/zanderdiss-130217192436-phpapp02/85/Zander-diss-130-320.jpg)
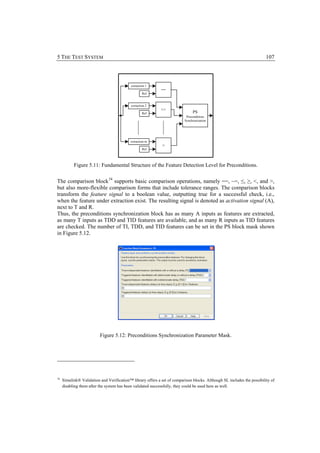
![108 5 THE TEST SYSTEM
When TI or TDD features are extracted, their delays have to be specified using a vector nota-
tion. They need to be provided in simulation steps, i.e., x seconds delay would be introduced in
the form of x * time step size delay.
The basic functionality that must be covered by the PS block will be illustrated using the exam-
ple presented in Figure 5.13, introduced initially by [MP07]. Therein, the extracted signals of
five different features are shown (Figure 5.13, cases a to e). The first feature represents constant
detection, the second one – step detection with a 5 units delay. The next figure shows the time
when a signal crosses a value x (i.e., extraction of the time stamp of an event). The fourth fea-
ture identifies the local maximum of value x with a unit delay. The last feature measures some
step response characteristic. Given this concrete situation, the task of the PS block is to deliver
the activation information to the assertion block (cf. Figure 5.13, case f).](https://image.slidesharecdn.com/zanderdiss-130217192436-phpapp02/85/Zander-diss-132-320.jpg)
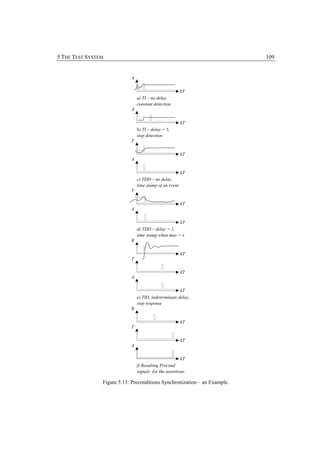
![110 5 THE TEST SYSTEM
Introduction of a delay presents the straightforward reasoning about A signal. Hence, taking the
features in Figure 5.13, cases a and b as an example, the feature identifiable with a shorter delay
must be fictitiously delayed by the delay difference, in order to filter the delay out. This time
shift guarantees that all features are evaluated at the same time. If the A signal in Figure 5.13b
is delayed by 5 time steps, both A signals will be triggered at the same time step. In conse-
quence, the maximum delay within the preconditions determines the size of the preconditions
delay. It is calculated using the formula:
∆τi = τmax – τi (5.1)
τmax = max(τi) represents the maximum delay among all the SigFs present in the preconditions.
Thus, the signals in Figure 5.13c need to be delayed by 5 time steps, whereas the signals in
Figure 5.13d needs to be additionally delayed by 4 time steps.
If a trigger signal is extracted, the preconditions become triggered automatically. Whenever the
triggered feature is not available, the preconditions are not available either, since they are all
related by the AND-operator. In that case, all TI features must be transformed to TDD features,
so that they obtain a fictitious T signal as well. Its value is the same as the value of A signal. A
TDD feature with identical T and A signal is equivalent to a TI signal.
Considering the TID features the situation is a bit more complex. In the case of having only one
precondition, whenever the R signal becomes true, the preconditions are potentially active.
Then, their real activation is confirmed only when T and A signals become active too. All three
signals, R, T, and A must be passed to the assertions, so as to inform them about both the poten-
tial and real activation.
Combinations of TID features only activate the preconditions if all their R signals become ac-
tive at the same time and the R signals then remain inactive until all T and A signals have be-
come active. Each T-A pair must become active simultaneously, but the delays of the different
T-A pairs do not have to be the same. If the T signal becomes active without the corresponding
activation of its A partner, the preconditions do not become active. A new activation of R re-
starts the synchronization process. Again, the highest delay applies for all preconditions. Com-
binations of TID features with TI or TDD features are managed by converting the latter to TID.
This is achieved by generating an R signal identical to the T signal of the TDD feature.
The R signal of TID features cannot be delayed. This limitation was introduced to reduce the
complexity of the synchronization algorithm, meaning that the extraction mechanism for the R
signal needs to be delay-free. When different feature types are combined, all three TID feature
description signals R, T, and A are delayed by the maximum [MP07].
Test Specification: Feature Detection Level: Assertions. The assertions at the feature detec-
tion level have the same structure as the preconditions, i.e., SigFs are extracted and related con-
junctively. Only when all preconditions are active, can the assertions be active.
However, if a large set of IF-THEN-rules is considered, it would be possible to find more than
one rule with exactly the same preconditions, but with different assertions. If these rules belong
to different requirements, the preconditions set will repeat in each rule. Such a case does not
have to be designed this way, but it appears to be a good practice for at least two reasons.
Firstly, the requirements may slightly change. As a result previously the same preconditions
would be altered too, which would consequently lead to their separation anyway. Secondly,](https://image.slidesharecdn.com/zanderdiss-130217192436-phpapp02/85/Zander-diss-134-320.jpg)
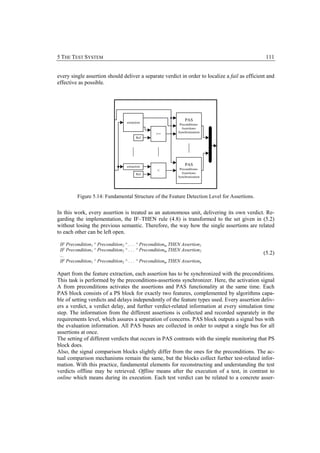
![112 5 THE TEST SYSTEM
tion, and in consequence, to the corresponding requirement and to a specific time step. Also, the
test behavior can be reproduced offline using the test evaluation system.
The verdicts that can be applied are:
− none (2) – when no other verdict can be set or when the preconditions are not active
− pass (1) – when the SUT functional behavior is correct
− fail (0) – when the SUT behavior does not correspond to the expected one
− error (−1) – when the test system contains errors (e.g., the PAS input signals have an
invalid format).
The arbitration mechanism has been described in Section 5.1.2 and illustrated in Figure 5.4.
There is a default arbitration algorithm. It is used while delivering the verdict for a single asser-
tion, a requirement evaluation, test case, or the entire test suite. Verdicts are ordered according
to the rule: none < pass < fail < error following the standard [UTP].
5.2 Test Specification
As introduced in Section 4.4 and explained in Section 5.1.3, a VF is the fundamental part con-
stituting the TSpec. Referring to the rule (4.8), the preconditions set and assertions set are pro-
positional variables that stand for any propositions in a given language. The preconditions set is
called the antecedent and the assertions set is called the consequent, while the statement as a
whole is called either the conditional rule or the consequence. Assuming that the conditional
statement is true then the truth of the antecedent (i.e., fulfilling the constraints in the precondi-
tions set) is a sufficient condition for the truth of the consequent (i.e., activation of the asser-
tions set), while the truth of the consequent is a necessary condition for the truth of the antece-
dent [Men97].
The conditional rule given in (4.8) is understood as an abstract test scenario describing a set of
preconditions that must be fulfilled so as to assess the expected behavior of the SUT (i.e., acti-
vate the assertions). Concretization of such a scenario at the VF level is also possible, but usu-
ally it is more effective to design more generic test specifications.
The main difficulty that the test engineer needs to overcome at this place is to create reasonable
IF-THEN statements from the SUT requirements so as to design flexible, high-quality tests.
Thus, some test modeling guidelines are provided in the following in order to clarify the proc-
ess of TSpec.
Generally, the rule holds that the preconditions should be determined by the constraints set on
the SUT input signals, whereas the assertions should check the SUT outputs. This is the natural
manner of understanding a test scenario, since the SUT inputs represent the test stimuli and the
SUT outputs need to be evaluated so as to assess the behavior of the SUT.
The point is, however, that sometimes complex structures appear where the inputs and outputs
cannot be separated. Hence, a few variants of a mixed version are allowed too. These are given
in the statements (5.3 – 5.6).
The situation that the SUT interfaces of both directions need to be constrained in the precondi-
tions part (cf. rules 5.3 – 5.4) happens when the tested SUT behavior can be activated only un-
der certain circumstances that occurred before and led the SUT to a particular state. This state is
then determined by the selected constraint on the SUT output.](https://image.slidesharecdn.com/zanderdiss-130217192436-phpapp02/85/Zander-diss-136-320.jpg)
![5 THE TEST SYSTEM 113
IF constrained_inputsn ^ constrained_outputsm THEN constrained_inputsn ^ constrained_outputsm (5.3)
IF constrained_inputsn ^ constrained_outputsm THEN constrained_outputsm (5.4)
IF constrained_inputsn THEN constrained_inputsn ^ constrained_outputsm (5.5)
IF constrained_inputsn THEN constrained_outputsm (5.6)
The combination of interfaces of both directions in the assertions part (cf. rules 5.3 and 5.5)
appears usually when some SUT output must be computed by application of the corresponding
stimulus (e.g., calculation of the braking torque based on the position of the brake pedal).
Combining the different options in such a way that either only constrained outputs occur in the
preconditions or only constrained inputs occur in the assertions is not allowed. The exclusive
presence of the constrained outputs in the preconditions implies that some behavior had already
happened before starting the considered scenario. By that, the scenario is dependent on some
other scenario. That is not a convenient practice for the proposed TSpec algorithms since the
test scenario should be possibly independent. Moreover, the test data cannot be generated
automatically from such preconditions applying the currently available transformations. It also
does not make sense to check the constrained inputs in the assertions since these are the SUT
stimuli, not the SUT execution results.
The impermissible variants are listed in the formulas (5.7 – 5.9). They should be reformulated
using modus tollens 35 or transposition 36 [Cop79, CC00] rules so as to adopt a valid form.
IF constrained_inputsn ^ constrained_outputsm THEN constrained_inputsn (5.7)
IF constrained_outputsn THEN constrained_inputsn ^ constrained_outputsm (5.8)
IF constrained_outputsn THEN constrained_inputsm (5.9)
35
In logic, modus tollendo tollens (Latin for "the way that denies by denying") [Cop79] is the formal name for indirect proof
or proof by contraposition (contrapositive inference), often abbreviated to MT or modus tollens. It can also be referred to
as denying the consequent, and is a valid form of argument (unlike similarly-named but invalid arguments such as affirm-
ing the consequent or denying the antecedent). Also known as an indirect proof or a proof by contrapositive [CC00]. Mo-
dus tollens has the following argument form:
If P, then Q.
¬Q
Therefore, ¬P.
Every use of modus tollens can be converted to a use of modus ponens and one use of transposition to the premise which is
a material implication. For example:
If P, then Q. (premise - material implication)
If Q is false, then P is false. (derived by transposition).
36
In the methods of deductive reasoning in classical logic, "transposition is the rule of inference that permits one to infer
from the truth of "A implies B" the truth of "Not-B implies not-A", and conversely" [Cop79]. Its symbolic expression is:
(P → Q) ↔ (~Q → ~P).](https://image.slidesharecdn.com/zanderdiss-130217192436-phpapp02/85/Zander-diss-137-320.jpg)
![114 5 THE TEST SYSTEM
In the cases when only the interfaces of the same directions are constrained in both precondi-
tions and assertions, respectively, as provided with the rules (5.10) and (5.11), the following
holds. (5.10) can be restructured to the equivalent, more reasonable version given in (5.12) in-
dicating that the test scenario should always be assessed, no matter what test stimuli have been
currently applied, whereas (5.11) does not make sense at all since it does not test any behavior
resulting from the SUT behavior.
IF constrained_outputsn THEN constrained_outputsm (5.10)
IF constrained_inputsn THEN constrained_inputsm (5.11)
IF true ^ any constraints THEN constrained_outputsn ^ constrained_outputsm (5.12)
Additionally, the construction of IF-THEN rules can be enriched with the logical connectives
and temporal expressions listed in Sections 4.1.3 and 4.1.4. Although not all of them have been
implemented, a few of them deserve a special attention. These are:
− OR – for the considerations on the alternative [ETSI07]
− during(x), after(y) as expressions of temporal dependencies between the SigFs.
The former one is implemented as an extension of the arbitration mechanism, whereas the latter
one is implemented as a workaround of the existing synchronization algorithms rather than
dedicated structures.
The alternative given in (5.13) determines alternative behavior of the SUT. Whenever A holds,
B or C or D should hold too. This statement is realized in MiLEST by an equivalent set of logi-
cal implications given in (5.14) providing that the arbitration mechanism is adjusted for this
particular case.
IF A THEN B
OR C (5.13)
OR D
}
IF A THEN B
IF A THEN C (5.14)
including the adjustment of the arbitration mechanism
IF A THEN D
Here, all the cases are executed and checked in parallel and the snapshot known from the
TTCN-3 alternative [ETSI07] does not have to be taken at all. Instead, it is enough to adjust the
arbitration mechanism so as to add the semantic of the disjunction. Following the example from
(5.13 and 5.14), if any assertion delivers a pass verdict, the entire logical implication passes as
well, whatever verdict is provided by the remaining assertions.
Then, taking the expression during(x) as an example of temporal dependencies, the SF diagram
enables to control the activation of the features in time by manipulating the signals. Considering
the scenario provided in (5.15):
IF A THEN during(x) B, (5.15)](https://image.slidesharecdn.com/zanderdiss-130217192436-phpapp02/85/Zander-diss-138-320.jpg)
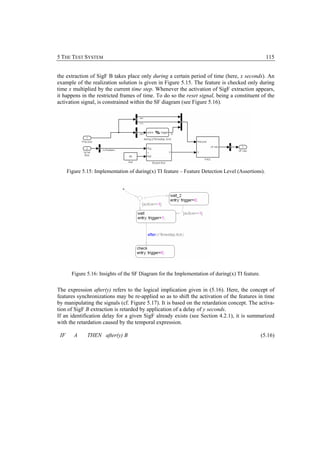
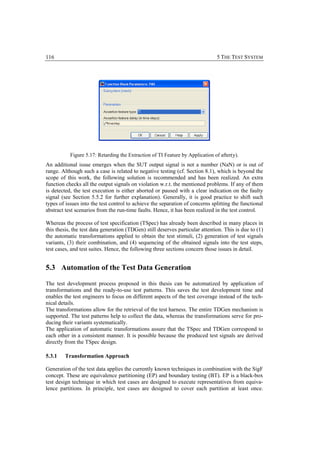
![5 THE TEST SYSTEM 117
Equivalence partitioning assumes that all values within any individual partition are equivalent
for a selected test purpose [ISTQB06]. BT does not only select one value from the partition
points, but boundary values. The test data variants are established for each SigF separately,
based on a dedicated algorithm.
Basically, the problem of test stimuli generation can be divided into a set of problems classified
according to different activities:
(1) Transformation:
− Generation of the structure for the test data based on the preconditions from validation
functions
− Generation of the abstract SigFs generators
(2) Preparation of test signals generation:
− Establishing the ranges of the SUT input and output signals
− Establishing the partition points for every signal
(3) Generation of concrete test signals:
− Generation of signal variants based on the selected algorithms depending on the SigF
type
(4) Combination of the obtained test signals and their sequencing:
− Combination of signal variants according to the chosen strategy for test automation
− Sequencing of the test signals over time in a test case or in a test suite
− Manual refinement if needed (e.g., when there exists a functional relation between the
test cases)
The transformation is defined as a mechanism for transforming the elements of a model con-
forming to a particular metamodel into elements of another model that conforms to another
metamodel [CS03, BSK04]. The test data generation is realized using ML scripts, the meta-
models are not directly necessary (cf. Section 5.8.2 of this chapter). The abstract objects of the
SL/SF model are already available thanks to its comprehensive API.
5.3.2 Transformation Rules
The concrete high-level implementation rules applied in the prototype are listed below:
− Before the transformation begins, all necessary libraries must be loaded
− The link to the MiLEST library for all blocks added to the test model should be dis-
abled in order to manipulate their parameters within this model
− For each SUT a test harness must be built
− The data types of all generated signals should inherit from the types specified for them
in the SUT model and consequently in VFs
− The names of all generated Inport blocks at the source and signal lines connecting them
with the SUT should match
− The structure of the TestData must be consistent with the MIL_Test/Test Data/Test
Data Architecture/<Test data generator> from the library
− The simulation parameters in the resulting test model inherit the ones in the source
model
− After a successful transformation the new test model is saved automatically](https://image.slidesharecdn.com/zanderdiss-130217192436-phpapp02/85/Zander-diss-141-320.jpg)
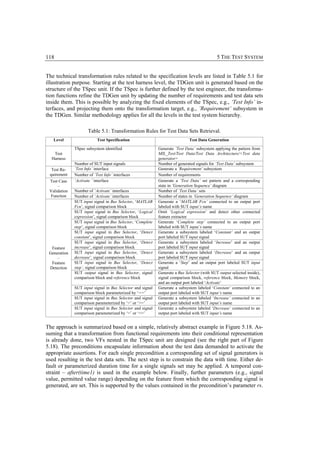
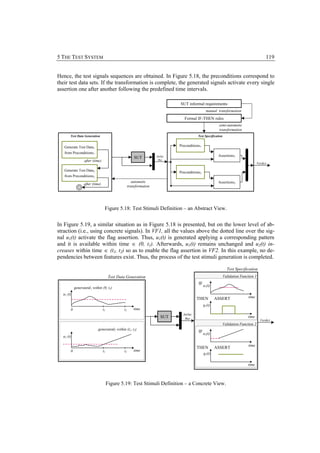
![120 5 THE TEST SYSTEM
5.4 Systematic Test Signals Generation and Variants Management
5.4.1 Generation of Signal Variants
The test data are the test signals which stimulate the SUT to invoke a given behavioral scenario.
In the approach proposed here, a particular set of SigF generators produces selected signals for
particular test cases.
The concrete variants of the test signals are provided based on the generation patterns discussed
in Section 4.2. The variants generation method can be applied if the signal ranges and partition
points have been defined on all the stimuli signals according to the requirements or engineer’s
experience.
Partitioning the range of inputs into groups of equivalent test data aims at avoiding redundant
testing and improving the test efficiency and coverage. The situation is becoming even more
complex when hybrid systems are considered since their signals vary continuously in value and
time. However, in this work only values are partitioned, they relate to the signal characteristics.
It is due to the fact that the SigF generation as such is already implicitly based on the time parti-
tioning concept (cf. Figure 4.2). The duration time of a feature is taken as default unless no
temporal expressions are included.
Practitioners often define equivalent classes intuitively, relying primarily on case studies. The
success of this method depends on the tester’s experience and his subjective judgments.
Another option is to specify the equivalence [Bur03] based on the requirements. This approach
depends on the fact of whether the specification provides sufficient details from which the
equivalence classes and boundaries could be derived.
At least three different methods can be used to choose the representatives of the equivalence
class, namely random testing, mean value testing, and boundary testing.
Dedicated blocks, called signal range and partition points are provided for every SUT input and
output interfaces in order to let the test engineer set the boundaries. Three types of such
boundaries are distinguished. These result from the applied data type, the signal range, and
specific partition points.
Data type boundaries are determined by the lower and upper limit of the data type itself (see
Figure 5.20A). They are limited by its physical values. For example, the lower limit of tempera-
ture is absolute zero (i.e., 0 K or -273.15˚ C); an unsigned 8-bit value has the range from 0 to
255.
The range of the signal belongs to the data type range and it is specific for the SUT (see Figure
5.20B). For example, if water is the test object, water temperature is the input to the SUT; test
data for water may be specified to be between 0˚ C and 100˚ C.
Finally, the partition points (see Figure 5.20C) are of concern since they constitute the specific
values of critical nature belonging to the signal range.](https://image.slidesharecdn.com/zanderdiss-130217192436-phpapp02/85/Zander-diss-144-320.jpg)
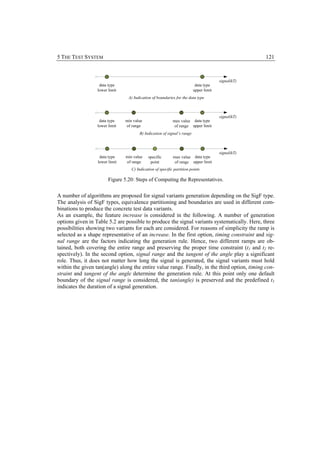
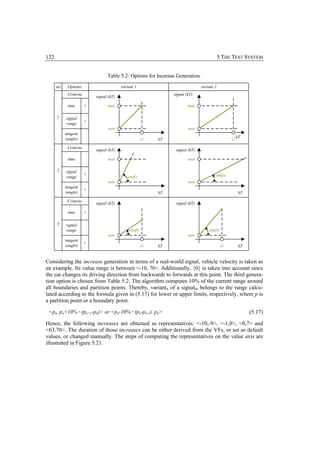
![5 THE TEST SYSTEM 123
A)
-10 70 velocity(kT)
B)
-10 0 70 velocity(kT)
v1 v2 v3 v4
C)
-10 -9 -1 0 7 63 70 velocity(kT)
Figure 5.21: Steps of Computing the Representatives for Vehicle Velocity.
Firstly, the boundaries of the range are identified (step A) resulting in a set {-10, 70}. Then, all
risk-based partition points are included (step B) resulting in value {0}. They are derived from
the specification or the test engineer’s experience. The increase ranges are calculated and the
variants in those ranges are generated (step C) as given below. Finally, durations of the features
are added on the time axis.
v1 ∈ <-10, -10+10% · (0-(-10))> ≡ <-10, -9>
v2 ∈ <0-10% · (0-(-10)),0> ≡ <-1, 0>
v3 ∈ <0, 0+10% · (70-0)> ≡ <0, 7>
v4 ∈ <70-10% · (70-0),0> ≡ <63, 70>
The example discussed above is an instance of an explicit partition, when a single signal is in-
volved in the partitioning process. Additionally, implicit partitions appear when the SUT input
signals are put in a mathematical relation with each other. In such a case, both sides of the
equation (or inequality) are considered. Taking the inequality given below as an example, gen-
eration of variants for the relation of two SigFs A and B, on the left, depends on the variants for
SigF C, and vice versa.
A–B>C
Hence, firstly the right-hand side partitions for C are produced. Then, the variants for A and B
on the left-hand side are generated in such a way that the inequality for the representatives of C
is valid. Later on, the procedure is repeated for the left-hand side SigFs, whereat the redundant
cases are deleted.
In MiLEST not only SUT input partitioning, but also SUT output partitioning [FDI+04] is ap-
plied. This enables (1) to verify the power of the equivalence partitions built for the SUT input
signals and (2) to improve the test data generator. The procedure is similar to the input parti-
tioning. This time, the ranges of SUT output signals are defined and their partition points are
identified. Alternatively, the type of SigFs constraining the output in the assertions may be
taken into account. Then, after the test execution, it is checked whether the expected results of
the test cases cover all possible equivalence partitions of the SUT output. If this is not the case,
additional test stimuli are designed so as to cover the missing values.
5.4.2 Test Nomenclature
Summarizing the approach in terms of the nomenclature given in Sections 5.1 – 5.4, the follow-
ing definitions are provided. The generated test signals create the behavior of a test case. Test](https://image.slidesharecdn.com/zanderdiss-130217192436-phpapp02/85/Zander-diss-147-320.jpg)
![124 5 THE TEST SYSTEM
case is a set of input values, execution preconditions, expected results, and execution postcon-
37
ditions, developed for a particular test objective so as to validate and verify compliance with a
specific requirement [ISTQB06].
A test step is derived from one set of VFs preconditions. It is related to the single scenario de-
fined in the VF within the TSpec unit. Thereby, it is a basic, non-separable part of a test case.
The test case can be defined as a sequence of test steps dedicated for testing one single re-
quirement. Obviously, if only one VF is defined for a given requirement within a TSpec, the
test step corresponds to the test case. Otherwise, a test case consists of as many test steps as
VFs exist for a single requirement. Hence, the number of test cases is the same as the number of
requirements multiplied by the maximal number of variants constructed for the feature genera-
tors within this single requirement.
W.r.t. the architecture of the test system, the test step corresponds to the so-called Test Data set,
whereas the test case is composed of a sequence of such test steps within one single require-
ment block. This means that the test case is constructed by the Generation Sequence block and
Test Data blocks. By that, the traces to the requirements are implicitly obtained.
A test suite is a set of several test cases for a component or SUT, where the postcondition of
one test is often used as the precondition for the next one [ISTQB06]. The specification of such
dependencies takes place in the test control unit in the proposed test framework.
The concept of a test suite according to the definition given in [ISTQB06] is particularly impor-
tant in the context of integration level test, where the test cases depend on each other. Other-
wise, if no relations are noted, a test suite is simply a collection of ordered test cases.
5.4.3 Combination Strategies
When a test involves multiple signals, which is usually the case, the combination of different
signal variants should be established. In the proposed framework, the combination is done at
the test case level. In particular, the generated variants of SigFs in one test step (i.e., in one Test
Data set block) are combined. Technically, this is possible by manipulating the numbers pass-
ing to the switch present at the feature generation level so as to control the application of fea-
ture generators. Several combination strategies to construct the test cases are known, e.g.,
minimal combination, one factor at a time, and n-wise combination 38 [LBE+04, GOA05]. Com-
bination strategies are used to select a subset of all iterations of different variants of test signals
based on some coverage criterion. In the following, three combination strategies are discussed.
However, the implementation attached to this thesis realizes the first two only.
Minimal combination, denoted as A++B means that each class in A and B is considered at least
once [LW00, CDP+96]. It iterates every interface and ends with the last variant. This one is held
until other input variants iteration ends. Figure 5.22 illustrates the iterations based on three in-
puts. Only two iterations are obtained because every input has two variants. Each of them ap-
pears once in a combination. The error detection coverage is not satisfactory for this method,
though.
37
Test objective is a reason or purpose for designing and executing a test.
38
Further combinations strategies are random combination, which does not support reliable test coverage [CDP+96, LBE+04,
Con04a] or complete (maximum) combination, which leads to exhaustive testing.](https://image.slidesharecdn.com/zanderdiss-130217192436-phpapp02/85/Zander-diss-148-320.jpg)
![5 THE TEST SYSTEM 125
Minimal combination
SUT Inputs
x1 x2 x3
X1.1 X1.2 X2.1 X2.2 X3.1 X3.2
iterations[n]
time [units]
1 t0
2 t1
Figure 5.22: Minimal Combination.
One factor at a time method uses a default normal condition as the starting point. Then, in the
next iteration only one parameter at a time is changed, under the assumption that there is no
interaction between parameters. Figure 5.23 presents the iterations based on this method.
One factor at a time combination
SUT inputs
x1 x2 x3
X1.1 X1.2 X2.1 X2.2 X3.1 X3.2
1 t0
iterations[n]
time [units]
2 t1
3 t2
4 t3
Figure 5.23: One Factor at a Time Combination.
For n-wise combination [CDP+96, LBE+04, GOA05] every possible combination of n classes is
selected at least once. A special case of n-wise combination is a pair-wise combination. Here,
orthogonal arrays [Man85, GOA05] may be applied. Figure 5.24 illustrates a situation when
the iterations are constructed by 2-wise combination. Three inputs with two variants match the
orthogonal arrays. Compared to the ‘one factor at a time method’, this one computes the same
amount of iterations. Nevertheless, the iterations based on the orthogonal array a stronger abil-
ity to find errors [CDP+96].](https://image.slidesharecdn.com/zanderdiss-130217192436-phpapp02/85/Zander-diss-149-320.jpg)
![126 5 THE TEST SYSTEM
Pair-wise combination
SUT Inputs
x1 x2 x3
X1.1 X1.2 X2.1 X2.2 X3.1 X3.2
1 t0
iterations[n]
time [units]
Column
n
1 2 3
2 t1
1 1 1 1
2 1 2 2
3 t2
3 2 1 2
4 2 2 1
4 t3
Figure 5.24: Pair-wise Combination.
5.4.4 Variants Sequencing
If the test data variants are calculated and the combination strategy has been applied, the test
cases can be established. Every set of SigF generators constitutes a test purpose for a test case.
All the sets together form a test suite and are sequenced in the test control. Before the details of
the test control are discussed, the sequencing of the test signals within the test data sets will be
explained. Every single generated signal is activated for a given predefined period of time. The
SigFs within one set need to be synchronized so that the timing is the same for all of them. The
SF diagram on the test data level called ‘Sequencing of test data in time due to Preconditions’
(Std) controls the activation of a given variants combination applying a predefined duration
time.
If there is no temporal constraint within the preconditions in a VF, the following timing issues
apply for the test data sequencing:
− Duration time of a test case execution (TCD) is equal to the duration time of the test
data set execution multiplied by the number of test data sets assuming that the duration
time of the test data set is fixed, otherwise the duration time of the test data sets are
summarized for a given test case.
− Duration time of a test data set generation includes the duration time of the selected
variant generation for a given set of SigFs and the transition time to the next test data
set (if any exists).
− Execution time of the entire test suite for a single combination of variants is equal to
the sum(TCD).
− Execution time of the entire test suite including all the combinations of variants (i.e.,
for the entire test design) is equal to the sum(TCD) multiplied by the maximum num-
ber of variants in all test data sets.](https://image.slidesharecdn.com/zanderdiss-130217192436-phpapp02/85/Zander-diss-150-320.jpg)
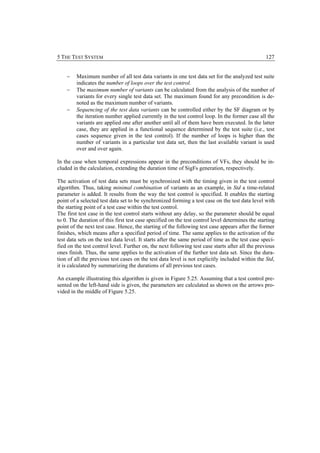
![128 5 THE TEST SYSTEM
Test Control Test Case Level
variant =1
Sequencing of
after(0,sec)
test case 1 test signals for
test case 1
after(40,sec)
Sequencing of
after(40,sec)
test case 2 test signals for
test case 2
after(40,sec)
after after(40+40,sec) Sequencing of
(120,sec) test case 3 test signals for
test case 3
variant= after(20,sec)
variant +1 Sequencing of
(Goto block) after(40+40+20,sec)
test case 4 test signals for
test case 4
Figure 5.25: Test Control and its Implication on the Test Data Sequencing.
This algorithm applies only to the first iteration within the test control. If more iterations are
needed (i.e., if more variant sets are applied for a particular test suite execution), a more com-
plex algorithm should be used depending on the number of iterations.
The test cases are executed one after another according to the sequence specified in the test
control. After execution of one set of variants for such a sequence the next set of variants is
chosen and consequently, the sequence including new test stimuli repeats.
5.5 Test Reactiveness and Test Control Specification
Test control is a specification for the invocation of test cases within a test context. Test configu-
ration is determined by the chosen SUT, the components, the initial parameters that must be set
to let this SUT run and a concrete test harness.
The test control in a traditional meaning is a concept widely known in the protocol testing, but
also discussed for testing automotive system [Con04b]. In this thesis, it is considered as a
means to achieve reactive testing. [Leh03] defines the test reactiveness as a reaction of the
TDGen algorithm on the SUT outputs during the test execution. In particular, the stimulation
mechanism in a test case reacts on a defined SUT state, instead of on a defined time point.
In this thesis, the definition of reactive testing is extended [Zan07]. Additionally, the TDGen
algorithm can be controlled by signals from the test evaluation system. Hence, not only can the
test cases’ execution be organized over time, but also the data generation may be influenced by
the verdict of the previous test case (as in [ETSI07]); the SUT outputs (as in [Leh03]) and by
other test evaluation signals (e.g., reset, trigger, activation). Loops and conditions can be used
to specify the execution order of individual test cases [ETSI07]. Depending on how the test
control is defined, it enables the inclusion/exclusion of only those test cases, which are/are not
of our interest at a particular moment.
Moreover, the signal generation becomes more flexible and supports major SUT changes with-
out needing to be parameterized again after each SUT update.](https://image.slidesharecdn.com/zanderdiss-130217192436-phpapp02/85/Zander-diss-152-320.jpg)
![5 THE TEST SYSTEM 129
Similarly to [Syn05] and [Leh03], a reactive test is defined as a test that is able to react to the
SUT behavior and adapt to the newly observed situation dynamically within one simulation
step during the execution. The test system is required to run synchronously to and simultane-
ously with the SUT model so that test actions can be performed using the same concept of time.
If during a test run an identifiable behavior is observed, then the test control decides on the fur-
ther test execution, i.e., if a strategic test case fails, the current test control algorithm is acti-
vated. A test may either be aborted, provide a warning, invoke/redefine another desirable test
case, or change the sequence and range of the applied test data, etc.
5.5.1 Test Reactiveness Impact on Test Data Adjustment
The process of TDGen can be impacted by different factors. The design principles listed in
Table 5.3 refer to different reactiveness scenarios that enhance an automatic TDGen. A name of
a method indicates its application context, whereas an example is a solution proposal.
Principle no. 1.1 has been identified in [Leh03]. The TDGen depends on the SUT outputs as
discussed by [Leh03]. A set of non-reactive test cases for different SUT variations can be speci-
fied as a single reactive test suite that automatically adapts itself to the actual variation. Princi-
ple no. 1.2 enhances systematic concrete test data retrieval by parameter adjustment. Principle
no. 1.3 refers to the situation when the internal signals of the test evaluation influence the test
data.
Table 5.3: Test Data Generation Dependencies.
no. Test Data Generation – Design Principles Influenced by
Name: Use an SUT output value to compute the test data.
Example: If an SUT output reaches certain value, then perform further
1.1 SUT Output
action within the TDGen algorithm.
This concept is realized by [Leh03].
Name: Use verdict value for parameter sweep within the TDGen proc-
ess.
Example: If verdict of test case X = none, then change the value of a
1.2 particular parameter within the test data (e.g., the signal range) to meet Verdict
the appropriate coverage of signal range.
Note that the last value of the refined parameter must be stored to make
the test repeatable.
Name: Compute the temporal dependencies of SigF generation within
the TDGen process. Termination of
Example: If trigger signal T appearing in the test evaluation unit indi- the validation
1.3 cates that a single feature has already been assessed, then start generat- process for a
ing a new variant of this feature (e.g., complete step generation) at this selected SigF
particular time point.
A classic example of the application of principle no. 1.3 application is the generation of differ-
ent step functions for the measurement of the step response characteristics. If the signal genera-
tion algorithm knows when the SUT output has stabilized and a verdict has been established, it
neither outputs a second step too early – eliminating the possibility of an incorrect measurement](https://image.slidesharecdn.com/zanderdiss-130217192436-phpapp02/85/Zander-diss-153-320.jpg)
![130 5 THE TEST SYSTEM
– nor too late – preventing wasting important testing time. Moreover, the signal generation be-
comes flexible and supports major SUT changes without needing to be parameterized again
after each SUT update [MP07]. For example, every single step function represents one variant
of a step.
The test engineer decides about the arrangement of test signals or test cases using predefined
constraints. For that purpose a number of predefined generic conditions that may be applied by
a tester to constrain the test control, is provided. These are:
− if signal =, <, <=, >=, >, ~= value
− if signal =, <, <=, >=, >, ~= value @ time (e.g., if signal = value @end time of a test)
− if signal = value @ [time1, time2] || (time1, time2) || [time1, time2) || (time1, time2]
where: @ – at,
|| – means logical or.
The signal can be replaced by a concrete instantiation:
− local verdict or overall verdict – value range ∈ {pass; fail; none; error}
− evaluation trigger, reset signal – value range ∈ {1,0}
− SUT output signal – value range ∈ {flows, features, strings, numbers, etc.}.
The resulting examples are, respectively:
− if evaluation trigger = 1
− if local verdict = none at 6th second
− if local verdict = pass in the interval between (3,5) seconds.
5.5.2 Test Control and its Relation to the Test Reactiveness
In Table 5.4 a number of factors influencing the test control and different scenarios including
those factors are introduced. The scenarios are denoted as test control principles. They refer to
different reactiveness paths and support an automatic execution of a test. They are elicited
based mainly on the experience gained by testing the adaptive cruise control (ACC). Principle
2.1 presents the case when the SUT output range overflow is used to decide about the further
progress of the test execution. If an SUT output involved in a test case appears to be out of an
allowed range, the execution of this test case should be stopped or paused (cf. Section 5.2). Ad-
ditionally, at least all the test cases where this particular signal is involved in the validation
process should not be executed before the SUT is fixed.
As previously mentioned, a name of a principle indicates its application context, whereas an
example is a solution proposal.](https://image.slidesharecdn.com/zanderdiss-130217192436-phpapp02/85/Zander-diss-154-320.jpg)
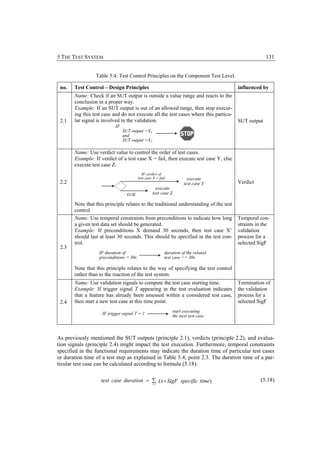
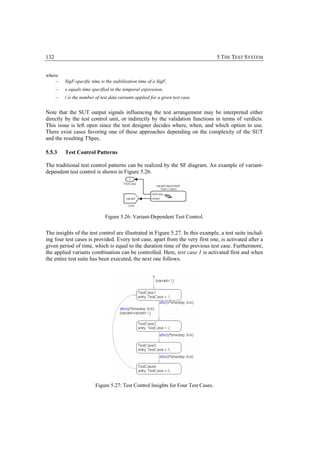
![5 THE TEST SYSTEM 133
Additionally, in Figure 5.26, the number of currently applied variant is forwarded into Goto
block. Such a design of the test control enables to set the corresponding variants on the test data
level. There, a block called From (cf. Figure 5.9) receives the variant number from the Goto
block.
The test control patterns facilitated by the reactive testing concept are usually application spe-
cific. Thus, the realization example and an explanation will follow in Section 6.3.
5.6 Model Integration Level Test
Analyzing the integration level test the cross-cutting nature of functionality and failures occur-
rence is considered. This enables quality assurance (QA) to be approached in terms of interact-
ing services, which is a potential candidate for dealing with the integration problems
[EKM+07]. Service-orientation means, in this context, a design paradigm that specifies the crea-
tion of automation logic in the form of services. A service itself is a cross-cutting functionality
that must be provided by the system. Like other design paradigms, it provides a means of
achieving a separation of concerns [All06]. The services are sometimes also referred to as sys-
tem functions or functionalities in the automotive domain. Services identify partial behaviors of
the system in terms of interaction patterns [Krü05, EKM06, BKM07]. Based on the interactions
between services the test specifications are developed.
5.6.1 Test Specification Design Applying the Interaction Models
The analysis of the system starts at the requirements level, where features and functions of new
software within a car [KHJ07] are described. The requirements are used as a basis for interac-
tion models. These models present the behavior between different software parts. In the follow-
ing the extended Message Sequence Charts (MSCs) [ITU99, Krü00] combined with the hybrid
Sequence Charts (hySC) [GKS99], called hySC for testing (hySCt), are applied as a modeling
technique. With this practice, both discrete and continuous signals exchanged between the
components, can be expressed. Such hySC can be advantageously used in the early phases of
the development process, especially, in the requirements capture phase. The interacting compo-
nents are specified as the roles and the functional relations between them are the services.
In the upcoming paragraphs the syntax and some semantics extensions of [Krü00] (as compared
to traditional MSCs [ITU96, ITU99] combined with the semantics given by [GKS99] are ap-
plied. In particular, (1) arrows to denote events are used. Then, (2) angular box denotes condi-
tions on the component’s variables suggested by [GKS99]. A pair consisting of an arrow and an
angular box defines (3) the conditions (i.e., states defined by a set of signal feature (SigF)) be-
ing mainly a result of sending the information continuously. This enables the notation for con-
tinuous behavior to be clarified. However, the semantics remains the same as [GKS99] defined:
(4) a continuous global clock exists and an abstract time axis is available for each component.
The components occurring in the sequence charts are connected by channels along which in-
formation exchange occurs. It is possible that more than one signal (i.e., message) appears si-
multaneously (5). The dashed vertical lines are used to denote simultaneous signals appearance.
A simple example is given in Figure 5.28. Also, (6) triggers, (7) parallel signal receiving, (8) an
alternative, and (9) local timers are available. These are specified in [ITU99]. It is left open
which concrete modeling dialect should be used in the future.](https://image.slidesharecdn.com/zanderdiss-130217192436-phpapp02/85/Zander-diss-157-320.jpg)
![134 5 THE TEST SYSTEM
The resulting hySCts are translated to the MiLEST syntax and semantics. Hence, the hySCts are
transformed to the VFs and interpreted in terms of their execution.
Role 1 Role 2 Role 3
Role 1 informs Role 2
about its state
message 1
state 1
message 2
message 3
state 2
Figure 5.28: Basic hySCt.
The hySCts are the interaction models representing the services as shown in Figure 5.28. A ser-
vice is defined by the interaction of its roles. In an interaction, a role represents the participa-
tion of a system entity in an interaction pattern. Between roles, different information can be
exchanged. These are: a message, an event, a continuous signal, or a reference to another ser-
vice. Compound interaction elements consist of a number of interaction elements composed by
operators. Instances of operators are sequence, loop, alternative, parallel, and join, representing
sequential composition, repetition, choice, parallel, and join composition, respectively
[EKM06]. The state in an angular box indicates a condition and remains unchanged until a new
state appears. Please note that this interaction model abstracts from concrete notations – in the
context of this work a combination of selected modeling dialects has been used.
HySCts combined with the SigF paradigm introduced in Chapter 4 of this thesis enable the flow
of information (i.e., signals, events, messages) between different components (i.e., roles) to be
designed without specifying how this flow should be realized and how the components process
the inputs to produce valid outputs. This abstract design method is powerful enough for specify-
ing the integration level test. Further on, the resulting elements are incorporated into and exe-
cuted together with the SUT model.](https://image.slidesharecdn.com/zanderdiss-130217192436-phpapp02/85/Zander-diss-158-320.jpg)
![5 THE TEST SYSTEM 135
Preconditions Assertions
Role 1 Role 2 Role 3
message 1
state 1
message 2
Figure 5.29: HySCt including VFs Concepts.
In Figure 5.29, a simple example of a hySCt enriched with additional elements is given. In ref-
erence to the test specification, preconditions and assertions boxes being the constituents of a
VF are added at the top of the diagram so as to identify which information should be trans-
formed to the appropriate VF part. The dashed lines indicate the simultaneity.
Then, it is aimed to facilitate the retrieval of the running VFs from the hySCts. Hence, the boxes
called preconditions and assertions present at the hySCts diagrams are reused. They recall the
notion of the test specification. The role of each such VF, in this context, is to detect the SUT
failures. Every hySCt may result in one or more VFs depending on the complexity of the re-
quirement on which it was built and its own complexity.
5.6.2 Test Data Retrieval
At this point such a test specification can be utilized twofold: (1) as an information source for
the test data generator for further test design refinement; (2) to evaluate the SUT behavior dur-
ing the test execution (being the primary aim of a VF existence).
Since (2) has already been discussed in the previous sections of this thesis (cf. Section 4.4),
herewith more attention will be given to (1).
Applying the algorithms for test stimuli derivation as described in Sections 5.3 – 5.5 the redun-
dant test cases would be obtained. The redundancy (i.e., in the sense of duplication) is caused
by generating similar test data for different VFs because of the existence of similar precondition
sets. Additionally, it may happen that several VFs include exactly the same sets of pre-
preconditions, resulting from the hySCts, next to their original preconditions. This situation oc-
curs especially at the system integration level test when the previous test scenarios play a sig-
nificant role for the current test scenario. In that case, the test objective being checked at the
moment may only be reached when the SUT is brought to a predefined state.
Hence, as a solution to this problem, not only the VF’s preconditions, but also higher-level
hySCts (HhySCts) decide on the contents of generated test data sets. HhySCts are defined simi-
larly as high-level MSCs in [ITU99, Krü00]. They indicate sequences of, alternatives between,
and repetitions of services in two-dimensional graphs – the nodes of the graph are references to
hySCts, to be substituted by their respective interaction specifications. HhySCts can be trans-](https://image.slidesharecdn.com/zanderdiss-130217192436-phpapp02/85/Zander-diss-159-320.jpg)
![136 5 THE TEST SYSTEM
lated into basic hySCts without loss of information. Generally, the rule applies that only those
VFs, where the entire sequence of interactions within one single service is caught, should be
considered for the test data generation. If this is the case the number of the test data sets does
not match the number of VFs. In fact, the number of test data sets is less than the number of
VFs and it matches the number of services present in the higher-level hySCt. This is an advan-
tageous situation in terms of testing as all possible behavioral sequences are still covered and
the tests are not redundant.
Additionally, the sequences of the generated sets of the test data are obtained from the higher-
level hySCts by analyzing the paths of those charts are analyzed. The algorithm for obtaining
possibly lots of the meaningful sequences results from the white-box test criterion commonly
known as path testing [ISTQB06].
Further on, when the test data sets are set and their sequencing algorithms have been defined,
the automatic test data variants generation and their combination methods may be applied with-
out any changes as described in Sections 5.4 – 5.5.
5.6.3 Test Sequence versus Test Control
In this thesis, at the component level test, the single test case consists of several test steps. The
test control allows for specification of the execution order for such test cases including their
different variants. Hence, no additional concept for a test sequence is used.
At the integration level test the situation changes. Here the test sequence is derived from the
HhySCts. It includes a set of test cases that need to be executed in the order specified by this
sequence. Then, the test control enables to manage all the resulting test sequences and their
variants. An example of such circumstances will be given in Section 6.4.
5.7 Test Execution and Test Report
The test execution does not demand any further effort other than the simulation of any SL
model. The test assessment is already included in the test design, thus the verdicts are immedi-
ately obtained. This is possible due to the existence of the test oracle and arbitration mechanism
in the TSpec unit. Additionally, the quality metrics for evaluating the test model are calculated
and the test report is generated after the test execution (see Chapter 7).
Although producing the reports is rather an implementation issue, its basic design has been pro-
vided in this work and reports have been generated for the case studies presented in Chapter 6.
The MATLAB® Report Generator™ [MRG] and Simulink® Report Generator™ [SRG] are
used for defining and generating compact, customizable documents automatically after test
execution. They include the applied test data, their variants, test cases, test control, test results,
and the calculated quality measures. The presentation form is constituted by a number of tables,
plots of signals, graphs, verdict trajectories, and their textual descriptions [Xio08]. The generic
design of a report template enables it to be adapted to the actual test model and SUT configura-
tion. Technically, both report generation and test system need to be coordinated. Many func-
tions contribute to the report contents depending on the available models.
Before generating the test reports, the test results have to be recorded in the ML workspace.
Also, the verdicts need to be ordered according to the delays they were identified with during
the test so as to provide the test results in a correct manner.](https://image.slidesharecdn.com/zanderdiss-130217192436-phpapp02/85/Zander-diss-160-320.jpg)
![5 THE TEST SYSTEM 137
5.8 Related Work
The model-based test approaches have already been reviewed in Chapter 3. Similarly, related
work on properties of signals has been discussed in Section 4.5. However, a few issues deserve
a special attention since they either contribute to the results achieved in this thesis or constitute
the ongoing efforts that are based on the experience gained here.
5.8.1 Test Specification
Time Partitioning Testing (TPT) [Leh03] is the primary example using the concept of SigF in
an evaluation system. Although the test assessment is mainly offline – due particularly to the
real-time constraints at the HiL level – TPT concepts are a basis for the TSpec unit described in
this thesis.
Similarly, the Classification Tree Method [GG93] illustrates how to construct test stimuli sys-
tematically. Even if the realization proposed in MTest [Con04b] enables test data to be only
created manually, the concept constitutes the fundamental principles according to which the test
data generator embedded in TDGen unit is built.
Also, the synchronization mechanism for the test evaluation system of MiLEST realized in
[MP07] is a considerable contribution to this thesis. As discussed in Chapter 3, the transforma-
tions of [Dai06] contribute to the MiLEST automation. [SCB, EmbV] help to conceive of the
TSpec. [CH98, WCF02] underline the test evaluation problems. [SLVV] gives the technologi-
cal solution for building the prototype of MiLEST.
Further on, the progress achieved in MiLEST is the foundation for the ongoing efforts towards
UML Testing Profile for Embedded Systems (UTPes) [DM_D07, Liu08].
5.8.2 Transformation Possibilities
The background knowledge for the MiLEST transformations has been gained from the experi-
ence on Model Driven Architecture (MDA) artifacts [MOF] applied in the context of testing
[ZDS+05, CBD+06, GCF06, Dai06]. This practice enabled the creation of generic transforma-
tion functions that may be applied to any model 39.
The reasoning on the MDA-related transformation for testing proposed by [DGN04, Dai04,
Dai06] may be followed for the framework provided in this thesis in an analogue way. Figure
5.30 shows a layered metamodel hierarchy applicable to MiLEST. It has been resigned from
developing the detailed metamodels for both ML/SL/SF and MiLEST since the direct ML-
based solution appears to be feasible and performs well. The continuation of this topic, e.g.,
along the application of Query/View/Transformation (QVT) techniques is, however, not ex-
cluded from the future research as indicated in [ZSF06].
39
This is possible under the assumption that the guidelines given in Section 5.3 are followed.](https://image.slidesharecdn.com/zanderdiss-130217192436-phpapp02/85/Zander-diss-161-320.jpg)
![138 5 THE TEST SYSTEM
<<instance of>>
M3:
Meta-metamodel MOF Model
<<instance of>> <<instance of>> <<instance of>>
M2:
Metamodel Transformation Transformation
SL/SF MiLEST MiLEST
Metamodel Rules
TSpec Metamodel Rules TDGen Metamodel
<<instance of>> <<instance of>> <<instance of>>
M1:
Model Transformations Transformations
SL/SF MiLEST MiLEST
Model TSpec Model TDGen Model
<<instance of>> <<instance of>> <<instance of>>
M0:
Data MiLEST
SL/SF MiLEST
TSpec Instance
Instance TSpec Instance
including TDGen
Figure 5.30: The Metamodel Hierarchy of MiLEST.
5.9 Summary
In this chapter, the concepts of testing in MiLEST have been introduced and explained follow-
ing its development phases. Technically, MiLEST extends and augments SL/SF for designing
and executing tests. It bridges the gap between system and test engineers by providing a means
to use the SL/SF language for both SUT and test specifications, similarly to the way [Dai06]
did for the Unified Modeling Language [UML] world. Moreover, it allows for the reuse of sys-
tem design documents for testing. By that, the test development is early integrated into the
software production.
This chapter adresses the third set of the research questions given in the introduction to this the-
sis as well. It has been illustrated that the test development process can be automated by appli-
cation of test patterns and transformations. In particular, the test data and their systematically
selected variants can be generated automatically from the formerly designed test specification.
Then, the test control patterns can be applied. The manual workload during the test design
phase cannot be fully excluded, though. The concrete VFs must be added by the test engineer,
even if many hierarchically organized patterns for the test specification ease this process con-
siderably.
Regarding the test execution, the test evaluation runs automatically on the fly, which allows for
an immediate analysis of the test results. Test reports are obtained automatically as well.](https://image.slidesharecdn.com/zanderdiss-130217192436-phpapp02/85/Zander-diss-162-320.jpg)
![5 THE TEST SYSTEM 139
In particular, in this chapter, the classification of signal features presented in Chapter 4 has been
recalled to describe the architecture of the test system. In Section 5.1, different abstraction lev-
els of the test system have been provided. They were denominated by the main activities per-
formed at each level. The test harness level includes patterns for TSpec, TDGen, and test con-
trol. Then, the test requirements level has been followed by test case and validation function
levels. Afterwards, the feature generation and feature detection have been elaborated on. In Ap-
pendix C, an overview of all the hierarchy levels is given. Also, different options for the speci-
fication of a test have been reviewed, revealing the challenges and limitations of the test design.
The importance of the test evaluation has been emphasized. Furthermore, principles for the
automatic generation of test data have been presented. By means of the concrete generic trans-
formation rules, the derivation of test signals from the VFs has been formalized. Similarly, the
generation of signal variants has been investigated. Combination strategies for test case con-
struction have been outlined and sequencing of the generated variants at different levels has
been reported. The concepts of reactive testing and of test control have been summarized too.
Section 5.6 presents considerations on the integration level testing. An advantage of using the
ML/SL/SF framework is the possibility to execute both the system and test models. Thus, in
Section 5.7, the test execution and test reporting have been discussed.
Finally, in Section 5.8, related work on test design, transformation approaches, and ongoing
work towards UTPes [DM_D07, Liu08] have been elaborated.](https://image.slidesharecdn.com/zanderdiss-130217192436-phpapp02/85/Zander-diss-163-320.jpg)

![6 Case Studies
“To every action there is always opposed an equal reaction.”
- Isaac Newton
In this chapter, an analysis of the Adaptive Cruise Control (ACC) [Con04b] is presented. Its
requirements and some further details are provided in Section 6.1. The ACC controls the speed
of the vehicle while maintaining a safe distance from the preceding vehicle. ACC divided into
different functional units forms more case studies. By that, three examples are elicited: pedal
interpretation, speed controller, and ACC. They demonstrate the application of the concepts
presented in the previous chapters of this thesis according to the Model-in-the-Loop for Em-
bedded System Test (MiLEST) method.
The test development process is illustrated for all the case studies; however, every time another
test aspect is investigated. For the first two examples, a similar presentation scheme is followed,
although the emphasis is put on different steps of the process. Testing the pedal interpretation
component gives insights into the specification of concrete validation functions (VFs), test data
generation algorithms for them and the test control arranging the obtained test cases applying
the minimal combination strategy. In the test specification for the speed controller, the VFs are
defined as first. Then, the test reactiveness concept on the level of test data and test control is
exploited. In the third example, the details of testing at the model integration level are addition-
ally provided. Here, besides the VFs, specific interaction models are provided and the test se-
quences in relation to the test control are explicitly considered.
Regarding the structure of this chapter, in Section 6.2, the pedal interpretation as an instance of
an open-loop system is introduced. There, the main concepts of the test data generation algo-
rithms are discussed. In Section 6.3, the speed controller as a representative of a closed-loop
electronic control unit (ECU) is investigated. In this part, the attention is given to the test con-
trol and test reactiveness. Then, in Section 6.4, the model integration level test concepts are
reviewed in the context of ACC functionality. Section 6.5 finishes this chapter with a summary.
6.1 Adaptive Cruise Control
The ACC controls the speed of the vehicle while maintaining a safe distance from the preceding
vehicle. There are two controllers within the ACC: a speed controller and a distance controller.
Both operate in a loop in conjunction with the vehicle.](https://image.slidesharecdn.com/zanderdiss-130217192436-phpapp02/85/Zander-diss-165-320.jpg)
![142 6 CASE STUDIES
The speed controller of an ACC measures the actual vehicle speed, compares it with the desired
one and corrects any deviations by accelerating or decelerating the vehicle within a predefined
time interval. Afterwards, the vehicle velocity should be maintained constant, if the desired
speed does not vary.
If the vehicle approaches a car traveling more slowly in the same lane, the distance controller
recognizes the diminishing distance and reduces the speed through intervention in the motor
management and by braking until the predefined ‘safe’ distance has been reached. If the lane is
clear again, ACC will accelerate to the previously selected desired speed.
When the deceleration performed by ACC is not sufficient because another car suddenly cuts
out in front, ACC requests the driver through acoustic signals to additionally apply the brakes
manually as [Con08] specifies. If the speed drops below 11 m/s because of the traffic, ACC will
automatically turn off. In Table 6.1 a set of ACC requirements is given in a more condensed
manner.
Table 6.1: Selected Requirements for Adaptive Cruise Control.
ID Requirements on ACC
1 The ACC controls the speed of the vehicle while maintaining a safe distance from the preceding
vehicle. There are two controllers within the ACC: a speed controller and a distance controller.
2 The speed controller measures the actual vehicle speed, compares it with the desired one, and
corrects any deviations by accelerating or decelerating the vehicle within a predefined time inter-
val.
3 If the desired velocity is considerably changed, the controller should react and adapt the vehicle
velocity. This happens within a certain time due to the inertial characteristics of the velocity,
which is related to the vehicle dynamics.
4 Afterwards, the vehicle velocity should be maintained constant, if the desired speed does not vary.
5 If the vehicle approaches a car traveling more slowly in the same lane, the distance controller
recognizes the diminishing distance and reduces the speed through intervention in the motor man-
agement and by braking until the predefined ‘safe’ distance has been reached.
6 If the lane is clear again, ACC accelerates to the previously selected desired speed.
7 If the deceleration performed by ACC is not sufficient because another car suddenly cuts out in
front, ACC requests the driver through acoustic signals to additionally apply the brakes manually.
8 If the speed drops below 11 m/s because of traffic ACC, automatically turns off.
9 If the braking action is undertaken, the ACC should switch off and the car should brake (velocity
should decrease) as long as the braking pedal is pressed.
10 If the ACC has been active before braking, it should not be reactivated when the braking action is
stopped.
11 If acceleration action is undertaken by a driver, the car should speed up.
12 If the ACC has been active before the acceleration, it should be reactivated when the acceleration
action is stopped.
13 The ACC can be activated when the velocity is higher than 11 m/s.
A realization of the ACC provided by Daimler AG is demonstrated in Figure 6.1. Different
components are responsible for different functionalities. Here, the loop between the ACC and a
vehicle can be observed. Also, the pedal interpretation component used later in Section 6.2 is
present there.](https://image.slidesharecdn.com/zanderdiss-130217192436-phpapp02/85/Zander-diss-166-320.jpg)
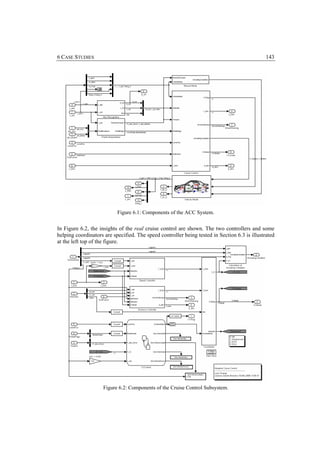
![144 6 CASE STUDIES
6.2 Component Level Test for Pedal Interpretation
This and the two following sections demonstrate the application of MiLEST concepts. Testing
the pedal interpretation component illustrates the process of VFs specification based on the se-
lected system requirements. Also, test data generation patterns and their corresponding variants
generation algorithms are given. Finally, the test control arranging the resulting test cases by
means of the minimal combination strategy is introduced.
A simplified component of the pedal interpretation of an ACC is being tested. This subsystem
can be employed as pre-processing component for various vehicle control systems. It interprets
the current, normalized positions of acceleration and brake pedal (phi_Acc, phi_Brake) by us-
ing the actual vehicle speed (v_act) as desired torques for driving and brake (T_des_Drive,
T_des_Brake). Furthermore, two flags (AccPedal, BrakePedal) are calculated, which indicate
whether the pedals are pressed or not. Some excerpts of its functional requirements are given in
Table 6.2, while the SUT interfaces are presented in Table 6.3 and in Table 6.4.
Table 6.2: Requirements for Pedal Interpretation (excerpt).
ID Requirements on pedal interpretation
1 Recognition of pedal activation
If the accelerator or brake pedal is depressed more than a certain threshold value, this is indicated with a
pedal-specific binary signal.
1.1 Recognition of brake pedal activation
If the brake pedal is depressed more than a threshold value ped_min, the BrakePedal flag should be set
to the value 1, otherwise to 0.
1.2 Recognition of accelerator pedal activation
If the accelerator pedal is depressed more than a threshold value ped_min, the AccPedal flag should be
set to the value 1, otherwise to 0.
2 Interpretation of pedal positions
Normalized pedal positions for the accelerator and brake pedal should be interpreted as desired torques.
This should take both comfort and consumption aspects into account.
2.1 Interpretation of brake pedal position
Normalized brake pedal position should be interpreted as desired brake torque T_des_Brake [Nm]. The
desired brake torque is determined when the actual pedal position is set to maximal brake torque
T_max_Brake.
2.2 Interpretation of accelerator pedal position
Normalized accelerator pedal position should be interpreted as desired driving torque T_des_Drive
[Nm]. The desired driving torque is scaled in the non-negative range in such a way that the higher the
velocity is given, the lower driving torque is obtained 40.
Table 6.3: SUT Inputs of Pedal Interpretation Component.
SUT Input Velocity Acceleration pedal Brake pedal
(v_act) (phi_Acc) (phi_Brake)
Value Range <-10, 70> <0, 100> <0, 100>
Unit m/s % %
40
A direct interpretation of pedal position as motor torque would cause the undesired jump of engine torque while changing
the gear while maintaining the same pedal position.](https://image.slidesharecdn.com/zanderdiss-130217192436-phpapp02/85/Zander-diss-168-320.jpg)
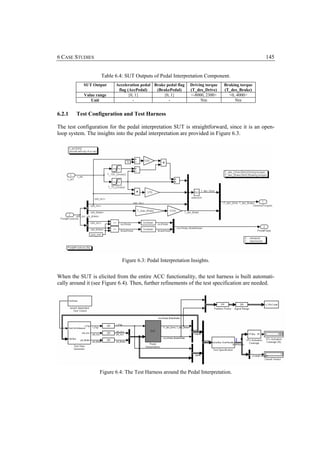
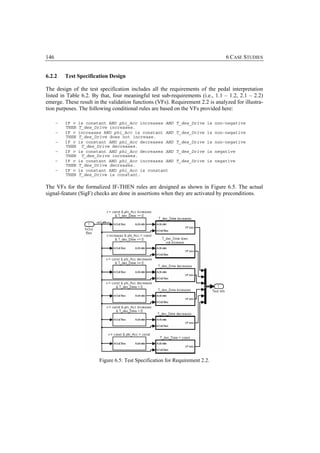
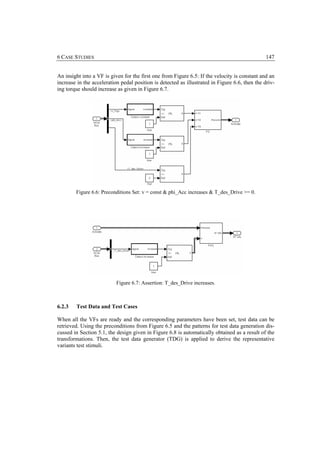
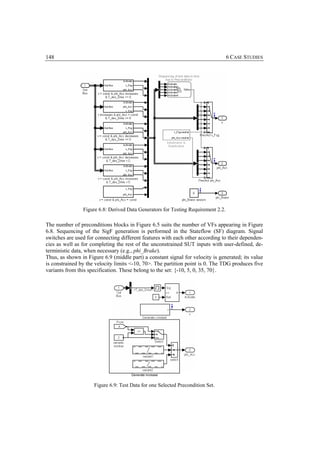
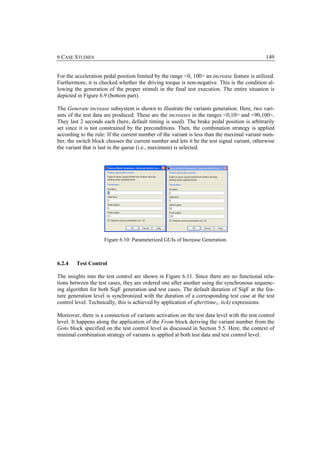
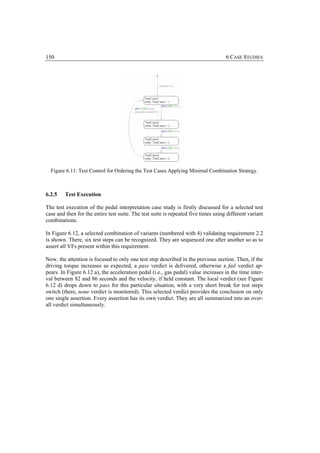
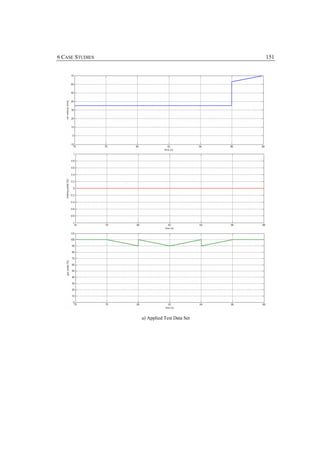
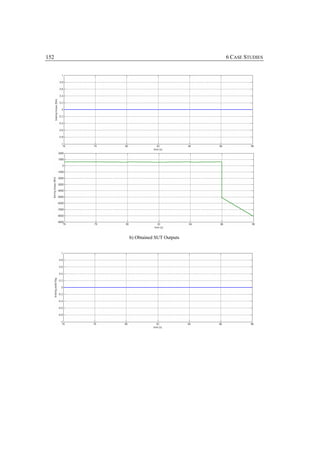
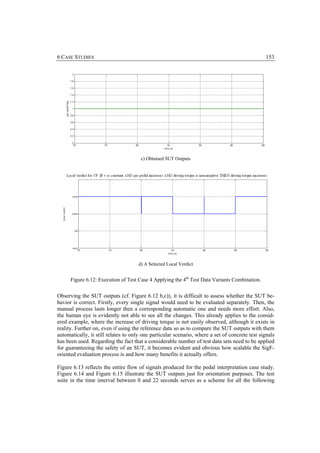
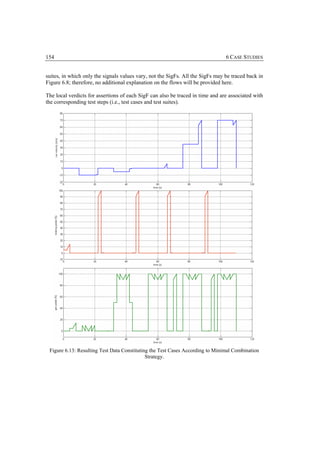
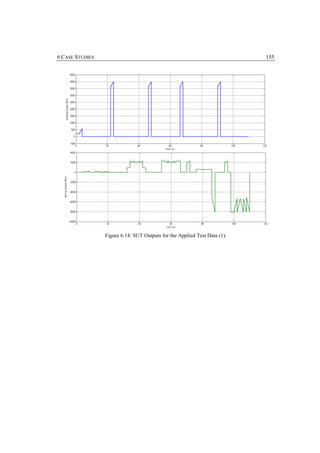
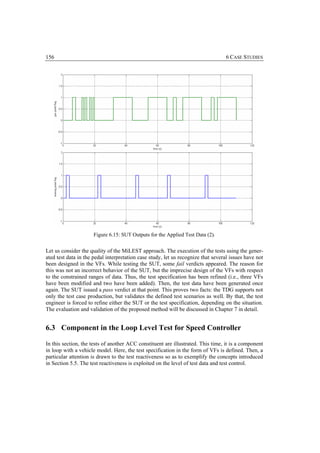
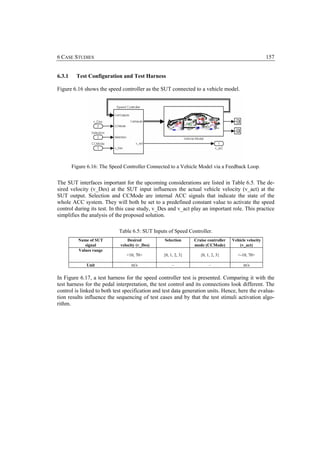
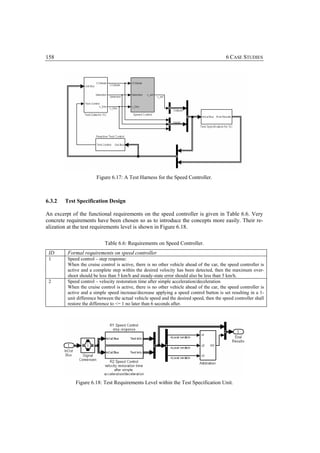
![6 CASE STUDIES 159
Concerning the first requirement, the steady-state error is checked. It permits for a deviation of
±5 km/h. Furthermore, the maximum overshoot of the vehicle velocity step response should not
be higher than ±5 km/h.
In the second requirement, a comfortable speed increase/decrease of 1 km/h is being tested.
Here, a button is used to set the speed change.
As a result of the requirements analysis, the following scenarios are obtained:
− IF Complete step within v_Des detected AND CCMode=active+no_target AND Speed
Control Selection=active
THEN for v_act Maximum overshoot<5 AND Steady-state error<5.
− IF CCMode=active+no_target AND Speed Control Selection=active AND single
v_Des step of size=|1| AND constant duration before the v_Des step=7 seconds
THEN after(6 seconds) |v_Des-v_act|<=1.
Then, the preconditions detect different sorts of steps within the desired velocity and they check
whether the ACC is still active and no vehicle ahead appears, as presented in Figure 6.19.
Figure 6.19: VFs within the Test Specification for the Speed Controller.
Preconditions and assertions pairs are implemented in the Test Specification part as two sepa-
rate VFs each within a requirement. In the first VF the Detect step response characteristics pat-
tern is applied to assess the test case. In the second VF a test pattern containing the temporal
constraint (after) is used. Further details of their realization are omitted referring the reader to
[MP07].
6.3.3 Test Data and Test Reactiveness
Figure 6.20 presents the abstract insights of the test data generation unit at the test requirements
level that matches the test specification from Figure 6.18. For every requirement a subsystem is
built and the appropriate signals are passed on to their switches. Depending on the test control
conditions, a pre-selected test case is activated.](https://image.slidesharecdn.com/zanderdiss-130217192436-phpapp02/85/Zander-diss-183-320.jpg)
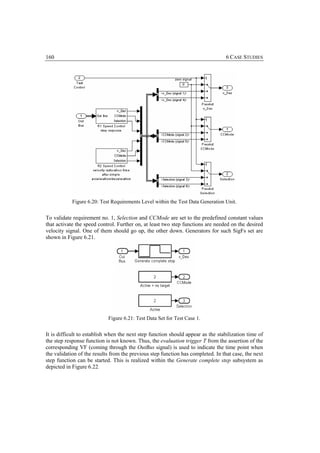
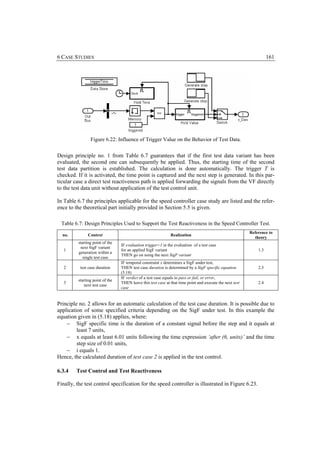
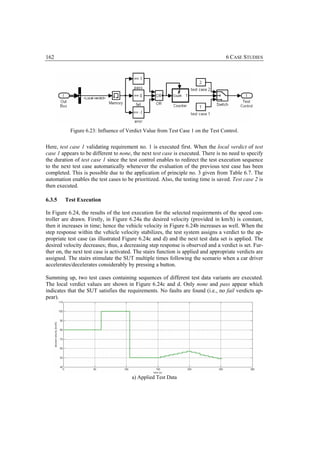
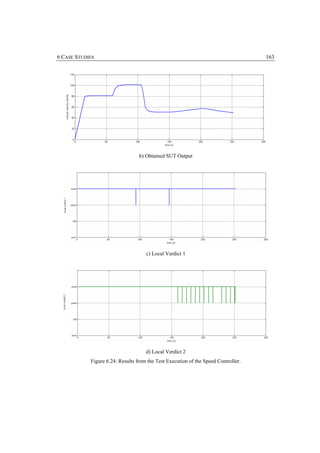
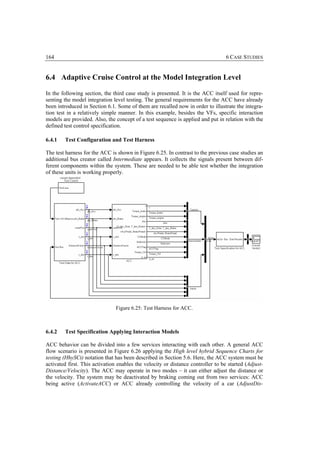
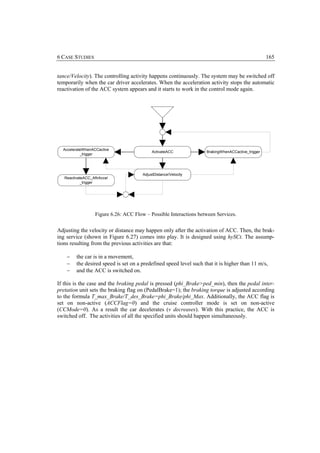
![166 6 CASE STUDIES
Preconditions Assertions
Pedal CC Car Speed CC
phi_Brake Interpretation Control System Coordinator
TRIGGERS
ACC_ON
ACC_ON
t1, t2 [CCMode>=2, ACCFlag=1]
brake
[phi_Brake >= ped_min]
set_a_flag
[PedalBrake=1]
adjust_torque
[T_max_Brake/T_des_Brake =
t1<=0.01s
phi_Max/phi_Brake]
use_driver_input
[ACCFlag=0]
use_driver_input
deactivateCC
[CCMode=0]
slow_down
t2<=0.01s
[v decreases]
ACC_OFF
Figure 6.27: Service: Braking when ACC System is Active Trigger.
6.4.3 Test Specification Design
The implementation of the test specification in MiLEST is generated from the HhySCts and
hySCts provided in the previous section. An example set of the VFs is given in Figure 6.28.
Some of them relate 1-to-1 to the hySCts, whereas the others focus on selected aspects (e.g.,
timing issues) of the services.](https://image.slidesharecdn.com/zanderdiss-130217192436-phpapp02/85/Zander-diss-190-320.jpg)
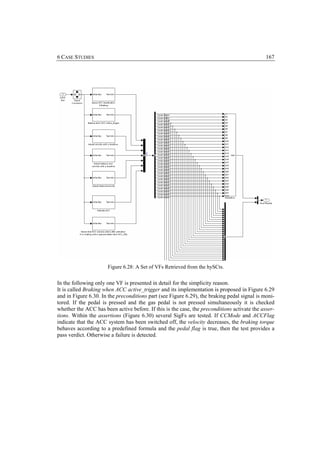
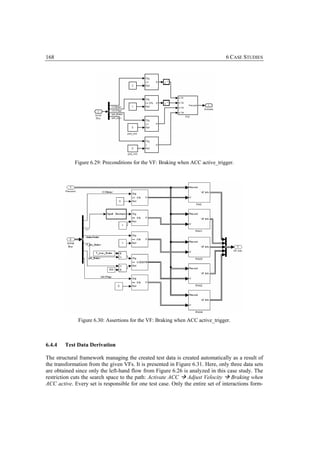
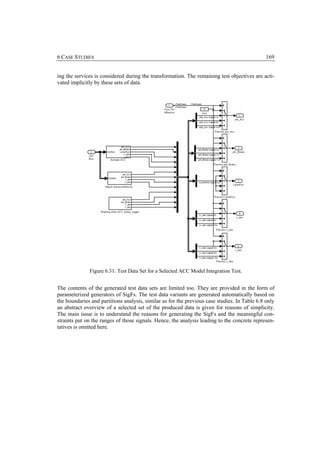
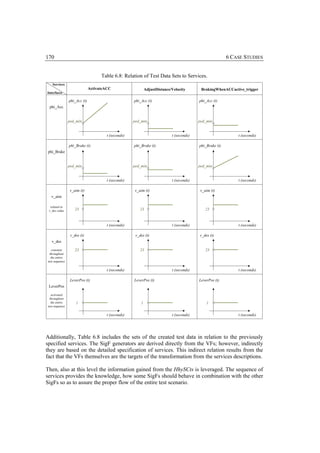
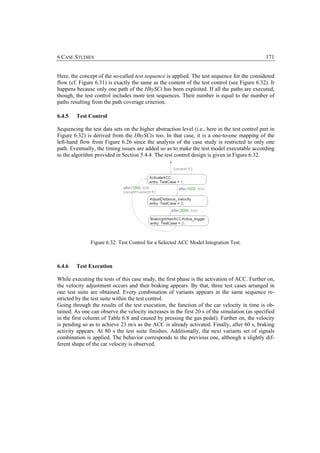
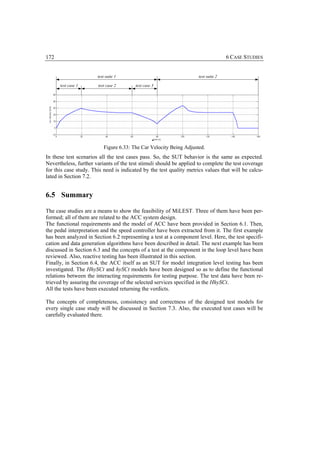
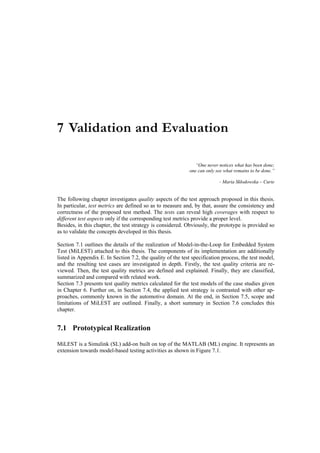
![174 7 VALIDATION AND EVALUATION
CALLBACK
Button
MATLAB FUNCTIONS
OTHER LIBRARIES
OTHER LIBRARIES
Button
Button
SCRIPTS
OTHER LIBRARIES
Button
Button
PRODUCT FAMILY MILEST
Button TRANSFORMATION
PRODUCT FAMILY Button
PRODUCT FAMILY MODEL-BASED TESTING FUNCTIONS
SIMULINK®
Button
SIMULATION AND MODEL-BASED DESIGN
MButton ®
ATLAB
TECHNICAL COMPUTATION
Figure 7.1: Integration of MiLEST in the MATLAB/Simulink framework.
MiLEST consists of an SL library including callback functions, transformation functions, and
other ML scripts. The testing library is divided into four different parts as illustrated in Figure
7.2. Three of them cover the units present at the test harness level. These are: test specification,
test data, and test control. Additionally, the test quality part includes elements for assessing the
quality of a given instance of a test model by applying the metrics.
The callback functions are ML expressions that execute when a block diagram or a block is
acted upon in a particular way [MathSL]. These are used together with the corresponding test
patterns to set their parameters.
Additionally, transformation functions and quality metrics have been realized. Their application
is described in Appendix E. A simple example of an ML function call is the main transforma-
tion where two input parameters must be entered by the test engineer manually so as to indicate
the names of the system under test (SUT) and the resulting test model as presented in (7.1).
TestDataGen('Pedal_Interpretation_test', 'PedalInterpretation') (7.1)
Figure 7.2: Overview of the MiLEST Library.](https://image.slidesharecdn.com/zanderdiss-130217192436-phpapp02/85/Zander-diss-198-320.jpg)
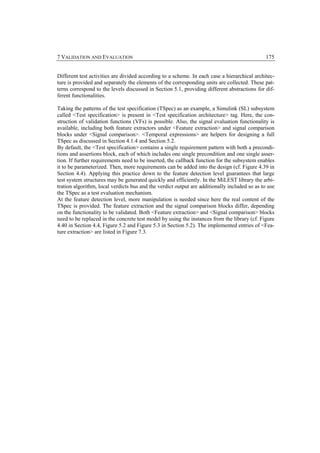
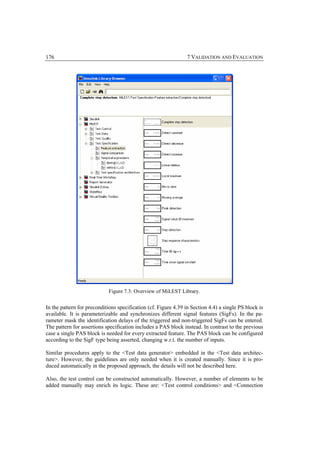
![7 VALIDATION AND EVALUATION 177
helpers>. They include algorithms that restrict the test case execution based on the verdicts, test
stimuli values or test evaluation information at a certain time point or in given time interval.
A good practice is to rename all the applied patterns according to the concrete functionality that
they contain.
7.2 Quality of the Test Specification Process and Test Model
7.2.1 Test Quality Criteria
As far as any testing approach is considered, test quality is given a lot of attention. It constitutes
a measure for the test completeness and can be assessed on different levels, according to differ-
ent criteria. In the upcoming paragraphs three main categories of the test quality resulting from
the analysis of several efforts in the related work are distinguished. All of them are based on the
functional considerations, leaving the structural 41 issues out of the scope in this thesis.
Primarily, criteria similar to that for software development are of importance. Hence, the same
as the consistency of the software engineering process are evaluated the test specification proc-
ess and the resulting tests should be assessed.
While consistency is defined as the degree of uniformity, standardization, and freedom from
contradiction among the documents or parts of a component or system [IEG90], consistency of
a test relates entirely to the test system. An example of the consistency check is evaluating
whether the test pattern applied in the test is not empty.
Correctness is the degree to which a system or component is free from faults in its specification,
design, and implementation [IEG90]. Correctness of a test is denoted in this thesis by the de-
gree to which a test is free from faults in its specification, design and applied algorithms, as
well as in returning the test verdicts. This definition is extended in comparison to test correct-
ness provided by [ZVS+07]. There it is understood as the correctness of the test specification
w.r.t. the system specification or the test purposes, i.e., a test specification is only correct when
it always returns correct test verdicts and when it has reachable end states.
Correctness of a test can be exemplified when the robustness of the test is considered, e.g., in
MiLEST a check is made to see whether the tolerance limits applied in the assertions are high
enough to let the test pass.
In this thesis, consistency and correctness of a test are mainly defined w.r.t. to the test scenarios
specified applying the MiLEST method. Both of them can be assessed by application of the
corresponding test quality (TQ) metrics.
Progress on the TQ metrics has been achieved by [VS06, VSD07], where static and dynamic
metrics are distinguished. The static metrics reveal the problems of the test specification before
41
Metrics related to structural model coverage are already well established in the common practice. They analyze path cov-
erage, branch coverage, state coverage, condition coverage, cyclomatic complexity, MC/DC, etc. of a system model
[ISTQB06, IEG90, MathSL].](https://image.slidesharecdn.com/zanderdiss-130217192436-phpapp02/85/Zander-diss-201-320.jpg)
![178 7 VALIDATION AND EVALUATION
its execution, whereas the dynamic metrics relate to the situation when the test specification is
analyzed during its execution.
An example of a static consistency check is evaluating if at least one test for each requirement
appears in the test specification, whereas a dynamic check determinates whether a predefined
number of test cases has been really executed for every requirement.
Additionally, [ZVS+07] define a TQ model as an adaptation of ISO/IEC 9126 [ISO04] to the
testing domain. Its characteristics are taken into account in the upcoming analysis too.
These are:
− test reusability and maintainability that have already been discussed in the introduction
to test patterns in Section 4.3;
− test effectivity that describes the capability of the specified tests to fulfill a given test
purpose, including test coverage, test correctness, and fault-revealing capability,
among others;
− reliability that reveals the capability of a test specification to maintain a specific level
of work and completion under different conditions with the characteristic of maturity,
thus consistency;
− usability that describes the ease to actually instantiate or execute a test specification,
distinguishing understandability, and learnability, among others;
− finally, efficiency, and portability. These, however, are left out of the scope in this the-
sis.
7.2.2 Test Quality Metrics
For the purpose of this thesis several TQ metrics have been defined, based mainly on the func-
tional relevance. In the following paragraphs, they are discussed and ordered according to the
test specification phases supported by the MiLEST methodology. Obviously, the list is not
comprehensive and can be extended in many directions.
Additionally, a classification of the presented TQ metrics in terms of the criteria defined in Sec-
tion 7.2.1 is provided in Table 7.1.
Test data related quality metrics:
− Signal range consistency is used to measure the consistency of a signal range (speci-
fied in the Signal Range block) with the constraints put on this range within the pre-
conditions or assertions at the VF level. It applies for SUT inputs and outputs. The
consistency for inputs is implicitly checked when the variants of the test signals are
generated. In other words, the test data generator informs about the inconsistencies in
the signal ranges. The metric is used for positive testing.
− Constraint correctness – assuming that the signal range is specified correctly for every
SUT interface, it is used to measure the correctness of constraints put on those signals
within the preconditions or assertions at the VF level. If the ranges are violated, then
the corresponding preconditions or assertions are not correct.
− Variants coverage for a SigF is used to measure the equivalence partitions coverage of
a single SigF occurring in a test design. It is assessed based on the signal boundaries,](https://image.slidesharecdn.com/zanderdiss-130217192436-phpapp02/85/Zander-diss-202-320.jpg)

![180 7 VALIDATION AND EVALUATION
− Minimal combination coverage is used to measure the coverage of combining the test
stimuli variants according to the minimum criterion. 100% coverage requires that every
variant of a SigF is applied at least once in a test step 42 (i.e., technically, it appears in
the test data set). The metric is also called each-used or 1-wise coverage.
sum of the applied variant combinatio ns satisfying 1- wise criterion
Minimal combinatio n coverage = (7.7)
sum of all possible combinatio ns satisfying 1- wise criterion
Test specification related quality metrics:
− Test requirements coverage compares the number of test requirements covered by test
cases specified in MiLEST test to the number of test requirements contained in a corre-
sponding requirements document. It is calculated by:
# of test requirements covered in a test design
Test requirements coverage = (7.8)
overall # of test requirements
− VFs activation coverage is used to measure the coverage of the VFs activation during
the test execution. This metric is related to the test requirements coverage, but one
level lower in the MiLEST hierarchy. It is calculated as follows:
# of VFs activated during test execution
VFs activation coverage = (7.9)
# of all VFs present in a test design
− VF specification quality is used to assess the quality of an IF-THEN rule specification.
In particular, it evaluates whether the test data generation algorithm is able to provide a
reasonable set of test signals from the specified preconditions. In other words, a check
is made to see whether the signals within preconditions of VFs are transformable into
the test stimuli. The metric, though simplified, results from the discussion given ini-
tially by [MP07] (pg. 92) and continued in Section 5.2 on Modus Tollens [Cop79,
CC00] rules application. If only the SUT outputs are constrained in the preconditions
part of a VF, then no test stimuli can be produced from it. In that case, it is reasonable
to modify (e.g., reverse) the VF contents. If the result equals 0 then the IF-THEN rule
is not correct and must be reconstructed.
# of input signals applied in a preconditi ons set
VFs specificat ion quality = (7.10)
# of all signals present in the preconditi ons set
− Preconditions coverage measures whether all the preconditions specified in the test de-
sign at the VF level have really been active during the test execution.
42
Test step is a unique, non-separable part of a test case according to the nomenclature given in Section 5.4.2. The test case
can be defined as a sequence of test steps dedicated for testing one single requirement.](https://image.slidesharecdn.com/zanderdiss-130217192436-phpapp02/85/Zander-diss-204-320.jpg)
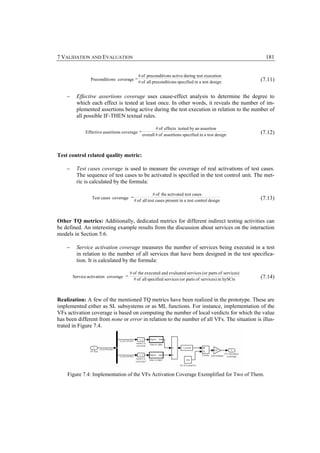
![182 7 VALIDATION AND EVALUATION
Another example is a ML function called input_coverage() that lists the results of the metric
called variants coverage for a SigF for every SUT input signal.
Test modeling guidelines check: Furthermore, apart from the measurements realized with the
help of TQ metrics, consistency of the test specification may be checked statically by applica-
tion of the test modeling guidelines. The modeling guidelines may be either company specific
or defined by some institutional bodies, e.g., the Motor Industry Software Reliability Associa-
tion (MISRA™) [Mis]. The technical realizations of modeling guideline checkers for system
design are presented in [NSK03, AKR+06, ALS+07, FG07] using graph transformations or
OCL.
Some ad-hoc test modeling guidelines rules for the test specification developed in MiLEST are
given below:
− Assertions block in a VF cannot be empty
− Preconditions block in a VF cannot be empty
− Test data generation unit cannot be empty
− Hierarchical structure for TDGen and TSpec units should be preserved
− Number of SigFs found in the preconditions of a VF should be equal or higher than the
number of inputs in the preconditions
− Number of SigFs found in the assertions of a VF should be the same as the number of
the PAS blocks
− One PS block should be present in the preconditions of a VF
− PAS inputs are signals that pass on from the comparison blocks
− Comparison blocks must have the reference data
− ‘TestInfo’ bus is built by the set of signals: {Local verdict, Expected lower limit, Ex-
pected upper limit, Actual data, Delay}
− The names of some objects present in the test model, e.g., ‘TestInfo’ should remain
fixed.
7.2.3 Classification of the Test Quality Metrics
Similar to separate test activities needing to be performed for both functional requirements ap-
proval (i.e., black-box test) and structural model validation (i.e., white-box test), the same ap-
plies to quality considerations. Hence, already [Con04a] claims that system model coverage
should be used in combination with the other functionality-related metrics.
A possible realization that measures structural coverage at the model level is provided by the
Model Coverage Tool in Simulink Verification and Validation [SLVV]. There, model coverage
is a metric collected during simulation delivering information about model objects that have
been executed in simulation. In addition, it highlights those objects that have not yet been
tested. The metric assesses the completeness of the test. A generic formula used for its calcula-
tion is given by [ZVS+07]:
achieved coverage of system model structure
System model coverage = (7.15)
possible coverage of system model structure](https://image.slidesharecdn.com/zanderdiss-130217192436-phpapp02/85/Zander-diss-206-320.jpg)
![7 VALIDATION AND EVALUATION 183
Furthermore, the discussion on quality is given by [Leh03, Con04a] w.r.t. their concrete test
approaches. Thus, for Time Partitioning Testing – cost/effort needed for constructing a test data
set, relative number of found errors in relation to the number of test cases needed to find them –
are named as examples. [Con04a] adds coverage of signal variants combinations – CTCmax,
CTCmin initially introduced in [Gri95] for Classification Tree Method – CTM (cf. minimal com-
bination coverage in Table 7.1). Obviously, both authors distinguish requirements coverage (cf.
test requirements coverage in Table 7.1) as an important measure too.
In Table 7.1 all the TQ metrics that have been defined in Section 7.2.2 and in this section are
classified according to the criteria provided in Section 7.2.1.
Table 7.1: Classification of MiLEST Test Quality Metrics.
Classification Criteria TQ Model Assessability Phase Consistency of test,
correctness of test
TQ Metrics
Test data related:
- Reliability - Static - Consistency of test
Signal range consistency (maturity)
- Reliability - Static - Correctness of test
(maturity)
Constraint correctness - Effectivity
(test correctness)
- Reliability - Static - Consistency of test
(maturity)
Variants coverage for a SigF - Effectivity
(test coverage)
- Effectivity - Dynamic - Correctness of test
(test coverage)
Variants coverage during test
- Effectivity
execution (test correctness)
- Effectivity - Dynamic - Correctness of test
(test coverage)
Variants related preconditions
- Effectivity
coverage (test correctness)
- Effectivity - Dynamic - Correctness of test
(test coverage)
Variants related assertions cov-
- Effectivity
erage (test correctness)
- Effectivity - Dynamic - Does not apply
SUT output variants coverage (test coverage)
- Effectivity - Dynamic - Consistency of test
Minimal combination coverage (test coverage)
Test specification related:
- Effectivity - Dynamic - Consistency of test
Test requirements coverage (test coverage)
- Effectivity - Dynamic - Consistency of test
VFs activation coverage (test coverage)](https://image.slidesharecdn.com/zanderdiss-130217192436-phpapp02/85/Zander-diss-207-320.jpg)
![7 VALIDATION AND EVALUATION 185
The metrics investigating the cost or power of the method in terms of finding the errors will not
be analyzed in this thesis since the author can neither objectively assess the efforts spent on
using the proposed test method, nor possess enough statistics regarding more examples of
MiLEST application.
7.3.1 Pedal Interpretation
In the pedal interpretation case study all the metrics related to the test data, test specification,
and test control have reached their maximal values (cf. Table 7.2); therefore, they will not be
discussed in detail here. Further on, the metric called service activation coverage is not calcula-
ble for this example since only the component level test is regarded here.
Table 7.2: Variants Coverage for SigF and SUT Output Variants Coverage Exemplified for the
Pedal Interpretation.
Direction Name Domain Partition Achieved
Point Coverage
Input v_act [-10, 70] {0} 100 %
Signal phi_Acc [0, 100] {5} 100 %
phi_Brake [0, 100] {5} 100 %
Output Acc Pedal [0,1] – 100 %
Signal Brake Pedal [0,1] – 100 %
T_des Drive [-8000, 2300] {0} 100 %
T_des Brake [0, 4000] {0} 100 %
7.3.2 Speed Controller
In contrast to the previous model, the test of speed controller covers fewer issues. For instance,
variants coverage for SigF and SUT output variants coverage reveal lower levels as given in
Table 7.3. The reason is that the test data variants have not been generated yet. Instead, the case
study has provided the way for how to automate the mechanism, which is sequencing the test
steps or test cases. The values of the metrics indicate that further efforts are needed so as to
complete the test design in terms of data selection.
Table 7.3: Variants Coverage for SigF and SUT Output Variants Coverage Exemplified for the
Speed Controller.
Direction Name Domain Partition Achieved
Point Coverage
Input v_des [11, 70] – 33 %
Signal CCMode [] {0,1,2,3} 25 %
Selection [] {1,2,3} 33 %
Output v_act [-10, 70] {0} 40 %
Signal](https://image.slidesharecdn.com/zanderdiss-130217192436-phpapp02/85/Zander-diss-209-320.jpg)
![186 7 VALIDATION AND EVALUATION
7.3.3 Adaptive Cruise Control
Similar considerations to those for the previous case study apply to adaptive cruise control
(ACC). The values obtained for variants coverage for SigF and SUT output variants coverage
(see Table 7.4) indicate that there is still plenty to do in terms of test data generation. Here, the
reason for such results is that only one path of the High level hybrid Sequence Chart for testing
(HhySCt) has been traversed during the test data generation (cf. Section 5.6).
Table 7.4: Variants Coverage for SigF and SUT Output Variants Coverage Exemplified for the
ACC.
Direction Name Domain Partition Achieved
Point Coverage
Input v_aim [-10, 70] {0} 20 %
Signal phi_Acc [0, 100] {5} 100 %
phi_Brake [0, 100] {5} 80 %
LeverPos [] {0,1,2,34} 11 %
DistanceFactor [0,1] – 33 %
v_des [11,70] – 33 %
Output v_act [-10,70] {0} 67 %
Signal Torque_brake [0,4000] – 100 %
Torque_engine [-8000, 2300] {0} 60 %
The metrics applicable for ACC relate additionally to further aspects. For example, the service
activation coverage achieves coverage of 14% since only one path of the corresponding
HhySCt diagram is included in the test execution.
7.3.4 Concluding Remarks
An important remark is that the values of metrics calculated throughout the case studies have
been differentiated on purpose. In other words, the test design of the speed controller and ACC
are presented as incomplete so as to explain the extracted ideas behind different elements of
MiLEST more clearly, show the weight of the introduced concepts in comparison and reveal
the need for application of the test quality metrics.
In reality, the test designs are much more complete. However, it would make no sense to prove
that all of them yield maximal values of metrics.
Furthermore, the only quantitative results that the author of this thesis is able to relate to are
included in the work of [Con04a], where similar case studies have been applied. The obtained
values of the metrics in the context of the test data selection reveal that the automatically gener-
ated test cases produce very similar test coverages w.r.t. different aspects as a manual specifica-
tion using classification trees executed in MTest.
The component level test in MiLEST may be fully automated, whereas the integration level test
needs manual refinement. Nevertheless, it is still better than simply a manual test stimuli selec-
tion.
Concerning the test evaluation considerable progress has been achieved in this thesis since it
works automatically regardless of which input is being applied. In other words, if the test
evaluation has been specified once, it runs independently of the SUT stimulation, in contrast to
the MTest approach.](https://image.slidesharecdn.com/zanderdiss-130217192436-phpapp02/85/Zander-diss-210-320.jpg)
![7 VALIDATION AND EVALUATION 187
7.4 Quality of the Test Strategy
In the upcoming paragraphs the criteria defining an efficient and effective test strategy given by
[Leh03, Con04a] 43 are analyzed and modified in such a way that the test dimensions (defined in
Section 2.3) and test categories (provided in Section 3.1) constituting the aims of this thesis,
remain the primary focus.
The criteria defined by [Leh03] are:
1. automation of the test execution
2. consistency throughout different execution platforms
3. systematic test data variants selection
4. readability
5. reactive test support
6. real-time and continuous behavior support
Whereas [Con04a] indicates the following as the most important:
1. possibility to describe different signal categories (related to (6) of [Leh03])
2. test abstraction and type of description means (related to (4) of [Leh03])
3. expressiveness (related to (6) of [Leh03])
4. coverage criteria support (related to (3) of [Leh03])
5. embedding in the existent methodology (related to (2) of [Leh03])
6. tool support (related to (1) of [Leh03])
7. wide-spreading in the domain
Based on the above, the criteria for MiLEST aiming for high-quality test strategy and method-
ology are listed:
1. automation of the test specification process and test execution (cf. Section 4.4, Sections
5.2 – 5.4), similar to (1) of [Leh03]
2. systematic selection of test signals and their variants (cf. Section 5.3), similar to (3) of
[Leh03]
3. readability, understandability, ease of use (cf. test patterns in Chapters 4 – 5), similar to
(4) of [Leh03]
4. reactive test support (cf. Section 5.4), similar to (5) of [Leh03]
5. real-time, discrete and continuous behavior support (cf. Chapter 4), similar to (6) of
[Leh03]
6. abstraction, test patterns support (cf. Chapters 4 – 5)
7. high quality, correctness, and consistency of the resulting test model (cf. this chapter),
similarly as (4) of [Con04a]
8. support of signal-feature – oriented data generation and their evaluation (cf. Section 4.1
– 4.2), related to (1,3) of [Con04a])
The embedding of the test approach within the model-based development paradigm (as (5) of
[Con04a]) and tool support (as (6) of [Con04a]) are obvious criteria that any new technical pro-
posal must fulfill.
43
The two approaches have been selected since they have already been in use at Daimler AG for the last few years [KHJ07].](https://image.slidesharecdn.com/zanderdiss-130217192436-phpapp02/85/Zander-diss-211-320.jpg)
![188 7 VALIDATION AND EVALUATION
An undeniable fact is that the automotive industry aims at transferring innovative model-based
testing technologies from research into industrial practice. However, eventually any company is
interested in reducing cost for testing by reaching higher test coverage simultaneously, which
subsequently enables more errors to be detected whatever test techniques are used [DM_D07,
D-Mint08]. Therefore, a very crucial industry-driven research question is the quality of the test
cases and test design. This can be measured by means of different quality metrics as discussed
in Section 7.2.
7.5 Limitations and Scope of the Proposed Test Method
The main limitations of the MiLEST method and its realization result from the context of the
applied test strategy and are outlined below.
− Support of different test execution platforms for the proposed method has not been suf-
ficiently explored yet. Consequently, the consistency throughout the platforms cannot
be considered. System engineers use the models developed on MiL level for HiL, SiL,
and PiL platforms, though. Interesting research questions arise asking to what extent
the concrete test cases should be reused on different levels.
− Real-time properties on the run-time execution level in the connection with hardware
devices in the sense of scheduler, RTOS, priorities, and threads have not been investi-
gated. Also, the test system itself has not been designed to be real time (cf. Section
3.3).
− Distribution of the method within the automotive domain is not yet possible since
MiLEST is not a ready-to-use product, but rather an extendable prototypical realiza-
tion. If customized further, it might be applied on a large scale in the future. These and
other issues are currently under discussion with the industrial partners [D-Mint08].
Moreover, the tendency to handle continuous signals based on their features and predi-
cates is a promising one as discussed by [ZSM06, MP07, GW07, SG07, Xio08] (cf.
Section 4.5).
− In addition, the complexity of the method and the learning curve influenced by the
learning ability of the test engineer cannot be assessed in a straightforward manner.
Nevertheless, the analysis of a simple questionnaire that has been filled out by execu-
tive managers of software- and test-related projects and is attached in Appendix D,
gives an overview of the acceptance rate for different test modeling techniques. It re-
veals that the CTM and sequence-diagrams-based testing are still the most widespread
test methods in the industry.
While soundness of the proposed methodology is analyzed by application of the test metrics, its
completeness deserves some considerations. It is applicable to causal systems of either continu-
ous or discrete nature, or the combination of both of them, alternatively described by time con-
straints. The methodology and test development process could be reused also for other types of
SUTs. However, the implementation restricts MiLEST to these specified in the ML/SL/SF en-
vironment.
From the perspective of the technical domain, MiLEST suits any area where hybrid embedded
software is developed. Hence, besides the automotive one, it can be deployed in avionics, aero-
space, rail, or earth information systems, after some adjustments.](https://image.slidesharecdn.com/zanderdiss-130217192436-phpapp02/85/Zander-diss-212-320.jpg)
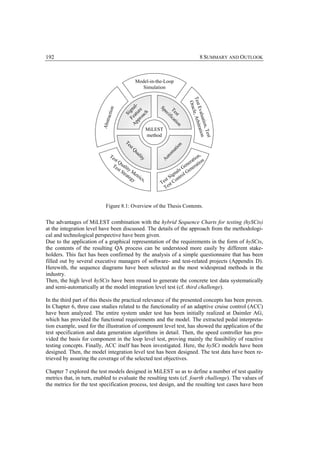
![8 SUMMARY AND OUTLOOK 193
calculated based on the case studies from the previous chapter. In addition, the prototypical re-
alization has been discussed and summarized in Appendix E. Afterwards, the commonly known
test strategies have been reviewed and compared with the strategy proposed in this thesis. Also,
the challenges and limitations of MiLEST have been indicated.
This chapter serves as a close to this thesis and as such is self-explanatory. Thus, summing up,
MiLEST constitutes a comprehensive QA framework (cf. Figure 8.1) enabling a full test speci-
fication for ES based on the ready-to-use test patterns.
The MiLEST signal-feature approach provides the essential benefit of describing signal flows,
their relation to other signal flows, and/or to discrete events on an abstract, logical level. This
prevents not only the user from error on too-technical specifics, but also enables test specifica-
tion in early development stages. The absence of concrete reference signals is compensated by a
logical description of the signal flow characteristics.
In addition, MiLEST automates the systematic test data selection and generation, providing a
better test coverage (e.g., in terms of requirements coverage or test purpose coverage) than
manually created test cases.
Furthermore, the automated test evaluation reveals considerable progress, in contrast to the low
level of abstraction and the manual assessment means used in existing approaches. The tester
can immediately retrieve the test results and is assured about the correct interpretation of the
SUT reactions along the tests.
The signal evaluation used in the automated test evaluation can even run independently of the
SUT stimulation. The signal evaluation is not based on the direct comparison of SUT signals
and previously generated concrete reference signals. Instead, it offers an abstract way for re-
quirements on signal characteristics. The signal evaluation is particularly robust and can be
used in contexts other than testing, e.g., for online monitoring.
Furthermore, the test specification enables the SUT requirements to be traced. The manner how
it is defined gives the possibility to trace root faults by associating local test verdicts to them,
which is a central element in fault management of embedded systems.
Finally, the MiLEST test quality metrics reveal the strengths of the approach by providing high
test coverage in different dimensions and good analysis capabilities. The MiLEST projects
demonstrated a quality gain of at least 20%.
8.2 Outlook
Due to the application of MiLEST the test engineer needs considerably less effort in the context
of test generation and test execution, concentrating on the test logic and the corresponding test
coverage. By that, the cost of the entire process of software development is definitely cut.
However, there is still plenty of work concerning MiLEST future achievements.
Starting with the conditional rules utilized within the test specification and the discussion pro-
vided in Section 5.2 on the problem of ordering the SUT inputs and outputs constraints, an
automatic transformation of the incorrect functions (e.g., IF constrained output THEN con-
strained input) into the reverse, based on the transposition rule [CC00] could be easily realized.](https://image.slidesharecdn.com/zanderdiss-130217192436-phpapp02/85/Zander-diss-217-320.jpg)
![194 8 SUMMARY AND OUTLOOK
Then, the issue of handling the SUT outputs existing in the preconditions of a VF (e.g., IF con-
strained input AND constrained output THEN constrained output) has been only partially
solved. A check is made to see whether the test data generator has been able to produce the
meaningful signals from such a specification. If this is not the case, a manual refinement is
needed in the Initialization/Stabilization block at the test case level. An automatic way of relat-
ing the functional test cases and test sequences to each other can be a struggle to find, though.
The test stimuli generation algorithms can still be refined as not all the signal features are in-
cluded in the realization of the engine. Also, they could be enriched with different extensions
applying, in particular, a constraint solver and implicit partitions as discussed in Section 5.4.1.
There is further work regarding the negative testing as well. Here, the test data generation algo-
rithm can be extended so as to produce the invalid input values or exceptions. However, the test
engineer’s responsibility would be to define what kind of system behavior is expected in such a
case.
An interesting possibility pointed out by [MP07] would be to take advantage of the reactiveness
path for optimizing the generated test data iteratively. In that case, the algorithm could search
for the SUT inputs leading to a fail automatically (cf. evolutionary algorithms [WW06]).
Moreover, since software testing alone cannot prove that a system does not contain any defects
or that it does have a certain property (i.e., that the signal fulfills a certain signal feature), the
proposed VFs could be a basis for developing a verification mechanism based on formal meth-
ods in a strict functional context [LY94, ABH+97, BBS04, DCB04]. Thus, the perspective of
mathematically proving the correctness of a system design remains open for further research
within the proposed QA framework.
Besides the test quality metrics analyzed in Chapter 7, other criteria may also be used to assess
the proposed test method, the following being only some of them:
− the efficiency of faults detection – aimed to be as high as many VFs are designed under
the assumption that the corresponding test data are generated and applied properly
− the percentage of test cases / test design / test elements reusability
− time and effort required for the test engineer to specify the test design, which is rela-
tively low only for persons knowing the technologies behind the concepts
− the percentage of the effective improvement of the test stimuli variants generation in
contrast to the manual construction.
Regarding the realization of MiLEST prototype, several GUIs (e.g., for transformation func-
tions, for quality metrics application, for variants generation options, or for the test execution)
would definitely help the user to apply the method faster and more intuitively.
Furthermore, the support of different test execution platforms for the proposed method has not
been sufficiently explored yet. Interesting research questions concern the extent to which the
concrete test cases could be reused on various execution levels. Consequently, real-time proper-
ties on the run-time execution level [NLL03] in the sense of scheduler, RTOS, priorities, or
threads have not been considered.
Then, the Testing and Test Control Notation (TTCN-3) is worth mentioning since the advan-
tages of this standard technology have already been recognized by the automotive industry.](https://image.slidesharecdn.com/zanderdiss-130217192436-phpapp02/85/Zander-diss-218-320.jpg)
![8 SUMMARY AND OUTLOOK 195
AUTOSAR and MOST [ZS07] decided to use TTCN-3 for the definition of functional tests.
Currently, TTCN-3 for ESs is under development [Tem08, GSW08].
Investigation in the context of transformations from UML Testing Profile for Embedded Sys-
tems [Liu08] into executable MiLEST test models and further on, into TTCN-3 for ESs would
be an interesting approach enabling the test specification to be exchanged without losing the
detailed information since all three approaches are based on a similar concept of signal feature.
This would give the advantage of having a comprehensive test strategy applicable for all the
development platforms.
Moreover, an interesting option would be to investigate the potential of MiLEST for testing the
AUTOSAR elements having in mind that an analysis of Simulink itself is already included in
the AUTOSAR standard.
8.3 Closing Words
There is still plenty of research potential resulting from this thesis, in general. The authors of
[Hel+05] consider the multidisciplinary character of the embedded domain as a challenge that
should not be neglected. Indeed, it is necessary in software development for ES to consider sev-
eral aspects together. Hardware/software field alike, technological progress and economic suc-
cess profit highly from human abilities of cooperation and the social environment.
The argumentation applies to the QA disciplines too. There should be a link or at least a con-
ceptual common understanding forwarded from MiLEST to other test types, e.g., structural test,
performance test, or robustness test so as to position all the QA activities in the development
process.
Generally, the concept of working together with any other parties holds at every level of inter-
actions, starting from software development, through assuring the quality and safety of the re-
sulting product, to the real effects while running this product (e.g., fuel consumption, carbon
dioxide (CO2) emissions 44). Europe has already shown interest towards environmentally
friendly hybrid cars. The market for hybrid ECUs used for engine management is expected to
witness a steady growth across the forecast period with units and revenues expected to reach
0.7 million and € 26.1 million by 2015, respectively [FS08]. Hence, similarly as the trends of
sustainable development 45 indicate, this thesis has aimed at accomplishing local actions that
think globally in parallel.
Moreover, the effects of any progress achieved in the research on fuel cells and hybrid cars
should be included in analyzing the role of software and new paradigms of its QA to shape our
common future.
ESs ease environmental research and enable many new investigations on the measurement and
tracking of diverse data, like weather and climate data. Sensors are used to identify early indica-
tors of earthquakes, volcanic eruptions, or floods. Wireless sensor networks are used to observe
44
According to the recent trends in new car purchases in European Union, the average car sold over the period 1995-2004
experienced a surge in power of 28% while CO2 emissions decreased by 12% [EU06].
45
Sustainable development is the development that meets the needs of the present without compromising the ability of future
generations to meet their own needs [Bru87].](https://image.slidesharecdn.com/zanderdiss-130217192436-phpapp02/85/Zander-diss-219-320.jpg)
![196 8 SUMMARY AND OUTLOOK
animals and to track changes of ecosystems in order to better understand these changes and ex-
amine the effects of nature conservation activities [Hel+05]. Hence, the QA techniques for such
constellations are important issues that will be dealt with in the near future.
The main wish of the author is that at least some parts of this thesis will be reused and the sub-
ject will be explored further on, e.g., based on one of the points from the outlook or in another
domain. The author has already made some effort to enable such progress.](https://image.slidesharecdn.com/zanderdiss-130217192436-phpapp02/85/Zander-diss-220-320.jpg)
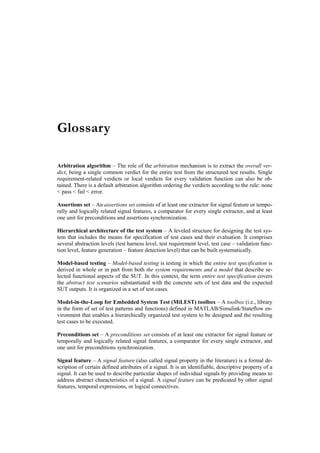
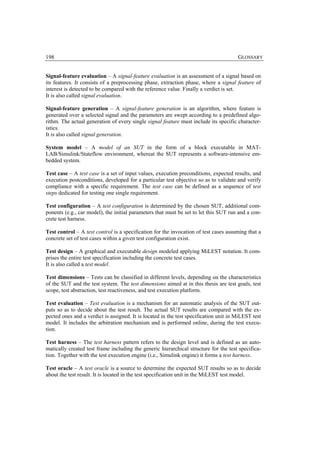
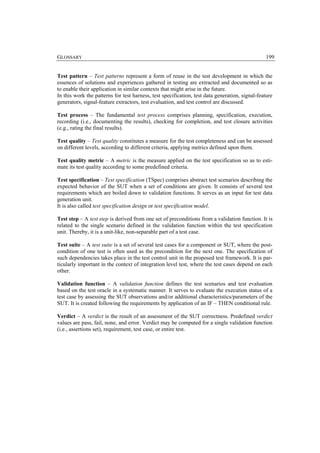
![Bibliography
[ABH+97] Amon, T., Borriello, G., Hu, T., Liu, J.: Symbolic timing verification of timing
diagrams using Presburger formulas. In Proceedings of the 34th Annual Conference
on Design Automation, Pages: 226 – 231, ISBN: 0-89791-920-3. ACM New York,
NY, U.S.A., 1997.
[ACK81] Ackrill, J. L.: Aristotle the philosopher. ISBN-10: 0192891189. Oxford, 1981.
[AES08] Automotive Entertainment Systems – 2008 Edition, Research Report # SC1003,
Semicast Research Group, Pages: 202, 2007.
http://www.electronics.ca/reports/automotive/entertainment_systems2.html
[07/11/08].
[AGH00] Alur, R., Grosu, R., Hur, Y., Kumar, V., Lee, I.: Modular Specification of Hybrid
Systems in CHARON. In Proceedings of the 3rd International Workshop on Hybrid
Systems: Computation and Control. Pittsburgh, 2000.
[AKR+06] Amelunxen, C., Königs, A., Rötschke, T., Schürr, A.: MOFLON: A Standard-
Compliant Metamodeling Framework with Graph Transformations. In Model
Driven Architecture – Foundations and Applications, Volume 4066/2006, Pages:
361 – 375, ISBN: 978-3-540-35909-8, LNCS. Springer-Verlag Berlin/Heidelberg,
2006.
[ALE79] Alexander, Ch.: The Timeless Way of Building, Oxford University Press, 1979.
[ALL06] Allen, P.: Service Orientation, winning strategies and best practices. ISBN: 13-
978-0-521-84336-2. Cambridge University Press, 2006.
[ALS+07] Amelunxen, C., Legros, E., Schürr, A., Stürmer, I.: Checking and Enforcement of
Modeling Guidelines with Graph Transformations. In Proceedings of the 3rd Inter-
national Symposium on Applications of Graph Transformations with Industrial
Relevance, Editors: Schürr, A., Nagl, M., Zündorf, A. 2007.
[AR] Aristotle, The Politics, Book IV. http://www.constitution.org/ari/polit_01.htm
[04/14/08].](https://image.slidesharecdn.com/zanderdiss-130217192436-phpapp02/85/Zander-diss-230-320.jpg)
![BIBLIOGRAPHY 207
[ART05] The ARTIST Roadmap for Research and Development. Embedded Systems Design.
LNCS, Volume 3436, Editors: Bouyssounouse, B., Sifakis, J., XV, ISBN: 978-3-
540-25107-1. 2005.
[AUFO] Munich University of Technology, Department of Computer Science, AutoFocus,
research tool for system Modelling, http://autofocus.in.tum.de/ [04/20/2008].
[AUTD] dSPACE GmbH, AutomationDesk, commercial tool for testing,
http://www.dspace.de/goto?releases [04/20/2008].
[BBH04] Berkenkoetter, K., Bisanz, S., Hannemann, U., Peleska, J.: HybridUML Profile for
UML 2.0, University of Bremen. 2004.
[BBK98] Broy, M., von der Beeck, M., Krüger, I.: Softbed: Problemanalyse für ein Groß-
verbundprojekt ”Systemtechnik Automobil – Software für eingebettete Systeme”.
Ausarbeitung für das BMBF. 1998 (in German).
[BBN04] Blackburn, M., Busser, R., Nauman, A.: Why Model-Based Test Automation is
Different and What You Should Know to Get Started. In Proceedings of the Inter-
national Conference on Practical Software Quality. 2004.
[BBS04] Bienmüller, T., Brockmeyer, U., Sandmann, G.: Automatic Validation of Simu-
link/Stateflow Models, Formal Verification of Safety-Critical Requirements, Stutt-
gart. 2004.
[BDG07] Baker, P., Dai, Z. R., Grabowski, J., Haugen, Ø., Schieferdecker, I., Williams, C.:
Model-Driven Testing: Using the UML Testing Profile. ISBN-10: 3540725628,
ISBN-13: 978-3540725626. Springer-Verlag, 2007.
[BDH05] Brockmeyer, U., Damm, W., Hungar, H., Josko, B.: Modellbasierte Entwicklung
eingebetteter Systeme. In Proceedings of the Model-Based Development of Em-
bedded Systems, WS-Nr. 05022, Technischer Bericht, TUBS-SSE-2005-01. 2005
(in German).
[BEI95] Beizer, B.: Black-Box Testing: Techniques for Functional Testing of Software and
Systems. ISBN-10: 0471120944. John Wiley & Sons, Inc, 1995.
[BEN79] Bennet, S.: A History of Control Engineering, 1800-1930. ISBN: 0906048079.
Institution of Electrical Engineers, Stevenage, UK. 1979.
[BERT07] Bertolino, A.: Software Testing Research: Achievements, Challenges. In Proceed-
ings of the International Conference on Software Engineering 2007, Future of
Software Engineering, Pages: 85 – 103, ISBN: 0-7695-2829-5. 2007.
[BFM+05] Baleani, M., Ferrari, A., Mangeruca, L., Sangiovanni-Vincentelli, A. L., Freund,
U., Schlenker, E., Wolff, H.-J.: Correct-by-Construction Transformations across
Design Environments for Model-Based Embedded Software Development. In Pro-
ceedings of the Conference on Design, Automation and Test in Europe, Volume 2,
Pages: 1044 – 1049, ISBN: 1530-1591. IEEE Computer Society Washington, DC,
2005.](https://image.slidesharecdn.com/zanderdiss-130217192436-phpapp02/85/Zander-diss-231-320.jpg)
![208 BIBLIOGRAPHY
[BIN99] Binder, R.: Testing Object-Oriented Systems: Models, Patterns, and Tools. ISBN-
10: 0201809389. Addison-Wesley, 1999.
[BJK+05] Model-Based Testing of Reactive Systems, Editors: Broy, M., Jonsson, B., Katoen,
J.-P., Leucker, M., Pretschner, A., no. 3472. In LNCS, Springer-Verlag, 2005.
[BKB05] Bodeveix, J.-P., Koné, O., Bouaziz, R.: Test method for embedded real-time sys-
tems. In Proceedings of the European Workshop on Dependable Software Intensive
Embedded Systems, ERCIM, Pages: 1 – 10. Porto, 2005.
[BKL07] Bräuer, J., Kleinwechter, H., Leicher, A.: µTTCN – an approach to continuous
signals in TTCN-3. In Proceedings of Software Engineering (Workshops), Editors:
Bleek, W.-G., Schwentner, H., Züllighoven, H., Series LNI, Volume 106, Pages:
55 – 64, ISBN: 978-3-88579-200-0. GI, 2007.
[BKM07] Broy, M., Krüger, I. H., Meisinger, M.: A formal model of services. In ACM Trans.
Softw. Eng. Methodol. Volume 16, Issue 1, Article 5. 2007.
[BKP+07] Broy, M., Krüger, I. H., Pretschner, A., Salzmann, C.: Engineering Automotive
Software. In Proceedings of the IEEE, Volume 95, Number 2, Pages: 356 – 373.
2007.
[BM07] Bostroem, P., Morel, L.: Formal Definition of a Mode-Automata Like Architecture
in Simulink/Stateflow, Turku Centre for Computer Science, Technical Report, No
830, ISBN: 978-952-12-1922-1. Finland, 2007.
http://www.tucs.fi/publications/attachment.php?fname=TR830.pdf [07/10/08].
[BMW07] Bostroem, P., Morel, L., Waldén, M.: Stepwise Development of Simulink Models
Using the Refinement Calculus Framework, In Theoretical Aspects of Computing –
ICTAC 2007, Volume 4711/2007, Pages: 79 – 93, ISSN: 0302-9743 1611-3349,
ISBN: 978-3-540-75290-5. LNCS, Springer Berlin / Heidelberg 2007.
[BN02] Brökman, B., Notenboom, E.: Testing Embedded Software. ISBN: 978-0-3211-
5986-1. Addison-Wesley International, 2002.
[BOD05] Bodemann, C. D.: Function-oriented Model-Based Design Development for Real-
Time Simulators with MATLAB & Simulink. In Proceedings of the Model-Based
Design Conference, Munich. 2005.
[BRU87] Brundtland Report, Our Common Future. Published by the World Commission on
Environment and Development as Annex to General Assembly document
A/42/427, Development and International Co-operation: Environment, 1987.
http://www.un-documents.net/a42-427.htm [05/23/08]. ISBN-13: 978-0192820808,
Oxford: Oxford University Press, 1987.
[BS98] BS 7925-2:1998, Software testing. Software component testing, British Standards
Institution, ISBN: 0580295567. 1998.](https://image.slidesharecdn.com/zanderdiss-130217192436-phpapp02/85/Zander-diss-232-320.jpg)
![BIBLIOGRAPHY 209
[BSK04] Born, M., Schieferdecker, I., Kath, O. and Hirai, C.: Combining System Develop-
ment and System Test in a Model-centric Approach. In Proceedings of the RISE
2004, Luxembourg. 2004.
[BUR03] Burnstein, I.: Practical Software Testing, 1st edition. ISBN-10: 0387951318, ISBN-
13: 978-0387951317. Springer-Verlag, 2003.
[CBD+06] Chaparadza, R., Busch, M., Dai, Z. R., Hoffman, A., Lacmene, L., Ngwangwen,
T., Ndem, G. C., Serbanescu, D., Schieferdecker, I., Zander-Nowicka, J.: Trans-
formations: UML2 System Models “to” U2TP models, U2TP models “to” TTCN-3
models and, TTCN-3 Code Generation and Execution. In Proceedings of the
ECMDA workshop on Integration of Model Driven Development and Model
Driven Testing, Bilbao, Spain. 2006.
[CC00] Copi, I. M., Cohen, C.: Introduction to logic, 11th ed. Upper Saddle River, NJ:
Prentice-Hall, 2000.
[CC90] Chikofsky, E.J., Cross, J.H.: Reverse engineering and design recovery: a taxon-
omy, Software. In IEEE Software, Volume 7, Issue 1, Pages: 13 – 17, ISSN: 0740-
7459. 1990.
[CD06] Conrad, M., Dorr, H.: Model-Based Development of In-Vehicle Software, Design,
Automation and Test in Europe. In Proceedings of the DATE ‘06, Volume 1, 6-10,
Pages: 1 – 2. 2006.
[CDP+96] Cohen, D. M., Dalal, S. R., Parelius, J., Patton, G. C.: The Combinatorial Design
Approach to Automatic Test Generation. In IEEE Software, Volume 13, Issue 5,
Pages: 83 – 88, ISSN: 0740-7459, IEEE Computer Society Press Los Alamitos,
CA, 1996.
[CFB04] Conrad, M., Fey, I., Buhr, K.: Integration of Requirements into Model-Based De-
velopment. In Proceddings of the IEEE Joint Int. Requirements Engineering Conf.
2004: Workshop W-7 on Automotive Requirements Engineering (AuRE’04), Pages:
23 – 32, Nagoya, Japan. IEEE, 2004.
[CFG+05] Conrad, M., Fey, I., Grochtmann, M., Klein, T.: Modellbasierte Entwicklung ein-
gebetteter Fahrzeugsoftware bei DaimlerChrysler. In Informatik – Forschung und
Entwicklung, Volume 20, Numbers 1-2, ISSN: 0178-3564, 0949-2925. Springer-
Verlag Berlin/Heidelberg, 2005 (in German).
[CFS04] Conrad, M., Fey, I., Sadeghipour, S.: Systematic Model-based Testing of Embed-
ded Control Software – The MB3T Approach. In Proceedings of the ICSE 2004
Workshop on Software Engineering for Automotive Systems, Edinburgh, United
Kingdom. 2004.
[CH98] Conrad, M., Hötzer, D.: Selective Integration of Formal Methods in the Develop-
ment of Electronic Control Units. In Proceedings of the ICFEM 1998, 144-
Electronic Edition. 1998.](https://image.slidesharecdn.com/zanderdiss-130217192436-phpapp02/85/Zander-diss-233-320.jpg)
![210 BIBLIOGRAPHY
[CHM] Carnegie Mellon University, Department of Electrical and Computer Engineering,
Hybrid System Verification Toolbox for MATLAB – CheckMate, research tool for
system verification, http://www.ece.cmu.edu/~webk/checkmate/ [05/21/2008].
[CLP08] Carter, J. M., Lin, L., Poore, J. H.: Automated Functional Testing of Simulink Con-
trol Models. In Proceedings of the 1st Workshop on Model-based Testing in Prac-
tice – MoTip 2008. Editors: Bauer, T., Eichler, H., Rennoch, A., ISBN: 978-3-
8167-7624-6, Berlin, Germany. Fraunhofer IRB Verlag, 2008.
[CON04a] Conrad, M.: Modell-basierter Test eingebetteter Software im Automobil: Auswahl
und Beschreibung von Testszenarien. PhD thesis. Deutscher Universitätsverlag,
Wiesbaden (D), 2004 (in German).
[CON04b] Conrad, M.: A Systematic Approach to Testing Automotive Control Software, De-
troit U.S.A., SAE Technical Paper Series, 2004-21-0039. 2004.
[CON08] Continental Automotive, Adaptive Cruise Control – Chassis Electronics Combined
with Safety Aspects, ©Continental Teves AG & Co. oHG 2008, http://www.conti-
online.com/generator/www/de/en/cas/cas/themes/products/electronic_brake_and_s
afety_systems/driver_assistance_systems/acc_today_en.html [05/18/08].
[COP79] Copi, I. M.: Symbolic Logic (5th edition), Macmillan Coll Div, ISBN-10:
0023249803, ISBN-13: 9780023249808, April 1979.
[CS03] Caplat, G., Sourrouille, J. L. S.: Considerations about Model Mapping. In Proceed-
ings of the 4th Workshop in Software Model Engineering – in conjunction with the
Sixth International Conference on the Unified Modelling Language, San Francisco,
U.S.A. 2003. http://www.metamodel.com/wisme-2003/18.pdf [05/09/08].
[CTE] Razorcat Development GmbH, Classification Tree Editor for Embedded Systems –
CTE/ES, commercial tool for testing, http://www.razorcatdevelopment.de/
[04/20/08].
[DAG] Daimler AG, http://www.daimler.com/ [04/22/08].
[DAI04] Dai, Z. R.: Model-Driven Testing with UML 2.0. In Proceedings of the 2nd Euro-
pean Workshop on Model Driven Architecture (EWMDA), Canterbury, England.
2004.
[DAI06] Dai, Z. R.: An Approach to Model-Driven Testing with UML 2.0, U2TP and TTCN-
3. PhD thesis, Technical University Berlin, ISBN: 978-3-8167-7237-8. Fraunhofer
IRB Verlag, 2006.
[DCB04] Dajani-Brown, S., Cofer, D., Bouali, A.: Formal Verification of an Avionics Sen-
sor Voter Using SCADE. In Formal Techniques, Modelling and Analysis of Timed
and Fault-Tolerant Systems. Volume 3253/2004, LNCS, Pages: 5 – 20, ISBN: 978-
3-540-23167-7, ISSN: 0302-9743 1611-3349. Springer-Verlag Berlin/Heidelberg,
2004.](https://image.slidesharecdn.com/zanderdiss-130217192436-phpapp02/85/Zander-diss-234-320.jpg)
![BIBLIOGRAPHY 211
[DESS01] DESS – Software Development Process for Real-Time Embedded Software Sys-
tems, The DESS Methodology. Deliverable D.1, Version 01 – Public, Editors: van
Baelen, S., Gorinsek, J., Wills, A. 2001.
[DF03] Dulz, W., Fenhua, Z.: MaTeLo – Statistical Usage Testing by Annotated Sequence
Diagrams, Markov Chains and TTCN-3. In Proceedings of the 3rd International
Conference on Quality Software, Page: 336, ISBN: 0-7695-2015-4. IEEE Com-
puter Society Washington, DC, U.S.A., 2003.
[DFG01] Sequential Monte Carlo methods in practice. Editors: Doucet, A., de Freitas N.,
Gordon, N., ISBN: 0-387-95146-6. Springer-Verlag, New York, 2001.
[DGN04] Dai Z. R., Grabowski J., Neukirchen H., Pals H. From Design to Test – Applied to
a Roaming Algorithm for Bluetooth Devices. Next Generation Testing for Next
Generation Networks. In Proceedings of the TestCom 2004, St Anne’s College,
Oxford, UK. Springer-Verlag, 2004.
[DIJ72] Dijkstra, E. W.: Notes on Structured Programming. In Structured Programming,
Volume 8 of A.P.I.C. Studies in Data Processing, Part 1, Editor: Hoare C. A. R.,
Pages: 1 – 82. Academic Press, London/New York, 1972.
[DIN08] Din, G.: A Performance Test Design Method and its Implementation Patterns for
Multi-Services Systems. PhD thesis, Technical University Berlin. 2008.
[DM_D07] D-Mint Consortium. Deployment of model-based technologies to industrial testing,
Milestone 1, Deliverable 2.1 – Test Modeling, Test Generation and Test Execution
with Model-based Testing. 2007.
[D-Mint08] D-Mint Project – Deployment of model-based technologies to industrial testing.
2008. http://d-mint.org/ [05/09/08].
[DP80] Dormand Jr., Prince P.: A family of embedded Runge-Kutta formulae. In Journal
of Computational and Applied Mathematics, Pages: 19 – 26. 1980.
[DS02] Dempster, D., Stuart, M.: Verification methodology manual, Techniques for Verify-
ing HDL Designs, ISBN: 0-9538-4822-1. Teamwork International, June 2002.
[DSP] dSPACE GmbH, http://www.dspace.de/ww/en/gmb/home.cfm [04/22/08].
[DSW+03] Damm, W., Schulte, C., Wittke, H., Segelken, M., Higgen, U., Eckrich, M.: Forma-
le Verifikation von ASCET Modellen im Rahmen der Entwicklung der Aktivlen-
kung. Pages: 340 – 344. GI Jahrestagung (1) 2003 (in German).
[EKM+07] Ermagan, V., Krüger, I., Menarini, M., Mizutani, J.-I., Oguchi, K., May, W.D.:
Towards Model-Based Failure-Management for Automotive Software. In Proceed-
ings of the ICSE 4th International Workshop on Software Engineering for Automo-
tive Systems (SEAS’07), p. 8, Minneapolis, MN, U.S.A. IEEE Computer Society,
2007.](https://image.slidesharecdn.com/zanderdiss-130217192436-phpapp02/85/Zander-diss-235-320.jpg)
![212 BIBLIOGRAPHY
[EKM06] Ermagan, V., Krüger, I., Menarini, M.: Model-Based Failure Management for Dis-
tributed Reactive Systems. In Proceedings of the 13th Monterey Workshop, Compo-
sition of Embedded Systems, Scientific and Industrial Issues, Editors: Kordon, F,
Sokolsky, O., LNCS, Paris, France. Springer-Verlag, 2006.
[EMBV] OSC – Embedded Systems AG, EmbeddedValidator, commercial verification tool,
http://www.osc-es.de [04/20/08].
[EMC+99] Ehring, H., Mahr, B., Cornelius, F., Große-Rhode, M., Zeitz, P.: Mathematisch-
strukturelle Grundlagen der Informatik. Springer-Verlag, Barcelona, Berlin, Hei-
delberg, Hongkong, London, Mailand, New York, Paris, Singapur, Tokio, 1999 (in
German).
[ENC03] Encontre, V.: Testing embedded systems: Do you have the GuTs for it?. IBM,
2003. http://www-128.ibm.com/developerworks/rational/library/459.html
[04/18/2008].
[ERK04] Erkkinen, T.: Production Code Generation for Safety-Critical Systems. SAE 2004
World Congress & Exhibition. In SP-1822 – Planned by Diesel Engine Committee/
Powerplant Activity Governing Board. 2004.
[ETSI07] ETSI European Standard (ES) 201 873-1 V3.2.1 (2007-02): The Testing and Test
Control Notation version 3; Part 1: TTCN-3 Core Language. European Telecom-
munications Standards Institute, Sophia-Antipolis, France. 2007.
[EU06] European Commission Report on the Public Consultation, Review of the EU strat-
egy to reduce CO2 emissions and improve fuel efficiency from cars. 2006.
http://ec.europa.eu/environment/air/transport/co2/pdf/public_consultation_report.p
df [05/25/2008].
[FDI+04] Fokking, W. J., Deussen, P. H., Ioustinova, N., Seubers, J., van de Pol J.: Towards
model-based test generation and validation for TTCN-3, Milestone 1, Deliverable
1.2.1, Tests and Testing Methodologies with Advanced Languages (TT-Medal).
2004.
http://www.tt-medal.org/results/download/work1/D.1.2.1.v1.0.FINAL.Towards
ModelBasedTestGenerationAndValidationForTTCN-3_PUB.pdf [05/12/08].
[FG07] Farkas, T., Grund, D.: Rule Checking within the Model-Based Development of
Safety-Critical Systems and Embedded Automotive Software. In Proceedings of
the 8th International Symposium on Autonomous Decentralized Systems (IS-
ADS’07), Pages: 287 – 294. 2007.
[FRA05] Franzen T.: Gödel's Theorem: An Incomplete Guide to Its Use and Abuse. Pages:
172, ISBN-10: 1568812388, ISBN-13: 978-1568812380. A K Peters, Ltd., 2005.
[FS08] Frost and Sullivan, Strategic Analysis of the European Automotive Advanced Elec-
tronic Controller Markets, M1C6-18. March 2008.](https://image.slidesharecdn.com/zanderdiss-130217192436-phpapp02/85/Zander-diss-236-320.jpg)
![BIBLIOGRAPHY 213
[GCF06] Großmann, J., Conrad, M., Fey, I., Krupp, A., Lamberg, K., Wewetzer, C.: TestML
– A Test Exchange Language for Model-based Testing of Embedded Software. In
Proceedings of Automotive Workshop San Diego (ASWWSD2006). 2006.
[GG93] Grochtmann, M., Grimm, K.: Classification Trees for Partition Testing. In Software
Testing, Verification & Reliability, Volume 3, Number 2, Pages: 63 – 82. Wiley,
1993.
[GHS+07] Gehrke, M., Hirsch, M., Schäfer, W., Niggemann, O., Stichling, D., Nickel, U.:
Typisierung und Verifikation zeitlicher Anforderungen automotiver Software Sys-
teme. In Proceedings of Model Based Engineering of Embedded Systems III, Edi-
tors: Conrad, M., Giese, H., Rumpe, B., Schätz, B.: TU Braunschweig Report
TUBS-SSE 2007-01, 2007 (in German).
[GKS99] Grosu, R., Krüger, I., Stauner, T.: Hybrid Sequence Charts. Technical Report
TUM-I9914, Technische Universität München, 1999.
[GMS07] Gadkari, A. A., Mohalik, S., Shashidhar, K. C., Yeolekar, A., Suresh, J., Ramesh,
S.: Automatic Generation of Test-Cases Using Model Checking for SL/SF Models.
In Proceedings of MoDeVVa’07 in conjunction with MoDELS2007. Nashville, Te-
nesee. 2007. http://www.modeva.org/2007/modevva07.pdf [05/09/08].
[GOA05] Grindal, M., Offutt, J., Andler, S. F.: Combination testing strategies: a survey. In
Software Testing, Verification and Reliability. Volume 15, Issue 3, Pages: 167 –
199. John Wiley & Sons, Ltd., 2005.
[GR06] Guerrouat, A., Richter, H.: A component-based specification approach for embed-
ded systems using FDTs. In Proceedings of Specification and Verification of Com-
ponent-Based Systems Workshop (SAVCBS 2005), ACM SIGSOFT Software Engi-
neering Notes, Volume 31, Issue 2 (March 2006), Article No. 14, 2006, ISSN:
0163-5948, ACM New York, NY, U.S.A. 2006.
[GRI03] Grimm, K.: Software technology in an automotive company: major challenges. In
Proceedings of the 25th International Conference on Software Engineering, ISSN:
0270-5257, 0-7695-1877-X, Portland, Oregon, U.S.A., IEEE Computer Soci-
ety Washington, DC, 2003.
[GRI95] Grimm, K.: Systematisches Testen von Software. Eine neue Methode und eine ef-
fektive Teststrategie. PhD thesis, Technical University Berlin, GMD-Bericht, 251,
ISBN: 3-486-23547-8. GMD Forschungszentrum Informationstechnik, 1995 (in
German).
[GSW08] Großmann, J., Schieferdecker, I., Wiesbrock, H. W.: Modeling Property Based
Stream Templates with TTCN-3. In Proceedings of the IFIP 20th Intern. Conf. on
Testing Communicating Systems (TestCom 2008), Tokyo, Japan. 2008.
[GUT99] Gutjahr, W. J.: Partition testing vs. random testing: the influence of uncertainty. In
IEEE Transactions on Software Engineering, Volume 25, Issue 5, Pages: 661 –
674, ISSN: 0098-5589. IEEE Press Piscataway, NJ, 1999.](https://image.slidesharecdn.com/zanderdiss-130217192436-phpapp02/85/Zander-diss-237-320.jpg)
![214 BIBLIOGRAPHY
[GW07] Gips C., Wiesbrock H.-W. Notation und Verfahren zur automatischen Überprüfung
von temporalen Signalabhängigkeiten und -merkmalen für modellbasiert entwi-
ckelte Software. In Proceedings of Model Based Engineering of Embedded Systems
III, Editors: Conrad, M., Giese, H., Rumpe, B., Schätz, B.: TU Braunschweig Re-
port TUBS-SSE 2007-01, 2007 (in German).
[HEL+05] Helmerich, A., Koch, N. and Mandel, L., Braun, P., Dornbusch, P., Gruler, A.,
Keil, P., Leisibach, R., Romberg, J., Schätz, B., Wild, T. Wimmel, G.: Study of
Worldwide Trends and R&D Programmes in Embedded Systems in View of Maxi-
mising the Impact of a Technology Platform in the Area, Final Report for the Euro-
pean Commission, Brussels Belgium, 2005.
[HEN00] Henzinger, T. A.: The theory of hybrid automata. Proceedings of the 11th Annual
Symposium on Logic in Computer Science (LICS), IEEE Computer Society Press,
1996, Pages: 278 – 292. An extended version appeared in Verification of Digital
and Hybrid Systems, Editors: Inan, M. K., Kurshan, R. P., NATO ASI Series F:
Computer and Systems Sciences, Volume 170, Pages: 265 – 292. Springer-Verlag,
2000.
[HET98] Hetzel, W. C.: The Complete Guide to Software Testing. Second edition, ISBN: 0-
89435-242-3. QED Information Services, Inc, 1988.
[HP85] Harel, D., Pnueli, A.: On the Development of Reactive Systems. In K. R. Apt, Lo-
gics and Models of Concurrent Systems, NATO, ASI Series, Band 13, S. 447-498.
New York, ISBN: 0-387-15181-8. Springer-Verlag, 1985.
[IEC05] Functional safety and IEC 61508, 2005.
http://www.iec.ch/zone/fsafety/fsafety_entry.htm [05/09/08].
[IEG90] IEEE Standard Glossary of Software Engineering Terminology. IEEE Std. 610.12-
1990. E-ISBN: 0-7381-0391-8. 1990. http://www.scribd.com/doc/2893755/IEEE-
610121990-IEEE-Standard-Glossary-of-Software-Engineering-Terminology
[05/14/08].
[ISO_FS] ISO/NP PAS 26262, Road vehicles - Functional safety, http://www.iso.org/iso/
iso_catalogue/catalogue_tc/catalogue_detail.htm?csnumber=43464 [05/09/08].
[ISO04] ISO/IEC Standard No. 9126: Software engineering – Product quality; Parts 1–4.
Geneva, Switzerland, 2001-2004.
[ISTQB06] International Software Testing Qualification Board. Standard glossary of terms
used in Software Testing. Version 1.2, Produced by the ‘Glossary Working Party’,
Editor: van Veenendaal E. 2006.
[ITU96] ITU-TS. Recommendation Z.120: Message Sequence Chart (MSC). Geneva, 1996.
[ITU99] ITU-TS. Recommendation Z.120 (11/99): MSC 2000. Geneva, 1999.](https://image.slidesharecdn.com/zanderdiss-130217192436-phpapp02/85/Zander-diss-238-320.jpg)
![BIBLIOGRAPHY 215
[JJR05] Jeannet, B., Jéron, Rusu, V., Zinovieva, E.: Symbolic Test Selection Based on Ap-
proximate Analysis. In Proceedings of TACAS 2005. Editors: Halbwachs, N., Zuck,
L., LNCS 3440, Pages: 349 – 364, Berlin, Heidelberg. Springer-Verlag, 2005.
[JUMB] Software Quality Research Laboratory, Java Usage Model Builder Library –
JUMBL, research model-based testing prototype,
http://www.cs.utk.edu/sqrl/esp/jumbl.html [04/20/08].
[KH96] Kamen, E. W., Heck, B. S.: Fundamentals of Signals and Systems Using MATLAB.
ISBN-10: 0023619422, ISBN-13: 978-0023619427. Prentice Hall, 1996.
[KHJ07] Kamga, J., Herrmann, J., Joshi, P.: Deliverable: D-MINT automotive case study -
Daimler, Deliverable 1.1, Deployment of model-based technologies to industrial
testing, ITEA2 Project, 2007.
[KIL05] Kilian, K.: Modern Control Technology. Thompson Delmar Learning. ISBN: 1-
4018-5806-6. 2005.
[KLP+04] Kosmatov, N., Legeard, B., Peureux, F., Utting, M.: Boundary coverage criteria for
test generation from formal models. In Proceedings of the 15th International Sym-
posium on Software Reliability Engineering. ISSN: 1071-9458, ISBN: 0-7695-
2215-7, Pages: 139 – 150. IEEE Computer Society Washington, DC, 2004.
[KM08] Kröger, F., Merz, S.: Temporal Logic and State Systems Series: Texts in Theoreti-
cal Computer Science. 436 pages, ISBN: 978-3-540-67401-6. An EATCS Series,
2008.
[KRI05] Krishnan, R.: Future of Embedded Systems Technology, Research Report #G229R,
Market Study, Page: 354. BCCresearch, June 2005.
[KRÜ00] Krüger, I. H.: Distributed System Design with Message Sequence Charts. PhD the-
sis, Technische Universität München, 2000.
[KRÜ05] Krüger, I. H.: Service-oriented software and systems engineering - a vision for the
automotive domain. In Proceedings Formal Methods and Models for Co-Design.
(MEMOCODE '05). The third ACM and IEEE International Conference, Page:
150. 2005.
[KUO03] Kuo, B. C.: Automatic Control Systems, ISBN-10: 0471381489, ISBN-13: 978-
0471381488. Wiley & Sons, 2003.
[LABV] LabView, National Instruments, http://www.ni.com/labview/ [04/15/08].
[LBE+04] Lamberg, K., Beine, M., Eschmann, M., Otterbach, R., Conrad, M., Fey, I.: Model-
based testing of embedded automotive software using MTest. In Proceedings of
SAE World Congress, Detroit, US, 2004.](https://image.slidesharecdn.com/zanderdiss-130217192436-phpapp02/85/Zander-diss-239-320.jpg)
![216 BIBLIOGRAPHY
[LEH03] Lehmann, E. (then Bringmann, E.): Time Partition Testing, Systematischer Test des
kontinuierlichen Verhaltens von eingebetteten Systemen, PhD thesis, Technical
University Berlin, 2003 (in German).
[LIU08] Liu, T.: Development of UML Test Profile for Embedded Systems, Diploma Thesis,
Technical University Berlin, to be submitted in October 2008.
[LK08] Lehmann, E., Krämer, A.: Model-based Testing of Automotive Systems. In Pro-
ceedings of IEEE ICST 08, Lillehammer, Norway. 2008.
[LKK+06] Lehmann, E., Krämer, A., Lang, T., Weiss, S., Klaproth, Ch., Ruhe, J., Ziech, Ch.:
Time Partition Testing Manual, Version 2.4, 2006.
[LL90] Le Lann, G.: Critical issues for the development of distributed real-time computing
systems, G.; Distributed Computing Systems. In the Proceedings of the Second
IEEE Workshop on Future Trends of, Pages: 96 – 105, ISBN: 0-8186-2088-9,
Cairo. 1990.
[LN05] Lee, E. A., Neuendorffer, S.: Concurrent models of computation for embedded
software. In IEE Proceedings – Computers and Digital Technologies, Volume 152,
Issue 2, Pages: 239 – 250, ISSN: 1350-2387. 2005.
[LV04] Lazić, Lj., Velašević, D.: Applying simulation and design of experiments to the
embedded software testing process. In Software Testing, Verification & Reliability,
Volume 14, Issue 4, Pages: 257 – 282, ISSN: 0960-0833. John Wiley and Sons
Ltd. Chichester, UK, UK, 2004.
[LW00] Lehmann, E., Wegener, J.: Test Case Design by Means of the CTE XL. In Pro-
ceedings of the 8th European International Conference on Software Testing,
Analysis & Review (EuroSTAR 2000), Kopenhagen, Denmark. 2000.
[LY94] Lee, T., Yannakakis, M.: Testing Finite-State Machines: State Identification and
Verification. In IEEE Transactions on Computers, Volume 43, Issue 3, Pages: 306
– 320, ISSN: 0018-9340. IEEE Computer Society Washington, DC, 1994.
[LZ05] Lee, E. A., Zheng, H.: Operational Semantics of Hybrid Systems. In Proceedings
of Hybrid Systems: Computation and Control: 8th International Workshop, HSCC,
LNCS 3414, Zurich, Switzerland. 2005.
[MA00] Marre, B., Arnould, A.: Test sequences generation from LUSTRE descriptions:
GATEL. In Proceedings of ASE of the 15th IEEE International Conference on
Automated Software Engineering, Pages: 229 – 237, ISBN: 0-7695-0710-7, Greno-
ble, France. IEEE Computer Society Washington, DC, 2000.
[MAN85] Mandl, R.: Orthogonal Latin Squares: An application of experiment design to
compiler testing. In Communications of the ACM, Volume 28, Issue 10, Pages:
1054 – 1058, ISSN: 0001-0782. ACM New York, NY, U.S.A., 1985.
[MATHML] The MathWorks™, Inc., MATLAB®, http://www.mathworks.com/products/matlab/
http://www.mathworks.com/access/helpdesk/help/techdoc/matlab.html [05/09/08].](https://image.slidesharecdn.com/zanderdiss-130217192436-phpapp02/85/Zander-diss-240-320.jpg)
![BIBLIOGRAPHY 217
[MATHSF] The MathWorks™, Inc., Stateflow®,
http://www.mathworks.com/products/stateflow/ [05/09/08],
http://www.mathworks.com/access/helpdesk/help/toolbox/stateflow/ [05/09/08].
[MATHSL] The MathWorks™, Inc., Simulink®,
http://www.mathworks.com/products/simulink/ [05/09/08],
http://www.mathworks.com/access/helpdesk/help/toolbox/simulink/ [05/09/08].
[MATL] All4Tec, Markov Test Logic – MaTeLo, commercial model-based testing tool,
http://www.all4tec.net/ [04/20/08].
[MATT] The University of Montana, MATLAB Automated Testing Tool – MATT, research
model-based testing prototype, http://www.cs.umt.edu/RTSL/matt/ [04/20/08].
[MBG] MBTech Group, http://www.mbtech-
group.com/cz/electronics_solutions/test_engineering/provetechta_overview.html
[04/22/08].
[MDA] OMG: MDA Guide V1.0.1, June, 2003. http://www.omg.org/docs/omg/03-06-
01.pdf [05/09/08].
[MEN97] Mendelson, E.: Introduction to Mathematical Logic, 4th Edition, ISBN-10:
412808307, ISBN-13: 978-0412808302. Chapman & Hall/CRC, 1997.
[MEVAL] IT Power Consultants, MEval, commercial tool for testing,
http://www.itpower.de/meval.html [04/20/2008].
[MIS] The Motor Industry Software Reliability Association (MISRA),
http://www.misra.org.uk/ [05/26/2008].
[MLN03] Mikucionis, M., Larsen, K. G, Nielsen, B.: Online On-the-Fly Testing of Real-time
Systems, ISSN 0909-0878. BRICS Report Series, RS-03-49, Denmark, 2003.
[MOD] Modelica Association, http://www.modelica.org/ [04/15/08].
[MOF] OMG: Meta-Object Facility (MOF), version 1.4,
http://www.omg.org/technology/documents/formal/mof.htm [05/09/08].
[MOS97] Mosterman, P. J.: Hybrid dynamic systems: a hybrid bond graph modeling para-
digm and its application in diagnosis, PhD thesis, Faculty of the Graduate School
of Vanderbilt University, Electrical Engineering. 1997.
[MP07] Marrero Pérez, A.: Simulink Test Design for Hybrid Embedded Systems, Diploma
Thesis, Technical University Berlin, January 2007.
[MRG] The MathWorks™, Inc., MATLAB® Report Generator™,
http://www.mathworks.com/products/ML_reportgenerator/ [05/11/08].](https://image.slidesharecdn.com/zanderdiss-130217192436-phpapp02/85/Zander-diss-241-320.jpg)
![218 BIBLIOGRAPHY
[MSF05] Mann, H., Schiffelgen, H., Froriep, R.: Einführung in die Regelungstechnik, Ana-
loge und digitale Regelung, Fuzzy-Regler, Regel-Realisierung, Software. ISBN-10:
3-446-40303-5. Hanser Fachbuchverlag, 2005 (in German).
[MTEST] dSPACE GmbH, MTest, commercial MBT tool,
http://www.dspaceinc.com/ww/en/inc/home/products/sw/expsoft/mtest.cfm
[04/20/2008].
[MW04] Maxton, G. P., Wormald, J.: Time for a Model Change: Re-engineering the Global
Automotive Industry, ISBN: 978-0521837156. Cambridge University Press, 2004.
[MW91] Marzullo, K., Wood, M.: Making real-time reactive systems reliable. In ACM SI-
GOPS Operating Systems Review, Volume 25, Issue 1 (January 1991), Pages: 45 –
48, ISSN: 0163-5980, New York, U.S.A. ACM Press New York, 1991.
[MYE79] Myers, G. J.: The Art of Software Testing. ISBN-10: 0471043281. John Wiley &
Sons, 1979.
[NEU04] Neukirchen, H. W.: Languages, Tools and Patterns for the Specification of Dis-
tributed Real-Time Tests, PhD thesis, Georg-August-Universiät zu Göttingen,
2004. http://webdoc.sub.gwdg.de/diss/2004/ neukirchen/index.html [05/09/08].
[NK04] Neema, S., Karsai, G.: Embedded Control Systems Language for Distributed Proc-
essing (ECSL-DP), Technical report, ISIS-04-505, Vanderbilt University, 2003-
2004.
[NLL03] Nicol, D. M., Liu, J., Liljenstam, M., Guanhua, Y.: Simulation of large scale net-
works using SSF. In Proceedings of the 35th conference on Winter simulation: driv-
ing innovation, Volume 1, Pages: 650 – 657, Vol.1, New Orleans, Louisiana.
ACM, 2003.
[NM07] Nickovic, D., Maler, O.: AMT: A Property-based Monitoring Tool for Analog Sys-
tems. In Proceedings of the Formal Modelling and Analysis of Timed Systems
(FORMATS), Volume 4763/2007, ISSN: 0302-9743, 1611-3349, ISBN: 978-3-
540-75453-4, Pages: 304 – 319. Springer-Verlag Berlin/Heidelberg, 2007.
[NSK03] Neema, S., Sztipanovits, J., Karsai, G.: Constraint-Based Design-Space Explora-
tion and Model, Synthesis. In Proceedings of EMSOFT 2003, Pages: 290 – 305,
LNCS 2855, 2003.
[OECD05] OECD Science, Technology and Industry: Scoreboard 2005. Volume 2005, Issue
30, Complete Edition – ISBN: 9264010556, Industry, Services & Trade, Pages: 1 –
214. 2005.
[OECD08] OECD Factbook 2008: Economic, Environmental and Social Statistics, ISBN: 92-
64-04054-4, © OECD 2008.
[OLE07] Olen, M.: The New Wave in Functional Verification: Algorithmic Testbench Tech-
nology, white paper, Mentor Graphics Corporation. 2007.
http://www.edadesignline.com/showArticle.jhtml?articleID=197800043 [08/08/08].](https://image.slidesharecdn.com/zanderdiss-130217192436-phpapp02/85/Zander-diss-242-320.jpg)
![BIBLIOGRAPHY 219
[PFT+92] Press, W. H., Flannery, B. P., Teukolsky, S. A., Vetterling, W. T.: "Runge-Kutta
Method" and "Adaptive Step Size Control for Runge-Kutta." §16.1 and 16.2 in
Numerical Recipes in FORTRAN: The Art of Scientific Computing, 2nd ed.,
Pages: 704 – 716, Cambridge, England: Cambridge University Press, 1992.
[PHPS03] Philipps, J., Hahn, G., Pretschner, A., Stauner, T.: Prototype-based tests for hybrid
reactive systems. In Proceedings of the 14th IEEE International Workshop on
Rapid Systems Prototyping, Pages: 78 – 84, ISSN: 1074-6005, ISBN: 0-7695-
1943-1. IEEE Computer Society, Washington, DC, U.S.A., 2003.
[POR96] Porat, B.: A Course in Digital Signal Processing, 632 pages, ISBN-10:
0471149616, ISBN-13: 978-0471149613. Wiley, 1996.
[PPW+05] Pretschner, A., Prenninger, W., Wagner, S., Kühnel, C., Baumgartner, M.,
Sostawa, B., Zölch, R., Stauner, T.: One evaluation of model-based testing and its
automation. In Proceedings of the 27th International Conference on Software Engi-
neering, St. Louis, MO, U.S.A., Pages: 392 – 401, ISBN: 1-59593-963-2. ACM
New York, NY, USA, 2005.
[PRE03] Pretschner, A.: Compositional generation of MC/DC integration test suites. In Pro-
ceedings TACoS'03, Pages: 1 – 11. Electronic Notes in Theoretical Computer Sci-
ence 6, 2003. http://citeseer.ist.psu.edu/633586.html [05/09/08].
[PRE03b] Pretschner, A.: Zum modellbasierten funktionalen Test reaktiver Systeme. PhD the-
sis. Technical University Munich, 2003 (in German).
[PRE04] Pretschner, A., Slotosch, O., Aiglstorfer, E., Kriebel, S.: Model Based Testing for
Real – The Inhouse Card Case Study. In International Journal on Software Tools
for Technology Transfer. Volume 5, Pages: 140 – 157. Springer-Verlag, 2004.
[PRO03] Prowell, S. J.: JUMBL: A Tool for Model-Based Statistical Testing. In Proceed-
ings of the 36th Annual Hawaii International Conference on System Sciences
(HICSS'03), Volume 9, ISBN: 0-7695-1874-5. IEEE Computer Society Washing-
ton, DC, 2003.
[PTD05] ETSI Draft Technical Report DTR/MTS-00091, v.1.2.1. Methods for Testing and
Specification (MTS); Patterns in Test Development (PTD), European Telecommu-
nications Standards Institute, Sophia-Antipolis, France. 2005.
[RAU02] Rau, A.: Model-Based Development of Embedded Automotive Control Systems,
PhD thesis, University of Tübingen, 2002.
[REACTT] Reactive Systems, Inc., Reactis Tester, commercial model-based testing tool,
http://www.reactive-systems.com/tester.msp [04/20/08].
[REACTV] Reactive Systems, Inc., Reactis Validator, commercial validation and verification
tool, http://www.reactive-systems.com/reactis/doc/user/user009.html,
http://www.reactive-systems.com/validator.msp [07/03/08].](https://image.slidesharecdn.com/zanderdiss-130217192436-phpapp02/85/Zander-diss-243-320.jpg)
![220 BIBLIOGRAPHY
[ROT98] Richardson, D, O'Malley, O., Tittle, C.: Approaches to specification-based testing.
In Proceedings of ACM SIGSOFT Software Engineering Notes, Volume 14, Issue
8, Pages: 86 – 96, ISSN: 0163-5948. ACM New York, NY, 1998.
[RT92] RTCA/DO-178B, Software Considerations in Airborne Systems and Equipment
Certification. Washington, D.C., Radio Technical Commission for Aeronautics
(RTCA, Inc.), 1992. http://www.rtca.org/ [05/09/08].
[SBG06] Schieferdecker, I., Bringmann, E., Grossmann, J.: Continuous TTCN-3: Testing of
Embedded Control Systems. In Proceedings of the 2006 International Workshop
on Software Engineering for Automotive Systems, International Conference on
Software Engineering, ISBN: 1-59593-402-2, Shanghai, China. ACM New York
Press, 2006.
[SCB] TNI-Software, Safety Checker Blockset, commercial model-based testing tool,
http://www.tni-software.com/en/produits/safetychecker blockset/index.php
[04/20/08].
[SCD+07] Stürmer, I., Conrad, M., Dörr, H., Pepper P.; Systematic Testing of Model-Based
Code Generators. In IEEE Transactions on Software Engineering. Volume 33, Is-
sue 9, Pages: 622 – 634, ISSN: 0098-5589. IEEE Press Piscataway, NJ, 2007.
[SCH06] Schmid, M.: Automotive Bus Systems. In Atmel Applications Journal. Automotive
Applications, Volume 6. ATMEL® Applications Journal Winter, 2006.
[SD07] Sims S., DuVarney D. C.: Experience Report: the Reactis Validation Tool. In Pro-
ceedings of the ICFP '07 Conference, Volume 42, Issue 9, Pages: 137 – 140, ISSN:
0362-1340. ACM New York, NY, U.S.A., 2007.
[SDG+07] Stürmer, I., Dörr, H., Giese, H., Kelter, U., Schürr, A., Zündorf, A.: Das MATE
Projekt - visuelle Spezifikation von MATLAB-Analysen und Transformationen. In
Proceedings of the Dagstuhl-Workshop: Model-Based Development of Embedded
Systems (MBEES), Pages: 73 – 82, Editors: Conrad, M., Giese, H., Rumpe, B.,
Schätz, B., Informatik-Bericht, Number 2007-1, Schloss Dagstuhl, Germany.
Technische Universität Braunschweig, 2007 (in German).
[SG03] Spencer, R. R., Ghausi, M. S.: Introduction to electronic circuit design. ISBN:
0201361833 9780201361834. Upper Saddle River, N.J.: Prentice Hall/Pearson
Education, Inc., 2003.
[SG07] Schieferdecker, I., Großmann, J.: Testing Embedded Control Systems with TTCN-
3. In Proceedings Software Technologies for Embedded and Ubiquitous Systems
SEUS 2007, Pages: 125 – 136, LNCS 4761, ISSN: 0302-9743, 1611-3349, ISBN:
978-3-540-75663-7 Santorini Island, Greece. Springer-Verlag Berlin/Heidelberg,
2007.
[SL05] Spillner, A., Linz, T.: Basiswissen Softwaretest, Aus- und Weiterbildung zum Certi-
fied Tester Foundation Level nach ASQF- und ISTQB-Standard. ISBN: 3-89864-
358-1. dpunkt.Verlag GmbH Heidelberg, 2005 (in German).](https://image.slidesharecdn.com/zanderdiss-130217192436-phpapp02/85/Zander-diss-244-320.jpg)
![BIBLIOGRAPHY 221
[SLDV] The MathWorks™, Inc., Simulink® Design Verifier™, commercial model-based
testing tool, http://www.mathworks.com/products/sldesignverifier [04/20/2008].
[SLVV] The MathWorks™, Inc., Simulink® Verification and Validation™, commercial
model-based verification and validation tool,
http://www.mathworks.com/products/simverification/ [04/20/2008].
[SM01] Sax, E., Müller-Glaser, K.-D.; A Seamless, Model-based Design Flow for Embed-
ded Systems in Automotive Applications. In Proceedings of the 1st International
Symposium on Automotive Control, Shanghai, China, 2001.
[SOE00] Soejima S.: Examples of usage and spread of Dymola within Toyota. In Proceed-
ings of Modelica Workshop 2000, Pages: 55 – 60, Lund, Sweden. 2000.
[SRG] The MathWorks™, Inc., Simulink® Report Generator™,
http://www.mathworks.com/products/SL_reportgenerator/ [05/11/08].
[SRK+00] Silva, B. I., Richeson K., Krogh B., Chutinan A.: Modeling and verifying hybrid
dynamic systems using CheckMate. In Proceedings of the 4th International Confer-
ence on Automation of Mixed Processes (ADPM 2000), Pages: 237 – 242. 2000.
[STB] TNI-Software, Safety Test Builder, commercial model-based testing tool,
http://www.tni-software.com/en/produits/safetytestbuilder/index.php [04/20/08].
[STEST] The MathWorks™, Inc., SystemTest™, commercial tool for testing,
http://www.mathworks.com/products/systemtest/ [04/20/2008].
[SYN05] SynaptiCAD News: SynaptiCAD and Actel Press Release, January 2005,
http://www.syncad.com/pr_wl_rtb_actel_2005.htm?%20SynaptiCADSes-
sionID=ab62c5f8b4595890f2 [05/08/08].
[SZ06] Schäuffele, J., Zurawka, T.: Automotive Software Engineering, ISBN: 3528110406.
Vieweg, 2006.
[TB04] Torrisi, F. D., Bemporad, A.: HYSDEL – a tool for generating computational hy-
brid models for analysis and synthesis problems. In IEEE Transactions on Control
Systems Technology, Volume: 12, Issue: 2, Pages: 235 – 249, ISSN: 1558-0865.
IEEE, 2004.
[TELD] Telelogic® AB, Telelogic DOORS®,
http://www.telelogic.com/products/doors/index.cfm [07/03/08].
[TEM08] TEMEA Project – Testspezifikationstechnologie und -methodik für eingebettete
Echtzeitsysteme im Automobil, http://www.temea.org/ [05/11/08] (in German).
[TIW02] Tiwari, A.: Formal semantics and analysis methods for Simulink Stateflow models.
SRI International. Technical report, 2002. http://www.csl.sri.com/~tiwari/
stateflow.html [05/09/08].](https://image.slidesharecdn.com/zanderdiss-130217192436-phpapp02/85/Zander-diss-245-320.jpg)
![222 BIBLIOGRAPHY
[TPT] PikeTec, Time Partitioning Testing – TPT, commercial model-based testing tool,
http://www.piketec.com/products/tpt.php [04/20/2008].
[TUN04] Tung, J.: From Specification and Design to Implementation and Test: A Platform
for Embedded System Development, The MathWorks Automotive Workshop,
2004.
[TVEC] T-VEC Technologies, Inc., Test VECtor Tester for Simulink – T-VEC, commercial
model-based testing tool, http://www.t-vec.com/solutions/simulink.php [07/03/08].
[TYZ+03] Tsai, W. T., Yu, L., Zhu, F., Paul, R.: Rapid Verification of Embedded Systems
Using Patterns. In Proceedings of the 27th Annual International Computer Software
and Applications Conference (COMPSAC 2003), Pages: 466 – 471, ISBN: 0-7695-
2020-0, 2003.
[TYZ05] Tsai, W.-T., Yu, L., Zhu, F., Paul, R.: Rapid embedded system testing using verifi-
cation patterns. In IEEE Software, Volume 22, Issue 4, Pages: 68 – 75, ISSN:
0740-7459, Los Alamitos, CA, USA. IEEE Computer Society Press, 2005.
[UL06] Utting M., Legeard B. Practical Model-Based Testing: A Tools Approach. ISBN-
13: 9780123725011. Elsevier Science & Technology Books, 2006.
[UML] OMG: UML 2.0 Superstructure Final Adopted Specification,
http://www.omg.org/cgi-bin/doc?ptc/2003-08-02 [05/09/08].
[UPL06] Utting M., Pretschner A., Legeard B. A taxonomy of model-based testing, ISSN:
1170-487X, 2006.
[UTP] OMG: UML 2.0 Testing Profile. Version 1.0 formal/05-07-07. Object Management
Group, 2005.
[UTT05] Utting M. Model-Based Testing. In Proceedings of the Workshop on Verified Soft-
ware: Theory, Tools, and Experiments VSTTE 2005. 2005.
[VECI] Vector Informatik GmbH, http://www.vector-worldwide.com/ [04/22/08].
[VM06] V-Modell® XT, version 1.2.1, 2006, ftp://ftp.tu-
clausthal.de/pub/institute/informatik/v-modell-xt/Releases/1.2.1/Documentation/V-
Modell-XT-Complete.pdf [07/05/08].
[VS04] Vouffo-Feudjio, A., Schieferdecker, I.: Test Patterns with TTCN-3. In Proceedings
Formal Approaches to Software Testing, 4th International Workshop (FATES
2004), Pages: 170 – 179, ISSN: 0302-9743, ISBN: 978-3-540-25109-5, Volume
3395 LNCS, Linz, Austria. Springer-Verlag, 2005.
[VS06] Vega D.-E., Schieferdecker I., Din G.. Towards Quality of TTCN-3 Tests. In Pro-
ceedings of SAM’06: Fifth Workshop on System Analysis and Modeling, May 31–
June 2, University of Kaiserslautern, Germany, 2006.](https://image.slidesharecdn.com/zanderdiss-130217192436-phpapp02/85/Zander-diss-246-320.jpg)
![BIBLIOGRAPHY 223
[VSD07] Vega, D., Schieferdecker, I., Din, G.: Test Data Variance as a Test Quality Meas-
ure: Exemplified for TTCN-3. In Proceedings Testing of Software and Communi-
cating Systems 2007, Volume 4581, Pages: 351 – 364, ISBN: 978-3-540-73065-1,
ISSN: 0302-9743, 1611-3349. Springer-Verlag Berlin/Heidelberg, 2007.
[WAL01] Wallmüller E. Software- Qualitätsmanagement in der Praxis. ISBN-10:
3446213678. Hanser Verlag, 2001 (in German).
[WCF02] Wiesbrock, H.-W., Conrad M., Fey, I.: Pohlheim, Ein neues automatisiertes Aus-
werteverfahren für Regressions und Back-to-Back-Tests eingebetteter Regelsyste-
me, In Softwaretechnik-Trends, Volume 22, Issue 3, Pages: 22 – 27. 2002 (in Ger-
man).
[WEY88] Weyuker, E.: The Evaluation of Program-based Software Test Data Adequacy Cri-
teria. In Communications of the ACM, Volume 31, Issue 6, Pages: 668 – 675,
ISSN: 0001-0782. ACM New York, 1988.
[WG07] Wiesbrock, H.-W. Gips, C.: Konzeption eines Tools zur automatischen Testauswer-
tung von Hard- und Softwaretests. Unpublished. 2007 (in German).
[WTB] SynaptiCAD, Waveformer Lite 9.9 Test-Bench with Reactive Test Bench, commer-
cial tool for testing, http://www.actel.com/documents/reactive_tb_tutorial.pdf
[04/20/08].
[WW06] Wappler, S., Wegener, J.: Evolutionary unit testing of object-oriented software
using strongly-typed genetic programming. In Proceedings of the 8th Annual Con-
ference on Genetic and Evolutionary Computation, Pages: 1925 – 1932, ISBN: 1-
59593-186-4 Seattle. Washington, U.S.A. ACM, 2006.
[XIO08] Xiong, X.: Systematic Test Data Generation for Embedded Systems, Diploma The-
sis, Technical University Berlin, February 2008.
[ZAN07] Zander-Nowicka, J.: Reactive Testing and Test Control of Hybrid Embedded Soft-
ware. In Proceedings of the 5th Workshop on System Testing and Validation (STV
2007), in conjunction with ICSSEA 2007, Editors: Garbajosa, J., Boegh, J., Rodri-
guez-Dapena, P., Rennoch, A., Pages: 45 – 62, ISBN: 978-3-8167-7475-4, Paris,
France. Fraunhofer IRB Verlag, 2007.
[ZDS+05] Zander, J., Dai, Z. R., Schieferdecker, I., Din, G.: From U2TP Models to Executa-
ble Tests with TTCN-3 - An Approach to Model Driven Testing. In Proceedings of
the IFIP 17th Intern. Conf. on Testing Communicating Systems (TestCom 2005),
ISBN: 3-540-26054-4, Montreal, Canada. Springer-Verlag, 2005.
[ZMS07a] Zander-Nowicka, J., Marrero Pérez, A., Schieferdecker, I.: From Functional Re-
quirements through Test Evaluation Design to Automatic Test Data Retrieval – a
Concept for Testing of Software Dedicated for Hybrid Embedded Systems. In Pro-
ceedings of the IEEE 2007 World Congress in Computer Science, Computer Engi-
neering, & Applied Computing; SERP 2007, Editors: Arabnia, H. R., Reza, H.,
Volume II, Pages: 347 – 353, ISBN: 1-60132-019-1, Las Vegas, NV, U.S.A.
CSREA Press, 2007.](https://image.slidesharecdn.com/zanderdiss-130217192436-phpapp02/85/Zander-diss-247-320.jpg)
![224 BIBLIOGRAPHY
[ZMS07b] Zander-Nowicka, J., Marrero Pérez, A., Schieferdecker, I., Dai, Z. R.: Test Design
Patterns for Embedded Systems. In Business Process Engineering. Conquest-
Tagungsband 2007 – Proceedings of the 10th International Conference on Quality
Engineering in Software Technology, Editors: Schieferdecker, I., Goericke, S.,
ISBN: 3898644898, Potsdam, Germany. dpunkt.Verlag GmbH, 2007.
[ZS07] Zimmermann, W., Schmidgall, R.: Bussysteme in der Fahrzeugtechnik Protokolle
und Standards, ATZ-MTZ Fachbuch, ISBN: 9783834802354. Vieweg
Friedr.+Sohn Verlag, 2007 (in German).
[ZSF06] Zander-Nowicka, J., Schieferdecker, I., Farkas, T.: Derivation of Executable Test
Models From Embedded System Models using Model Driven Architecture Arte-
facts - Automotive Domain. In Proceedings of the Model Based Engineering of
Embedded Systems II (MBEES II), Editors: Giese, H., Rumpe, B., Schätz, B., TU
Braunschweig Report TUBS-SSE 2006-01, Dagstuhl, Germany. 2006.
[ZSM06] Zander-Nowicka, J., Schieferdecker, I., Marrero Pérez, A.: Automotive Validation
Functions for On-line Test Evaluation of Hybrid Real-time Systems. In Proceed-
ings of the IEEE 41st Anniversary of the Systems Readiness Technology Conference
(AutoTestCon 2006), IEEE Catalog Number: 06CH37750C, ISBN: 1-4244-0052-
X, ISSN: 1088-7725, Anaheim, CA, U.S.A. IEEE, 2006.
[ZVS+07] Zeiss, B., Vega, D., Schieferdecker, I., Neukirchen, H., Grabowski, J.: Applying
the ISO 9126 quality model to test specifications – exemplified for TTCN-3 test
specifications. In Proceedings Software Engineering 2007, Editors: Bleek, W.-G.,
Raasch, J., Züllighoven, H., Pages: 231 – 244, ISBN: 978-3-88579-199-7. GI-LNI,
2007.
[ZXS08] Zander-Nowicka, J., Xiong, X., Schieferdecker, I.: Systematic Test Data Genera-
tion for Embedded Software. In Proceedings of the IEEE 2008 World Congress in
Computer Science, Computer Engineering, & Applied Computing; The 2008 Inter-
national Conference on Software Engineering Research and Practice (SERP
2008), Editors: Arabnia H. R., Reza H., Volume I, Pages: 164 – 170, ISBN: 1-
60132-086-8, Las Vegas, NV, U.S.A. CSREA Press, 2008.](https://image.slidesharecdn.com/zanderdiss-130217192436-phpapp02/85/Zander-diss-248-320.jpg)
![Appendix A
List of Model-based Test Tools and Approaches
List of selected model-based test (MBT) approaches in the context of embedded systems rele-
vant for the development of this thesis.
Table A: Classification of Selected Test Approaches Based on the MBT Taxonomy.
Test Test Test Test Description
Link
Approach, Generation Execution Evaluation
Tool Selection Options Specification
Criteria and
and Technology Technology
CTE/ES - data coverage - does not - does not apply Classification Tree Editor for Embedded
www.razorcatdevelopment.de
- requirements apply 46 here as the test Systems (CTE/ES) implements the Clas-
coverage - non-reactive evaluation is sification Tree Method (CTM) [Con04a].
- test case not supported The SUT inputs form the classifications
specification at all in the roots of the tree. Then, the input
- manual ranges are divided into classes according
generation to the equivalence partitioning method.
- offline The test cases are specified by selecting
generation leaves of the tree in the combination
table. A line in the table specifies a test
case. CTE/ES provides a way of finding
test cases systematically. It breaks the test
scenario design process down into steps.
Additionally, the test scenario is visual-
ized in a GUI.
46
Unless otherwise noted, the expression ‘does not apply’ is used when the test approach does not explicitly name the par-
ticular option or when the option does not matter in the context of a particular approach. In that case further deep investi-
gation is needed to assess the option.](https://image.slidesharecdn.com/zanderdiss-130217192436-phpapp02/85/Zander-diss-249-320.jpg)
![226 APPENDIX A
Embed- - does not apply - MiL, SiL - requirements EmbeddedValidator [BBS04] is the
www.osc-es.de
ded Vali- - automatic - non-reactive coverage model verification tool used for verifying
dator generation - manual temporal and causal safety-critical re-
- model checking specification quirements of models designed in SL/SF
- offline - does not apply and TargetLink. The method offers a set
generation of test behavior patterns like “an output is
set only after certain input values are
observed” based on model checking. It is
limited mainly to discrete model sectors.
The actual test evaluation method offers a
basic set of constraints for extracting
discrete signal properties.
JUMBL - random and - MiL, SiL 47 - requirements The Java Usage Model Builder Library
www.cs.utk.edu/sqrl/esp/jumbl.html
stochastic - non-reactive coverage (JUMBL) can generate test cases as a
criteria - automatic collection of test cases which cover the
- automatic specification model with the minimum cost, by random
generation - offline sampling with replacement, by probabil-
- offline evaluation ity, or by interleaving the events of other
generation test cases. The usage models are finite-
state, time homogeneous Markov chains,
characterized as deterministic finite
automata with probabilistic transitions
[Pro03]. There is also an interactive test
case editor for creating test cases by hand.
In [CLP08] the approach is used for test-
ing SL/SF control models.
MaTeLo - random and - MiL, SiL - requirements Markov Test Logic (MaTeLo) tool can
www.all4tec.net
stochastic - non-reactive coverage generate test suites according to several
criteria - automatic algorithms. Each of them optimizes the
- automatic specification test effort according to the objectives such
generation - offline as boundary values, functional coverage,
- offline evaluation and reliability level. Test cases are gener-
generation ated in XML/HTML format for manual
execution or in TTCN-3 [ETSI07] for
automatic execution [DF03].
MATT - data coverage - MiL, SiL - reference MATLAB Automated Testing Tool
www.cs.umt.edu/RTSL/matt
- automatic - non-reactive signals-based (MATT) uses information that it obtains
generation - manual from ML/SL model in order to create a
- offline specification set of input test data. With a series of
generation - offline point and click selections the data can be
evaluation set for each input port and parameters can
be adjusted for accuracy, constant, mini-
mum and maximum values. Once each
input port has been set up, the test data
matrix can be generated. The test matrix
output is then returned to ML for simula-
tion, code generation, comparison.
47
For SiL, PiL and HiL test adapters and test drivers are needed.](https://image.slidesharecdn.com/zanderdiss-130217192436-phpapp02/85/Zander-diss-250-320.jpg)
![APPENDIX A 227
MEval - does not apply - MiL, SiL, - reference MEval offers an automatic comparison of
www.itpower.de/meval.html
since here back- PiL, HiL signals-based test signals with their reference signals in
to-back regres- - non-reactive - manual ML/SL, provided that the reference sig-
sion tests are specification nals are given. The tool applies innova-
considered. - offline tive two-stage algorithms [WCF02]. Its
evaluation strength is the successive use of the pre-
processor and comparison component for
signal evaluation.
MiLEST - data coverage - MiL, - reference Model-in-the-Loop for Embedded System
www.fokus.fraunhofer.de/en/motion/ueber_motion/index.html
- requirements extendable signal- Test (MiLEST) is desirable for functional
coverage to SiL, PiL, feature – based black-box testing of embedded hybrid
- test case specifi- HiL - requirements software. A new method for the system
cations - reactive coverage stimulation and evaluation is supported,
- automatic - test evaluation which breaks down requirements into
generation specifications characteristics of specific signal features.
- offline - automatic and A novel understanding of a signal is
generation manual speci- defined that enables its description in an
fication 48 abstract way based on its properties (e.g.,
- online decrease, constant, maximum).
evaluation Technically, MiLEST is a Simulink add-
on built on top of the ML engine that
represents an extension towards model-
based testing activities. MiLEST consists
of a library including callback functions,
transformation functions, and other
scripts.
Reusable test patterns, generic validation
functions and patterns for test data gen-
erators are provided. Transformations
contribute to the automation of the test
development process. Test data variants
are created systematically and automati-
cally. Reactive testing is also supported.
MTest - data coverage - MiL, SiL, - reference MTest [MTest] combines the classical
www.dspaceinc.com/ww/en/inc/home/products/sw/expsoft/mtest.cfm
- requirements PiL, HiL signals-based module test with model-based develop-
coverage - non-reactive - manual ment. The central element of the tool is
- test case specification the CTM and CTE/ES. It is integrated
specification - offline with SL and TargetLink. Once the test
- manual evaluation cases are designed in CTE/ES, MTest
generation introduces such tasks as test development,
- offline test execution, test evaluation and test
generation management. It enables SUT output sig-
nals to be compared with previously
obtained reference signals using a reproc-
essing component and the difference
matrix method. The reference signals can
be defined using a signal editor or they
can be obtained as a result of a simula-
tion. MTest provides a means to auto-
matically test automotive software within
the whole development process. It is
based on AutomationDesk’s technology
for test project management.
48
It depends on the process step when the evaluation design is developed (cf. Section 4.4 and Section 5.2 – 5.6).](https://image.slidesharecdn.com/zanderdiss-130217192436-phpapp02/85/Zander-diss-251-320.jpg)
![228 APPENDIX A
PROVE- - does not apply - MiL, SiL, - does not apply PROVEtech:Test Automation (PROV-
www.mbtech-group.com/en
tech - manual HiL - manual Etech:TA) realizes the test approach,
generation - non-reactive specification which is not actually based on any model.
- offline - offline However, it is a relevant tool in the con-
generation evaluation text of automotive testing.
It is an operational software, developed
by the MBtech Group, for the control and
automation of test systems, initially on
HiL level. It constitutes a basis for exe-
cuting automated tests on a real-time
platform by means of its integrated devel-
opment environment and program librar-
ies for test execution on real-time com-
puters.
Reactis - structural model - MiL, SiL, - test evaluation Reactis Tester automatically generates
www.reactive-systems.com/tester.msp
Tester coverage HiL specifications test suites from SL/SF models. The idea
- automatic - non-reactive - automatic behind this approach is to use guided
generation specification simulation algorithms and heuristics so as
- model - offline to automatically obtain inputs covering
checking (Author evaluation the targets (i.e., model elements to be
decided to classify executed at least once). Two of the targets
this approach as a involve SL, three are specific to SF and
sophisticated variant the remaining include criteria within both
of model checking
technology.)
the SL and the SF portions of a model.
- offline Each test case in a test suite consists of a
generation sequence of inputs fed into the model as
well as the responses to those inputs
generated by the model. The obtained
tests may be used for validating the model
itself or for comparison of source-code
implementation with model behavior
results.
Reactis - structural model - MiL, SiL - test evaluation Reactis Validator provides a test frame-
www.reactive-systems.com/validator.msp
Validator coverage - non-reactive specifications work for validation of the system design.
- requirements - manual It enables to express the so-called asser-
coverage specification tions and user-defined targets graphically.
- automatic - online The former check an SUT for potential
generation evaluation errors. The latter monitor system behavior
- model in order to detect the presence of certain
checking desirable test cases [SD07]. If a failure
- offline occurs, a test execution sequence is deliv-
generation ered and it leads to the place where it
happens. Then, this test is executed in
Reactis Simulator.](https://image.slidesharecdn.com/zanderdiss-130217192436-phpapp02/85/Zander-diss-252-320.jpg)
![APPENDIX A 229
Safety - does not apply - MiL, SiL - requirements Safety-Checker Blockset (SCB) enables
www.tni-software.com/en/produits/safetytestbuilder/index.php
Checker - automatic - non-reactive coverage to formally verify properties of the SL/SF
Blockset generation - manual models, with the emphasis on SF. A
- model checking specification property is a combination of model's
- offline - online variables connected to a proof operator.
generation evaluation The verification mechanism is based on
the model checking.
Model checking analyzes a system re-
garding arbitrary input scenarios and can
thus be viewed as a test performed against
a formally specified requirement. SCB
blocks typically express an unwanted
situation (e.g., never together). Counter
examples are provided in case of a failure.
Safety - structural model - MiL, SiL - does not apply Safety Test Builder (STB) is a solution
www.tni-software.com/en/produits/safetytestbuilder
Test coverage - non-reactive - automatic dedicated to automating the production of
Builder - requirements specification test cases for embedded software, pro-
coverage - offline vided the software has been modeled
- automatic evaluation using SL/SF.
generation It generates test sequences covering a set
- offline of SL and SF test objectives based on the
generation structural analysis. The approach creates
lists of objectives automatically by model
exploration, supporting basic coverage
metrics. The test harness is created auto-
matically. STB is dedicated to software
testing at the function and subsystem
level.
SCADE - automatic - MiL, SiL - requirements SCADE Design Verifier (DV) is a model-
www.esterel-technologies.com/products/scade-suite/design-verifier
Design generation - non-reactive coverage based proof engine allowing formal veri-
Verifier - model checking - manual fication of safety-critical properties using
- offline specification model checking techniques. It enables
generation - online proving of a design safety with respect to
evaluation its requirement. In case of property verifi-
cation failure, a counter example is pro-
vided. Safety properties are expressed
using the SCADE language. A node im-
plementing a property is called an ob-
server. It receives the input variables
involved in the property and produces an
output that should be always true. DV is
able to verify properties mixing boolean
control logic, data-value transformations
and temporal behavior. The core algo-
rithms are based on Stalmarck’s SAT-
solving algorithm for dealing with boo-
lean formulas, surrounded by induction
schemes to deal with temporal behavior
and state space search. These algorithms
are coupled with constraint solving and
decision procedures that handle the data
path [DCB04].](https://image.slidesharecdn.com/zanderdiss-130217192436-phpapp02/85/Zander-diss-253-320.jpg)
![230 APPENDIX A
Simulink® - does not apply - MiL - requirements Simulink Validation and Verification (SL
www.mathworks.com/products/simverification/
Valida- - manual - non-reactive coverage VV) is a tool for validating SL models.
tion and generation - manual Tests are produced manually as a set of
specification signals and can then be subjected to
Verifica-
- online automated coverage analysis on the level
tion™ evaluation of the model. The assertion blocks are set
up to notify the user if a failure arises. A
selection list of available assertions can
be displayed in the SL Signal Builder, in
order to activate or deactivate certain
assertions depending on the input signals
to be generated. SL VV enables traceabil-
ity from requirements to SL/SF models
and model coverage analysis. For SF
charts, the classic state coverage and
transition coverage are provided. SL
blocks rely on dedicated criteria such as
lookup table coverage, which records the
frequency of table lookups in a block.
Other structural coverage analysis is
provided, i.e., for data coverage boundary
values, signal range analysis and for
complex boolean decisions (decision
coverage, condition coverage, modified
condition/decision coverage). Test cases
are run on the model itself. To run tests
on the SUT, the tests must be recorded
first and then adapted to the SUT inter-
face.
Simulink® - structural model - MiL, SiL - requirements Simulink Design Verifier generates tests
www.mathworks.com/products/sldesignverifier
Design coverage - non-reactive coverage for SL models that satisfy model coverage
Verifier™ - automatic - test evaluation and user-defined objectives. After com-
generation specifications pleting the generation it produces a test
- theorem proving - manual harness model that contains test cases.
- offline specification The tool also proves model properties and
generation - online generates examples of their violations. It
evaluation uses mathematical procedures to search
through the possible execution paths of
the model so as to find test cases and
counter examples. The main blocks for
specifying the objectives are proof as-
sumption, proof objective, test condition,
test objective and verification subsystem.
A similar approach is realized in a re-
search prototype, called automatic test-
case generation (ATG) [GMS07].](https://image.slidesharecdn.com/zanderdiss-130217192436-phpapp02/85/Zander-diss-254-320.jpg)
![APPENDIX A 231
System - data coverage - MiL, SiL, - reference SystemTest is a tool for testing ML
www.mathworks.com/products/systemtest
Test™ - automatic and HiL signals-based scripts and SL models. Test cases can be
manual - non-reactive - manual specified at a low abstraction level and
generation specification are executed manually. The test vectors
- offline - offline may be defined manually using ML ex-
generation evaluation pressions or generated randomly applying
probability distributions for Monte Carlo
simulation [DFG01]. Besides a small set
of automatic evaluation means based on
the reference signals, the actual test as-
sessment is performed manually using
graphical signal representations and ta-
bles.
SystemTest supports test case reusability.
Parameter sweep for system optimization
is also possible.
Testing of - data coverage - does not - test evaluation The approach enables both generation of
tumb1.biblio.tu-muenchen.de/publ/ diss/in/2003/pretschner.pdf
Auto- - test case apply specifications functional, but also structural (based on
Focus specifications - non-reactive - automatic MC/DC criterion) test specification
- automatic specifications [Pre03, Pre03b], followed by concrete test
Models
generation - does not apply cases derivation. It is based on AutoFocus
[Pre03b] - symbolic system models. The generation of test is
execution supported by the symbolic execution on
- offline the grounds of CLP (initially transformed
generation from the AutoFocus models). [Pre04]
concludes that test case generation for
both functional and structural test case
specifications boils down to finding states
in the model’s state space. The aim of a
symbolic execution of a model is then to
find a trace – a test case – that leads to the
specified state. Specification of test case
in the form of interaction patterns means
providing the concrete signals. For uni-
versal properties such as invariants, the
deduction of test case specifications is
possible by syntactically transforming
temporal logic formulas [Pre03b].
TPT - data coverage - MiL, SiL, - reference The objectives of Time Partitioning Test-
www.piketec.com/products/tpt.php
- requirements PiL, HiL signal-feature – ing (TPT) are to support a test modeling
coverage - reactive based technique that allows the systematic se-
- test case - manual lection of test cases, to facilitate a precise,
specification specification formal, portable, but simple representa-
- manual - online and tion of test cases for model-based auto-
generation offline motive developments, and thereby, to
- offline and evaluation provide an infrastructure for automated
online generation test execution and automated test assess-
ments even for real-time environments
[LK08].
TPT supports the selection of test data on
the semantic basis of so-called testlets and
several syntactic techniques. Testlets
facilitate an exact description of test data
and guarantee the automation of test
execution and test evaluation.
Test evaluation is based on the concept of
the property of a signal. A library contain-
ing several evaluation functions is avail-
able. External tools can be easily inte-
grated into the evaluation process too.](https://image.slidesharecdn.com/zanderdiss-130217192436-phpapp02/85/Zander-diss-255-320.jpg)
![232 APPENDIX A
T-VEC - structural model - MiL, SiL - test case Test VECtor (T-VEC) Tester automates
www.t-vec.com/solutions/simulink.php
Tester for coverage - non-reactive specifications some steps of the test development proc-
Simulink - data coverage [ROT98] ess by analyzing the structure of the SL
- requirements - automatic model. Test cases for validating the
specification specification model and testing implementations of the
- automatic - does not apply model are determined. The test selection
generation process produces the set of test vectors
- offline effective in revealing both decision and
generation computational errors in logical, integer
and floating-point domains [BBN04]. T-
VEC determines test inputs, expected
outputs and a mapping of each test to the
associated requirement, directly from SL
specifications.
T-VEC analyzes also the transformed
specification to determine whether all
specification elements have a correspond-
ing test vector.](https://image.slidesharecdn.com/zanderdiss-130217192436-phpapp02/85/Zander-diss-256-320.jpg)
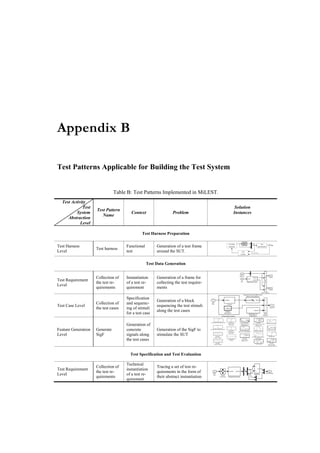
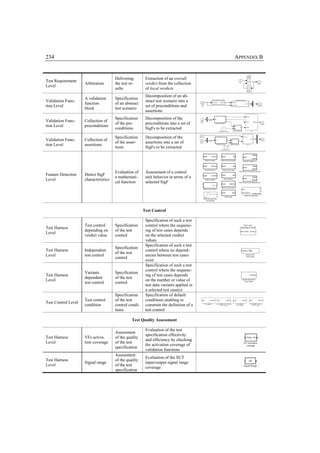

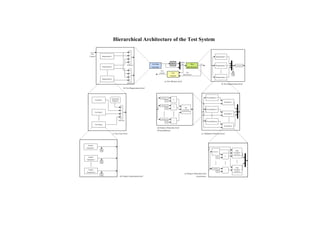
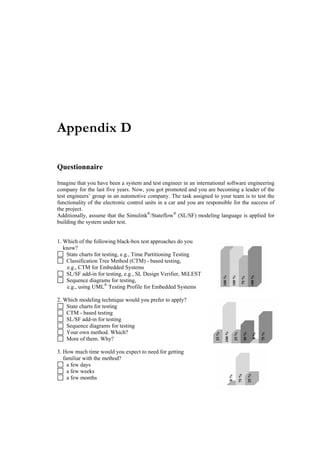
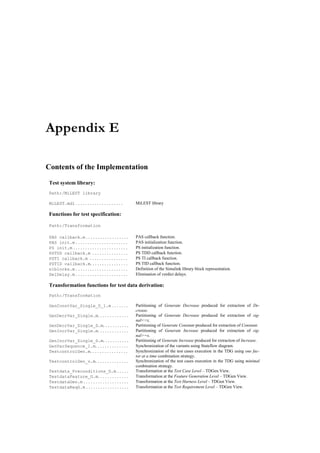
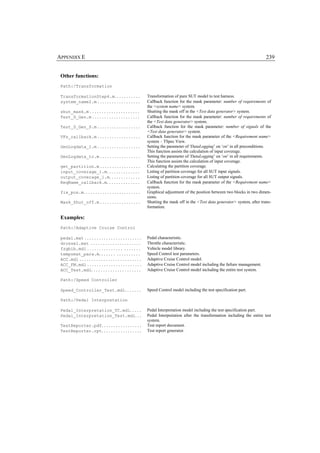
![240 APPENDIX E
Application of I/O Parameters for the Transformations Functions:
.m File ID I/O Parameters Example
fix_pos I: blocka, blockb, x, y fix_pos('Pedal_Interpretation_Test/Bus Selector',
'Pedal_Interpretation_Test/Memory',120,80);
GenConstVar_Single_D_1 I: is_increase, tar, Input- variants_nr = Gen-
Name, ODT, duration_tick ConstVar_Single_D_1(['Pedal_Interpretation_Test/ Gen-
O: variants_nr (i.e., number erate constant ' num2str(1)], 'Pedal_Interpretation_Test',
of variants) 'phi_Acc', 'OutDataTypeMode', '200');
GenDecrVar_Single_D I:is_increase, tar, InputName, variants_nr = GenDecrVar_Single_D
duration_tick ('Pedal_Interpretation_Test/Generate constant ',
O: variants_nr 'Pedal_Interpretation_Test' , 'phi_Acc', '200');
GenDecrVar_Single I: is_decrease, tar, Input- variants_nr = GenDecrVar_Single
Name, ref, duration_tick ('Pedal_Interpretation_Test/Generate constant ',
O: variants_nr 'Pedal_Interpretation_Test' , 'phi_Acc', '5', '200');
GenIncrVar_Single I:is_increase, tar, InputName, variants_nr = GenIncrVar_Single
ref, duration_tick ('Pedal_Interpretation_Test/Generate constant ',
O: variants_nr 'Pedal_Interpretation_Test' , 'phi_Acc', '5', '200');
GenIncrVar_Single_D I:is_increase, tar, InputName, variants_nr = GenIncrVar_Single_D
duration_tick ('Pedal_Interpretation_Test/Generate constant ',
O: variants_nr 'Pedal_Interpretation_Test' , 'phi_Acc', '200');
GenLogdata I: targetModel GenLogdata('Pedal_Interpretation_Test')
GenLogdata_tc I: targetModel GenLogdata_tc('Pedal_Interpretation_Test')
GenVarSequence_1 I: path, ReqNr GenVarSequence_1 ('Pedal_Interpretation_Test/variants
sequence', 4)
get_partition I: lower, upper, partition- [p partition] = get_partition(-10, 70, [0], [-10 70]);
Point, actualSignalRange
O: par (i.e., actual number of
partitions), partition (i.e.,
expected number of parti-
tions)
input_coverage_1 I: targetModel input_coverage_1('Pedal_Interpretation_Test')
output_coverage_1 I: targetModel output_coverage_1('Pedal_Interpretation_Test')
ReqName_callback I: blockName ReqName_callback(gcb)
TestcontrolGen_v I: targetModel, time TestcontrolGen_v('Pedal_Interpretation_Test', 200);
TestcontrolGen I: targetModel TestcontrolGen_v('Pedal_Interpretation_Test', 400);
Testdata_Preconditions_G I: sys, RequirementName, [t1 p_nr vr_max_1] = Test-
tar, duration_tick data_Preconditions_G('Pedal_Interpretation_Test/ Valida-
O: TCD (i.e., test case dura- tion Functions', 'SRPI01.1',
tion), p_nr (i.e., number of 'Pedal_Interpretation_Test_TC', '200');
preconditions), vr_max (i.e.,
maximum number of variants
in the requirement)
TestdataFeature_G I: VFsName, TestDataName, vr_max_1 = TestdataFea-
tar, duration_tick ture_G('Pedal_Interpretation_Test/Validation Func-
O: vr_max tions/SRPI01.1/v=const',
'Pedal_Interpretation_Test_TC/TestData1/SRPI01.1/v=co
nst','Pedal_Interpretation_Test_TC', '200');
TestdataGen I: source, SUT, duration_tick [time vr_max] = Test-
O: time, vr_max dataGen('Pedal_Interpretation_Test', 'PedalInterpreta-
tion','200')
TestdataReqG I: sys, block, tar, [time vr_max_1] = TestdataReqG('
duration_tick Pedal_Interpretation_Test/Validation Functions','Test
O: time_exe, vr_max Info', 'Pedal_Interpretation_Test_TC', '200');](https://image.slidesharecdn.com/zanderdiss-130217192436-phpapp02/85/Zander-diss-264-320.jpg)