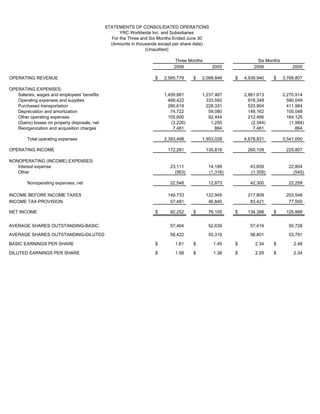
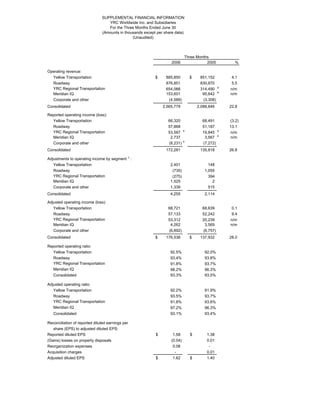
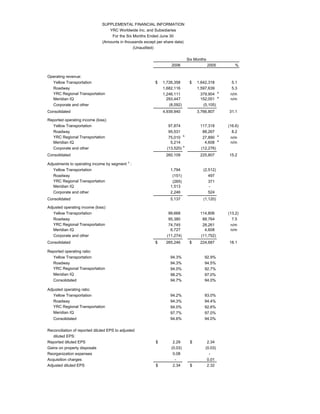
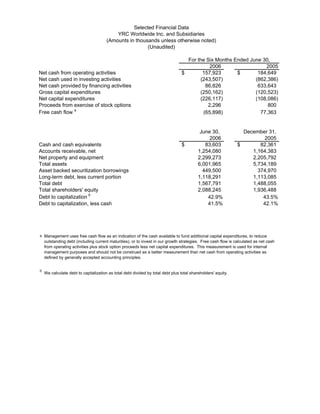
YRC Worldwide reported its highest ever quarterly earnings per share of $1.62 for Q2 2006, up 16% from $1.40 in Q2 2005. Revenue increased 23% to a record $2.57 billion due to strong execution and cost initiatives. Adjusted operating income rose 28% to $177 million from $138 million. The company expects full year 2006 EPS between $5.65-$5.85 and third quarter EPS between $1.70-$1.80.
The document summarizes Advanced Emissions Solutions' Q3 2016 earnings call. Key points include:
- Revenues increased year-over-year due to completion of emissions control equipment contracts and growth in chemical sales. Operating expenses and general/administrative costs declined.
- Earnings from the Refined Coal segment increased significantly due to higher production volumes and equity income from Tinuum Group. Royalties from Tinuum declined due to suspended operations at some facilities.
- Net income increased primarily from equity income recognition from the Refined Coal business and expense reductions from restructuring. Cash balances declined from debt payments, but distributions from Tinuum offset this.
- The company remains committed to strategic goals
Management Investor Presentation - Year End 2015RioCan
This document provides an investor presentation for RioCan Real Estate Investment Trust for the year ending 2015. It discusses RioCan's portfolio metrics including properties, market capitalization, and tenant profile. It also summarizes recent corporate developments including the planned sale of RioCan's US portfolio for $1.9 billion US to focus on the Canadian market. Finally, it highlights RioCan's financial results for 2015, including increased funds from operations and improved payout ratios compared to 2014.
YRC Worldwide reported record first quarter revenue of over $2.37 billion, a 41% increase over the previous year. While revenue grew in all segments, the quarter's results did not meet plans. Steps have been taken to improve financial performance for the remainder of the year. Adjusted earnings per share were $0.72. An outlook for the full year and second quarter was provided.
The document summarizes EnLink's operations report for August 2016. Key points include:
- EnLink revised 2016 guidance, increased adjusted EBITDA to $750-800 million.
- Q2 2016 results showed adjusted EBITDA of $187.4 million and cash available for distribution of $49.8 million.
- EnLink continues focus on core strategies of maximizing cash flows, executing growth projects, and providing best-in-basin service.
- WCI Communities reported a 63.9% increase in homebuilding revenues and a 84.1% increase in home deliveries for the first quarter of 2016 compared to the same period in 2015.
- The average selling price of new home orders increased 11.2% to $496,000. Real estate services revenues declined 4.8% due to a 9.8% decrease in brokerage transactions.
- Adjusted EBITDA grew 52% to $15.2 million for the quarter, with an improved adjusted EBITDA margin of 11.0%. Net income attributable to shareholders rose 17.5% to $6.7 million.
- The company has a strong balance sheet with $
Barnes Group Inc. Investor Overview - November 2016Barnes_Group
This document provides an investor overview of Barnes Group Inc. It begins with forward-looking statement disclosures and references to non-GAAP measures. The main sections summarize Barnes Group's history and transformation through acquisitions, its two business segments of industrial and aerospace, key growth strategies, capital allocation approach, and financial performance trends showing increasing sales and margins over time.
This document provides an overview of Antero Midstream Partners LP and highlights key information about the company's forward-looking statements, recent changes since the prior presentation, benefits of Antero Resources' recent acreage acquisition for Antero Midstream, Antero Resources' continuous operating improvements, advanced completion designs driving increased water volumes, Marcellus well economics assumptions and upside potential, Antero Midstream's exercise of an option to acquire a stake in the Stonewall gathering pipeline, and reasons to own Antero Midstream including strong distribution growth and coverage, sponsor strength, investment opportunities, and financial flexibility.
- YRC Worldwide reported record revenue and operating income for 2005, with adjusted EPS of $5.28, up 33% from 2004.
- For Q4 2005, revenue was $2.48 billion, up 40% from Q4 2004, with adjusted operating income of $152 million, up 42% from Q4 2004.
- Segment highlights included record revenue and operating income for Yellow Transportation and improved operating ratios for Roadway Express and YRC Regional Transportation.
- For 2006, the company expects EPS between $6.15-$6.30 and consolidated revenue of about $10 billion.
WCI Communities reported strong full year 2015 results, with revenues increasing 38.5% to $563.6 million. Homebuilding revenues grew 49.6% to $438 million due to a 45.7% increase in home deliveries to 938 homes. Adjusted EBITDA increased 50.1% to $74 million. The company has a conservative balance sheet with $135 million in cash and an undrawn $115 million revolving credit facility. Management is positioned to continue executing its growth strategy through land acquisition opportunities in Florida.
1) UGI reported third quarter 2016 adjusted earnings per share of $0.23, up from $0.07 in the prior year period. Weather was colder than the prior year across UGI's service territories.
2) AmeriGas achieved strong results due to solid margin management, expense control, and colder weather. Adjusted EBITDA increased 30% year-over-year.
3) UGI International benefited from the acquisition of Finagaz and strong unit margin management, partially offset by integration expenses. Weather was significantly colder than the prior year.
Investor presentation jp morgan all stars conferenceIronMInc
The document discusses Iron Mountain's durable business model and strategic plan performance. It summarizes that Iron Mountain has a global storage and information management business that generates most of its revenue from rental streams, and has demonstrated consistent internal storage revenue growth. It also notes that Iron Mountain's strategic plan is delivering expected results, with improved financial performance in worldwide revenue and adjusted OIBDA since 2013.
This document provides an overview of RioCan's third quarter 2016 results and financial position:
- Funds from operations increased year-over-year driven by growth in net operating income. Occupancy rates also improved across the portfolio.
- RioCan acquired over $1.2 billion in properties in Canada since last year and completed a debenture offering at a historically low interest rate.
- Financial metrics like interest coverage and leverage remain conservative and RioCan maintains a staggered debt maturity schedule with low floating rate exposure.
Bruker Corporation reported financial results for Q3 2015. Revenues declined 6% year-over-year to $396.1 million due to currency headwinds, but grew 8% organically. Non-GAAP operating margins expanded significantly to 13.3% compared to 8.6% in Q3 2014. Non-GAAP earnings per share grew 36% despite a higher tax rate. The CALID and BioSpin groups drove organic revenue growth, while currency impacts and divestitures reduced reported revenues. Bruker is on track to meet its full-year guidance targets through margin expansion and earnings growth.
- CorEnergy Infrastructure Trust held an investor conference call to discuss its fiscal year 2016 results
- Key developments included declaring a $0.75 dividend for Q4 2016, bringing the annual dividend to $3.00 per share, and providing continued dividend guidance of $3.00 per share
- The presentation reviewed CorEnergy's asset portfolio and tenants, capital structure, recent financing activities, and outlook for 2017 including a focus on acquisitions of $50-250 million and continued stable dividend payments.
UGI Utilities is Pennsylvania's second largest natural gas distribution company serving over 626,000 customers. It has a constructive regulatory environment and opportunities for growth supported by its proximity to the Marcellus Shale reserves. UGI Utilities achieved record capital investment in 2016 of over $260 million and added approximately 16,000 new customers. It expects to continue strong capital investment to increase system reliability and support growth, growing its rate base and net income 5-7% annually.
The document provides an overview of AES Corporation's financial results for the second quarter of 2016. Some key points:
- Adjusted EPS decreased to $0.17 per share compared to $0.26 in Q2 2015, driven by lower margins in Brazil and MCAC SBUs and the impact of foreign currency devaluations.
- Proportional free cash flow increased to $417 million from $62 million in Q2 2015, reflecting the collection of outstanding receivables in Bulgaria.
- Results were generally in line with expectations and the company is on track to achieve its full-year guidance targets.
- UGI reported adjusted EPS of $1.24 for Q2 2016, down from $1.26 in Q2 2015 due to significantly warmer weather. Weather was 24-25% warmer than the prior year across UGI's businesses.
- Despite the warm weather, results demonstrated benefits of a diversified portfolio through cost controls and margin management. Guidance was revised to $1.95-2.05 per share.
- Key accomplishments included a rate case filing at UGI Utilities and strong integration of the Finagaz acquisition. Strategic investments continued in midstream infrastructure and the utilities business.
EnLink Midstream reported strong third quarter 2016 results, with adjusted EBITDA of approximately $201 million. Operations in the core growth areas of the STACK, SCOOP, and Cana Woodford in Oklahoma performed well, with volumes on recently acquired assets up 85% compared to the first quarter. Louisiana gas volumes were near record levels at 1.75 billion cubic feet per day. EnLink remains focused on executing its $6 billion growth program through expanding existing assets and strategic acquisitions.
Brink's is hosting investor meetings in June 2017. The document provides a safe harbor statement and discusses non-GAAP results. It then summarizes Brink's strategy to accelerate profitable growth through initiatives like growing high-value services, introducing differentiated services by leveraging technology, and achieving operational excellence. Financial targets for 2019 include 5% annual revenue growth to $3.275 billion, operating profit margin of around 10% ($330 million), and adjusted EBITDA margin of around 15% ($475 million). Segment contributions to the 2019 targets are also outlined.
- Masco reported financial results for the second quarter of 2016, with revenue increasing 4% year-over-year to $2.001 billion. Operating profit rose $62 million to $342 million and operating margin expanded 260 basis points to 17.1%.
- All business segments saw sales growth except cabinetry, with plumbing products leading with 9% revenue growth. Increased operating leverage and cost productivity contributed to margin expansion across segments.
- Masco strengthened its balance sheet in the quarter, retiring $400 million of debt and repurchasing 2.8 million shares. The board also announced an intention to increase the annual dividend.
The document provides an overview of AES Corporation's business strategy and financial expectations. AES is reshaping its business mix to focus on projects with long-term US dollar contracts, capitalizing on growth in key markets. It expects double-digit earnings and free cash flow growth through 2020 as it brings new projects online and strengthens its balance sheet by paying down debt. AES provided guidance for 2016 of $1-1.35 billion in proportional free cash flow and $0.95-1.05 in adjusted EPS, and expects average annual growth rates of over 10% and 12-16%, respectively, from 2017-2018.
Brink's 3 q 2017 earnings slides final 10242017investorsbrinks
The document provides an overview of Brink's third quarter 2017 results and strategic plan. Some key points:
- Revenue increased 13% to $829 million in Q3 2017 driven by 6% organic growth and acquisitions.
- Operating profit increased 21% to $76 million and adjusted EBITDA increased 22% to $112 million in Q3 2017.
- The company expects full year 2017 revenue of $3.18 billion, operating profit of $280-290 million, adjusted EBITDA of $425-435 million, and EPS of $3.00-3.10.
- Franklin Resources reported third quarter results, with Chairman and CEO Greg Johnson and CFO Ken Lewis presenting.
- Relative investment performance improved across major categories over the past year. Equity and hybrid product performance also improved over 1, 3, 5, and 10 year periods.
- Redemptions continued to slow and long-term net outflows broadly improved over the last four quarters.
Tim G. Taylor, President of Bank of America Merrill Lynch, gave a presentation at the Refining Conference on March 2, 2017. The presentation focused on Phillips 66's strategy of operating excellence, growth, returns, and distributions. It highlighted achievements in safety and environmental performance improvements. It also discussed opportunities for expanding midstream infrastructure and growing various business segments such as chemicals and marketing. The presentation emphasized Phillips 66's commitment to capital allocation priorities of maintaining financial strength, funding sustaining and growth investments, and delivering shareholder returns through dividends and share repurchases.
The document provides an overview of OUTFRONT Media's assets and business model as a REIT. It details the company's primary asset types which include billboards, digital displays, posters, and transit assets. It also summarizes the company's top market locations and timeline of becoming a publicly-traded REIT after its split from CBS Corporation in 2014.
The document provides an earnings conference call summary for WCI Communities for Q2 2016:
- Homebuilding revenues increased 14.2% to $132 million and deliveries increased 26.3% to 307 homes. Gross margin was 24.8% and adjusted gross margin was 27.5%.
- Real estate services revenues increased 4.5% to $30.4 million. Brokerage transactions decreased slightly but average selling price increased.
- The company has a land portfolio of over 14,000 owned or controlled home sites positioned for continued growth in Florida. The balance sheet remains conservative with $88 million of cash and available liquidity to execute the growth strategy.
This document provides an overview of Antero Midstream Partners LP and contains forward-looking statements regarding future plans and expectations. It discusses key assumptions, risks, and uncertainties that could cause actual results to differ from projections. Specifically, the document notes that Antero Midstream's ability to make future distributions is substantially dependent on Antero Resources' development plan, which depends on annual budget approval by Antero Resources' board of directors.
This document is an SEC filing by YRC Worldwide Inc. announcing revisions to its previously reported financial results for the three and twelve months ended December 31, 2005. Specifically, YRC revised its diluted EPS downward from $5.12 to $5.07 for the full year, and from $1.34 to $1.30 for the quarter. YRC also revised its adjusted diluted EPS downward slightly. The revisions were due to an accounting error related to foreign currency treatment at a Canadian subsidiary. YRC stated the error was corrected and would not impact future results.
- Yellow Roadway Corporation reported strong financial results for the third quarter of 2004, with adjusted earnings per share increasing 84% compared to the third quarter of 2003.
- All of the company's operating segments achieved record revenue and operating income levels for the quarter. Yellow Transportation, Roadway Express, and New Penn Motor Express all saw revenue and profitability increases.
- For the first nine months of 2004, the company's adjusted earnings per share increased 75% from the same period in 2003, driven by revenue growth across all operating segments.
This document provides an overview of PHI and its strategy for positioning itself for success in a dynamic industry. PHI's strategy is to remain a diversified regional energy delivery and competitive services company focused on value creation and operational excellence. For its power delivery utility operations, PHI's goals are to operate with excellence, achieve constructive regulatory outcomes, invest in infrastructure, and deliver at least 4% annual average earnings growth. PHI's service territory has a robust economy that is less susceptible to downturns and includes diverse government and private sectors.
- DTE Energy's consolidated statement of financial position as of September 30, 2006 showed total assets of $22.3 billion and total liabilities and shareholders' equity of $22.3 billion.
- Key assets included property, plant and equipment of $10.5 billion, goodwill of $2.1 billion, and regulatory and intangible assets of $3.5 billion. Total debt was $6.7 billion.
- Detroit Edison reported operating revenues of $1.5 billion for the third quarter of 2006, with operating earnings of $145 million. Michigan Consolidated Gas reported an operating loss of $7 million on revenues of $167 million.
This annual report summarizes Dollar General Corporation's financial performance for the fiscal year ending January 31, 2003. Some key details include:
- Net sales increased 14.6% to $6.1 billion compared to the previous year. Same store sales also rose 5.7%.
- Net income grew 27.7% to $264.9 million, or $0.79 per diluted share. Excluding restatement items, net income increased 11.2% to $250.9 million.
- The company opened 622 new stores, bringing the total number of stores to 6,113 across 27 states. Inventory management and store standards were areas of focus for improvement.
YRC Worldwide reported financial results for the fourth quarter and full year of 2007. For the fourth quarter, EPS was $0.01 excluding impairment, reorganization, and technology charges, but including these charges was a loss of $12.99 per share compared to $0.80 EPS in 2006. For the full year, EPS was $1.88 excluding charges, but including charges was a loss of $11.17 compared to $4.74 EPS in 2006. The economic environment was challenging in 2007 and particularly difficult in the fourth quarter. YRC Worldwide expects continued economic difficulties in the near future.
YRC Worldwide reported second quarter 2008 diluted earnings per share of $0.62, including various one-time gains and losses. Revenue decreased 3.5% from the second quarter of 2007. YRC National Transportation saw a 19.6% decrease in operating income due to lower tonnage, while YRC Regional Transportation operating income declined 86.3% from a year ago. The company expects third quarter 2008 earnings between $1.05-$1.15 per share, including curtailment gains of $0.70 per share and increased union costs of $0.15 per share.
The document outlines Starbucks' policy for communicating complaints and concerns to the company and board of directors in a confidential manner. It establishes procedures to ensure employees and others can report issues anonymously and have their reports handled appropriately. The audit committee is responsible for overseeing all reports, especially those regarding accounting, auditing or financial matters. Retaliation against anyone who makes a report in good faith is strictly prohibited.
- Yellow Transportation, Roadway Express, and New Penn Motor Express provided operating statistics for their less-than-truckload (LTL) and truckload (TL) freight businesses, including revenue, tonnage shipped, shipments, and revenue per hundredweight and shipment.
- For the third quarter of 2004, all three companies saw increases in revenue, tonnage, and shipments for both LTL and TL freight compared to the third quarter of 2003. Revenue per hundredweight and per shipment also increased across all segments.
- Similarly, year-to-date statistics for September 2004 showed increases over the same period in 2003 for both LTL and TL operations across the three companies.
This document is the consolidated statement of operations and financial position for DTE Energy Company and its subsidiaries for the fourth quarter and full year of 2003. Some key highlights include:
- For the full year 2003, net income was $521 million compared to $586 million in 2002, a decrease of 18%. Earnings per diluted share were $3.09 compared to $3.55 in 2002, a decrease of 13%.
- For the fourth quarter of 2003, net income was $229 million compared to $203 million in 2002, an increase of 13%. Earnings per diluted share were $1.36 compared to $1.21 in 2002, an increase of 13%.
- Total operating revenues
DTE Energy announced its third quarter 2007 earnings. Operating earnings were $181 million compared to $255 million in third quarter 2006, primarily due to one-time gains in 2006 and startup costs for new systems in 2007. For the first nine months, operating earnings were $317 million compared to $377 million in 2006, mainly due to onetime costs at Detroit Edison including new system startup costs and a temporary rate reduction. The company expects to meet its annual operating earnings guidance and sees strong cash flow providing flexibility for growth.
The CEO reflects on the incredible growth of Liberty Tax Service from humble beginnings eight years ago with four founders and a business plan written on a napkin to becoming the fastest growing retail tax business. Revenues increased from $10.7 million in 2001 to $51 million in 2005. The company expanded across the US and Canada, adding 326 new offices last year. President Bush referenced the company's donation to tsunami relief in a nationally televised speech, highlighting its quick response to help victims.
The document is a notice and proxy statement for the annual meeting of stockholders of Norfolk Southern Corporation to be held on May 14, 2009. It provides information on voting procedures, the proposals to be voted on which include the election of directors and ratification of auditors, and summaries of director and executive compensation. Stockholders are requested to vote by proxy prior to the meeting.
DTE Energy reported a loss for the second quarter of 2006 compared to a profit in the same period in 2005. Operating earnings, which exclude non-recurring items, were down slightly from the prior year. The company maintained its full-year 2006 earnings guidance despite pressure from high oil prices impacting its synfuel operations. Capital investment projects across its utility and non-utility businesses remained on track.
This document provides a summary of DTE Energy's business update presentation at the AGA Financial Forum on May 5, 2008. It discusses DTE Energy's focused integrated energy strategy of executing strong regulated utility growth and a value-focused non-utility plan. Specifically, it outlines DTE Energy's projected utility earnings growth rates, regulatory environment, and growth opportunities. It also provides an overview of DTE Energy's utilities and non-utility businesses and the proportion of projected 2008 earnings they represent.
DTE Energy Company reported financial results for the first quarter of 2000. Operating revenues increased 15.4% to $1.182 billion due to higher fuel and purchased power expenses. Net income rose 1.7% to $117 million. Earnings per share increased 2.6% to $0.81. Excluding merger costs, EPS rose 6.1% to $0.84. Detroit Edison, DTE Energy's regulated utility, saw revenues increase 4.1% but net income fell 7.2% due to higher fuel expenses. Non-regulated subsidiaries contributed significantly higher earnings from new projects and trading gains.
Pepco Holdings, Inc. held an analyst conference on October 5-6, 2004 to discuss the company's performance. The presentation included an overview of PHI's businesses, strategy, and corporate governance practices. It noted PHI has $7.1 billion in revenues and focuses on its regulated electric and gas delivery business, which accounts for 72% of operating income. The Power Delivery segment was discussed, which includes the transmission and distribution of electricity to 1.8 million customers across several mid-Atlantic states.
This document is Dollar General Corporation's annual report (Form 10-K) filed with the SEC for the fiscal year ended February 2, 2007. It summarizes Dollar General's business operations, including that it operates discount retail stores offering consumable merchandise. It also announces that Dollar General entered into an agreement to be acquired by affiliates of Kohlberg Kravis Roberts & Co. in a deal valued at $22 per share. The report provides an overview of Dollar General's strategic initiatives, growth strategies, and risks to its business.
YRC Worldwide reported record first quarter revenue of over $2.37 billion, a 41% increase over the previous year. While revenue grew in all segments, the quarter's results did not meet expectations. Steps have been taken to improve financial performance for the remainder of the year. Outlook forecasts full year 2006 EPS between $5.65-$5.85 and revenue of approximately $10 billion.
- Yellow Roadway Corporation reported strong financial results for the second quarter of 2005, with adjusted earnings per share growing over 40% compared to the second quarter of 2004.
- All of Yellow Roadway's transportation segments, including Yellow Transportation, Roadway Express, and regional brands, achieved record quarterly revenue and operating income.
- The company expects continued growth, forecasting third quarter 2005 EPS between $1.60-$1.65 and full year 2005 EPS in the range of $5.35-$5.50.
- YRC Worldwide delivered strong financial results for 2006 with consolidated revenue and operating income at their highest levels in company history. However, results were below expectations due to weaker economic conditions impacting the fourth quarter and outlook for 2007.
- For 2006, revenue increased 13.5% to $9.9 billion and adjusted operating income rose 3.4% to $563 million. The fourth quarter saw revenue decline 3% to $2.4 billion and adjusted operating income fall 25.7% to $113 million.
- Looking ahead to 2007, the company expects EPS between $4.70-$4.90, revenue of $10.2 billion, interest expense of $90 million, and a tax rate
- YRC Worldwide delivered a solid fourth quarter and year despite weaker economic conditions. Consolidated 2006 revenue and operating income were the highest in the company's history.
- For the fourth quarter, revenue was $2.41 billion compared to $2.48 billion the previous year. Adjusted operating income was $113 million compared to $152 million in 2005.
- For the full year, revenue was $9.9 billion, up 13.5% from 2005. Adjusted operating income was $563 million compared to $544 million in 2005.
- YRC Worldwide reported record quarterly revenue of $2.57 billion, up 3.2% from the third quarter of 2005. Adjusted quarterly earnings per share were $1.72, up 12% from the prior year.
- For the first nine months of 2006, revenue was $7.51 billion, up 20% from the same period in 2005. Adjusted diluted EPS was $4.06 compared to $3.88 the previous year.
- The company expects full year 2006 EPS between $5.45-$5.55 and revenue of approximately $10 billion.
Yellow Roadway Corporation delivered a successful first year after merging Roadway Express and Yellow Transportation. In 2004, the company achieved its highest ever revenue and operating income. All business units set new records for revenue, operating income, and margins. For the fourth quarter of 2004, the company reported operating revenue of $1.77 billion, adjusted operating income of $107 million, and adjusted earnings per share of $1.24. For the full year, operating revenue was $6.77 billion and adjusted operating income was $357 million. The company expects continued strong performance in 2005 with earnings per share projected between $5.10-$5.30.
- WestRock reported positive Q2 FY18 results with revenue growth, higher earnings per share, and margin expansion. Key highlights included a 6.8% increase in North American corrugated box shipments, strong consumer packaging backlogs, and price increases across corrugated and consumer grades. The company achieved productivity savings and synergy targets but earnings were negatively impacted by $28 million from severe winter weather. WestRock is implementing strategic investments and pursuing the planned acquisition of KapStone.
This document summarizes WestRock's Q3 FY18 financial results. Key highlights include a 12% increase in net sales year-over-year and strong demand fundamentals across segments. Adjusted earnings per share were up 47% to $1.09. Adjusted segment EBITDA grew 27% with margins expanding 220 basis points. The corrugated packaging segment saw a 29% increase in adjusted segment EBITDA with North America margins improving 420 basis points. The acquisition of KapStone is expected to close by the end of 2018. Full year 2018 guidance projects 10% revenue growth, over 27% adjusted EBITDA growth, and 22.5% adjusted operating cash flow growth.
- Yellow Roadway Corporation reported second quarter 2004 EPS of $0.97, more than double the pro forma EPS of $0.46 from the second quarter of 2003. All business units delivered strong performance and synergy efforts were ahead of schedule.
- Consolidated revenue for the quarter was $1.67 billion, up 15% from the prior year, and operating income was $88.2 million, up 88% from the prior year.
- For the first six months of 2004, EPS was $1.35, revenue was $3.23 billion, and operating income was $129.6 million, all representing significant increases over the prior year.
Yellow Roadway Corporation reported second quarter 2004 earnings per share of $0.97, more than double the pro forma EPS of $0.46 from the second quarter of 2003. All business units delivered strong performance and synergy efforts were ahead of schedule. Revenue increased 15% to $1.67 billion compared to pro forma second quarter 2003 revenue. Operating income increased 88% to $88.2 million compared to pro forma second quarter 2003 operating income. For the full year, earnings per share guidance was increased to $3.70-$3.75 per share and consolidated revenue is expected to be $6.7 billion.
Morgan Stanley reported record first quarter results for 2006, with net revenues of $8.5 billion, up 24% from the previous year. Net income was $1.6 billion, a 17% increase, while diluted earnings per share were $1.54. All of Morgan Stanley's major business segments achieved record or near-record results, including Institutional Securities which saw a 36% rise in net revenues. The company directed additional resources to areas seeing major growth like emerging markets and leveraged finance. Morgan Stanley also continued international expansion and reorganized some business divisions to drive better performance.
Air Products reported record quarterly and annual financial results. For Q4, net income was $293 million, up 128% from the prior year. For fiscal 2007, sales reached $10 billion for the first time, up 15% from the prior year, net income was $1 billion, up 43%, and EPS was $4.64, up 46%. The company expects continued double-digit earnings growth in fiscal 2008 and targets expanding margins and reducing costs further.
- WestRock reported financial results for Q4 FY17 and provided guidance for Q1 FY18.
- For Q4 FY17, adjusted earnings per share were $0.87 and adjusted free cash flow was $271 million.
- Guidance for Q1 FY18 expects impacts such as $30-35 million negative impact from price/mix/pulp and volumes and $35 million negative impact from maintenance downtime and group insurance benefits, resulting in anticipated sequential declines in earnings per share.
YRC Worldwide reported a loss for 2008 due to the economic recession. While losses were larger than expected, cash flow was positive. The company aims to improve performance through integrating Yellow Transportation and Roadway networks, and reducing wages. An amendment to credit facilities is expected to finalize in February to improve the company's financial position.
Yellow Roadway Corporation reported their highest quarterly earnings per share in company history for Q3 2005. Key highlights included:
- Yellow Transportation achieved a record quarterly operating ratio of 91.8% and revenue per hundredweight increased 7.2% year-over-year.
- Roadway Express closed the quarter with good momentum, with a 93.2% operating ratio.
- YRC Regional Transportation saw double-digit volume growth and revenue per hundredweight increased 6.0% year-over-year.
- Meridian IQ results reflected strong organic growth and expansion, with operating income increasing over 500% from the prior year quarter.
Yellow Roadway expected Q4 2005 EPS between
The document provides financial results for AES Corporation for the fourth quarter and full year of 2008. Some key points:
- AES met its full year 2008 guidance for consolidated operating cash flow of $2.2 billion and free cash flow of $1.4 billion.
- For the fourth quarter, consolidated revenues decreased 3% to $3.5 billion due to unfavorable foreign currency translation, while consolidated gross margin decreased 17% to $674 million.
- For the full year, consolidated revenues increased 19% to $16.1 billion and consolidated gross margin increased 9% to $3.7 billion, driven by improved performance in Latin America and Europe.
- AES issued 2009 guidance forecasts
The document discusses Joseph Rigby's presentation on the strategic positioning of Southeast Utilities. It summarizes the company's strategic focus on power delivery, Conectiv Energy, and Pepco Energy Services. It also outlines the goals for the power delivery business, including sales growth, infrastructure investment, operational excellence, and constructive regulatory outcomes to deliver average annual earnings growth of at least 4%. Key infrastructure projects are highlighted.
The document summarizes a presentation given by Joseph M. Rigby, CFO of Pepco Holdings, Inc. (PHI) at an investor conference on March 28, 2006. The presentation outlines PHI's strategy to remain a regional diversified energy delivery and competitive services company focused on operational excellence. It discusses PHI's power delivery business, Conectiv Energy, and Pepco Energy Services. The presentation also provides financial performance summaries and projections showing PHI's ability to cover dividends and capital expenditures with cash from operations.
The document provides an overview and summary of PHI's strategy and performance across its various business segments. PHI aims to remain a regional diversified energy delivery and competitive services company focused on value creation and operational excellence. Key aspects include achieving constructive regulatory outcomes and 4% annual earnings growth for its power delivery utilities, optimizing assets and market opportunities for Conectiv Energy, and expanding Pepco Energy Services into additional markets. Financial performance has been positively impacted by infrastructure investments and sales growth, though earnings have been reduced in some jurisdictions due to higher standard offer service pricing.
This document provides an overview of PHI's 41st EEI Financial Conference held from November 5-8, 2006. It includes sections on PHI's financial performance for Q3 and year-to-date 2006, drivers of performance, sales and customer trends, regulated distribution summaries, upcoming regulatory activities including transmission formula rate filings and rate cases, and PHI's proposed MAPP transmission project. Key highlights are lower sales due to mild weather, lower transmission revenue, and plans to file rate cases in late 2006/early 2007.
This document provides an overview and summary of Power Holdings Inc.'s (PHI) various business segments. It discusses PHI's regulated electric and gas delivery business, which accounts for 67% of operating income. It also summarizes Conectiv Energy's competitive merchant generation and load service business, which accounts for 33% of operating income. Key highlights from rate cases and recent regulatory activities involving PHI's delivery businesses are also provided. The document contains forward-looking statements and non-GAAP financial measures.
The document provides an overview of Pepco Holdings Inc.'s (PHI) power delivery business and regulatory environment. It summarizes PHI's sales and customer growth projections, infrastructure investment strategy including the proposed Mid-Atlantic Power Pathway transmission project and Blueprint for the Future initiative. Recent distribution rate case outcomes for PHI's utilities are also summarized. The document is intended as a presentation for investors on PHI's positioned for success through its regulated electric and gas delivery business.
The document provides an overview of Pepco Holdings Inc.'s (PHI) various businesses including its regulated electric and gas delivery business, competitive energy generation business, and energy services business. It discusses PHI's infrastructure investment strategies, the status of major projects like the Mid-Atlantic Power Pathway, and the company's regulatory environment. Financial projections show expectations for continued investment and growth across PHI's businesses.
The document discusses Pepco Holdings' strategic focus on infrastructure investments and customer programs to position the company for continued success. It outlines plans to invest $1.2 billion in the Mid-Atlantic Power Pathway transmission project through 2014 and $646 million in advanced metering infrastructure and other programs through the company's Blueprint for the Future initiative between 2008-2014. Regulatory support is essential for cost recovery for these investments, which aim to enhance reliability, manage costs and protect the environment for customers.
This document provides an overview of Pepco Holdings' transmission and distribution business. It discusses plans to invest over $5 billion from 2007-2012 to upgrade aging infrastructure and improve reliability. A key project is the $1.05 billion Mid-Atlantic Power Pathway, a 230-mile 500kV transmission line from Northern Virginia to Southern New Jersey to be completed by 2013. The presentation outlines the project timeline, environmental stewardship efforts, and cost recovery approach through PJM and FERC. It also reviews the company's focus on replacing aging transmission equipment to further enhance reliability.
The document provides an overview of Pepco Holdings, Inc.'s (PHI) strategy to build shareholder value. PHI aims to increase investment in infrastructure through its Blueprint programs to modernize its electric grid. It also plans growth for its competitive energy businesses, Conectiv Energy and Pepco Energy Services. PHI expects its regulated Power Delivery business to remain the primary driver of earnings, contributing 60-70% of operating income over the planning period through infrastructure investments and favorable regulatory outcomes.
This document provides an overview of Pepco Holdings, Inc.'s power delivery business. It discusses planned infrastructure investments totaling $4.99 billion from 2008-2012 to improve reliability, support load growth, and implement new technology. A key project is the $1.05 billion Mid-Atlantic Power Pathway transmission line. The document also reviews regulatory highlights, including recent rate cases, and outlines operational and financial summaries for the company's distribution and transmission businesses.
- Pepco Holdings held its annual meeting and provided its annual report to shareholders.
- In 2002, Pepco Holdings earned $210.5 million in consolidated earnings, or $1.61 per share. Earnings were driven by strong performance from regulated utility businesses and some competitive energy businesses.
- The letter discusses the company's strategy, leadership, and financial and operational performance across its various business segments in 2002. It also encourages shareholders to vote and continue supporting the company.
- Pepco Holdings provided its first annual report after merging Pepco and Conectiv in August 2002.
- In 2002, PHI earned $210.5 million, or $1.61 per share, on $4.3 billion in revenue. Excluding merger costs, earnings were $1.74 per share.
- The letter discusses the company's regulated utility and competitive energy businesses, noting stable earnings from utilities and growth potential from competitive businesses. It encourages shareholders to vote and thanks them for their confidence and investment.
This document provides a summary of Pepco Holdings' 2004 annual report and proxy statement. Key points include:
1) Pepco Holdings reported improved financial performance in 2004 with consolidated earnings of $258.7 million, up from $113.5 million in 2003, driven by improved performance of competitive energy businesses.
2) The company made progress on reducing debt and preferred stock by $480 million in 2004 and achieved a total shareholder return of over 22% for 2003-2004.
3) The regulated power delivery business continues as the primary focus and driver of steady cash flow. Earnings from this segment improved to $233.4 million in 2004.
4) Competitive energy businesses also posted
The document provides details on Pepco Holdings' 2003 performance and future plans. It discusses challenges faced in 2003 including an energy trading loss, Mirant's bankruptcy, and Hurricane Isabel. However, actions taken in 2003 such as divesting non-core businesses and reducing risk are expected to set the stage for future earnings growth. The company remains focused on strengthening its core power delivery business and improving customer satisfaction.
This document provides a summary of Pepco Holdings' 2004 annual report and proxy statement. Key points include:
1) Pepco Holdings reported improved financial performance in 2004 with consolidated earnings of $258.7 million, up from $113.5 million in 2003, driven by improved performance of competitive energy businesses.
2) The company made progress on reducing debt and preferred stock by $480 million in 2004 as part of its balance sheet improvement goals.
3) The regulated power delivery business continues as the primary focus due to its stability and cash generation. Earnings from this segment grew to $233.4 million in 2004.
4) Competitive energy businesses also posted profits in 2004 despite challenging markets
The document is the 2005 annual report and proxy statement from PHI (Pepco Holdings Inc.). It discusses PHI's strategy of focusing on stable power delivery and growing energy businesses. In 2005, PHI achieved earnings of $371.2 million and strengthened its balance sheet by paying down over $1 billion in debt. Rising energy prices present challenges for PHI and its customers. The proxy statement announces the annual meeting to elect directors and ratify the independent auditor.
- Pepco Holdings, Inc. reported on its 2006 financial and operational performance in its annual report and proxy statement. It noted lower earnings compared to 2005 due to mild weather but continued growth in shareholder value.
- Key accomplishments in 2006 included implementing balanced rate mitigation plans, filing rate cases to cover increased delivery costs, proposing a major transmission line project, agreeing to sell remaining regulated generation assets, and achieving strong performance in wholesale energy and retail energy businesses.
- Looking ahead, the company plans to focus on growth through regulatory outcomes, infrastructure investments, environmental leadership programs, and improving wholesale energy market conditions.
13 Jun 24 ILC Retirement Income Summit - slides.pptxILC- UK
ILC's Retirement Income Summit was hosted by M&G and supported by Canada Life. The event brought together key policymakers, influencers and experts to help identify policy priorities for the next Government and ensure more of us have access to a decent income in retirement.
Contributors included:
Jo Blanden, Professor in Economics, University of Surrey
Clive Bolton, CEO, Life Insurance M&G Plc
Jim Boyd, CEO, Equity Release Council
Molly Broome, Economist, Resolution Foundation
Nida Broughton, Co-Director of Economic Policy, Behavioural Insights Team
Jonathan Cribb, Associate Director and Head of Retirement, Savings, and Ageing, Institute for Fiscal Studies
Joanna Elson CBE, Chief Executive Officer, Independent Age
Tom Evans, Managing Director of Retirement, Canada Life
Steve Groves, Chair, Key Retirement Group
Tish Hanifan, Founder and Joint Chair of the Society of Later life Advisers
Sue Lewis, ILC Trustee
Siobhan Lough, Senior Consultant, Hymans Robertson
Mick McAteer, Co-Director, The Financial Inclusion Centre
Stuart McDonald MBE, Head of Longevity and Democratic Insights, LCP
Anusha Mittal, Managing Director, Individual Life and Pensions, M&G Life
Shelley Morris, Senior Project Manager, Living Pension, Living Wage Foundation
Sarah O'Grady, Journalist
Will Sherlock, Head of External Relations, M&G Plc
Daniela Silcock, Head of Policy Research, Pensions Policy Institute
David Sinclair, Chief Executive, ILC
Jordi Skilbeck, Senior Policy Advisor, Pensions and Lifetime Savings Association
Rt Hon Sir Stephen Timms, former Chair, Work & Pensions Committee
Nigel Waterson, ILC Trustee
Jackie Wells, Strategy and Policy Consultant, ILC Strategic Advisory Board
Discover the Future of Dogecoin with Our Comprehensive Guidance36 Crypto
Learn in-depth about Dogecoin's trajectory and stay informed with 36crypto's essential and up-to-date information about the crypto space.
Our presentation delves into Dogecoin's potential future, exploring whether it's destined to skyrocket to the moon or face a downward spiral. In addition, it highlights invaluable insights. Don't miss out on this opportunity to enhance your crypto understanding!
https://36crypto.com/the-future-of-dogecoin-how-high-can-this-cryptocurrency-reach/
An accounting information system (AIS) refers to tools and systems designed for the collection and display of accounting information so accountants and executives can make informed decisions.
Fabular Frames and the Four Ratio ProblemMajid Iqbal
Digital, interactive art showing the struggle of a society in providing for its present population while also saving planetary resources for future generations. Spread across several frames, the art is actually the rendering of real and speculative data. The stereographic projections change shape in response to prompts and provocations. Visitors interact with the model through speculative statements about how to increase savings across communities, regions, ecosystems and environments. Their fabulations combined with random noise, i.e. factors beyond control, have a dramatic effect on the societal transition. Things get better. Things get worse. The aim is to give visitors a new grasp and feel of the ongoing struggles in democracies around the world.
Stunning art in the small multiples format brings out the spatiotemporal nature of societal transitions, against backdrop issues such as energy, housing, waste, farmland and forest. In each frame we see hopeful and frightful interplays between spending and saving. Problems emerge when one of the two parts of the existential anaglyph rapidly shrinks like Arctic ice, as factors cross thresholds. Ecological wealth and intergenerational equity areFour at stake. Not enough spending could mean economic stress, social unrest and political conflict. Not enough saving and there will be climate breakdown and ‘bankruptcy’. So where does speculative design start and the gambling and betting end? Behind each fabular frame is a four ratio problem. Each ratio reflects the level of sacrifice and self-restraint a society is willing to accept, against promises of prosperity and freedom. Some values seem to stabilise a frame while others cause collapse. Get the ratios right and we can have it all. Get them wrong and things get more desperate.
What Lessons Can New Investors Learn from Newman Leech’s Success?Newman Leech
Newman Leech's success in the real estate industry is based on key lessons and principles, offering practical advice for new investors and serving as a blueprint for building a successful career.
Explore the world of investments with an in-depth comparison of the stock market and real estate. Understand their fundamentals, risks, returns, and diversification strategies to make informed financial decisions that align with your goals.
Discovering Delhi - India's Cultural Capital.pptxcosmo-soil
Delhi, the heartbeat of India, offers a rich blend of history, culture, and modernity. From iconic landmarks like the Red Fort to bustling commercial hubs and vibrant culinary scenes, Delhi's real estate landscape is dynamic and diverse. Discover the essence of India's capital, where tradition meets innovation.
The Rise and Fall of Ponzi Schemes in America.pptxDiana Rose
Ponzi schemes, a notorious form of financial fraud, have plagued America’s investment landscape for decades. Named after Charles Ponzi, who orchestrated one of the most infamous schemes in the early 20th century, these fraudulent operations promise high returns with little or no risk, only to collapse and leave investors with significant losses. This article explores the nature of Ponzi schemes, notable cases in American history, their impact on victims, and measures to prevent falling prey to such scams.
Understanding Ponzi Schemes
A Ponzi scheme is an investment scam where returns are paid to earlier investors using the capital from newer investors, rather than from legitimate profit earned. The scheme relies on a constant influx of new investments to continue paying the promised returns. Eventually, when the flow of new money slows down or stops, the scheme collapses, leaving the majority of investors with substantial financial losses.
Historical Context: Charles Ponzi and His Legacy
Charles Ponzi is the namesake of this deceptive practice. In the 1920s, Ponzi promised investors in Boston a 50% return within 45 days or 100% return in 90 days through arbitrage of international reply coupons. Initially, he paid returns as promised, not from profits, but from the investments of new participants. When his scheme unraveled, it resulted in losses exceeding $20 million (equivalent to about $270 million today).
Notable American Ponzi Schemes
1. Bernie Madoff: Perhaps the most notorious Ponzi scheme in recent history, Bernie Madoff’s fraud involved $65 billion. Madoff, a well-respected figure in the financial industry, promised steady, high returns through a secretive investment strategy. His scheme lasted for decades before collapsing in 2008, devastating thousands of investors, including individuals, charities, and institutional clients.
2. Allen Stanford: Through his company, Stanford Financial Group, Allen Stanford orchestrated a $7 billion Ponzi scheme, luring investors with fraudulent certificates of deposit issued by his offshore bank. Stanford promised high returns and lavish lifestyle benefits to his investors, which ultimately led to a 110-year prison sentence for the financier in 2012.
3. Tom Petters: In a scheme that lasted more than a decade, Tom Petters ran a $3.65 billion Ponzi scheme, using his company, Petters Group Worldwide. He claimed to buy and sell consumer electronics, but in reality, he used new investments to pay off old debts and fund his extravagant lifestyle. Petters was convicted in 2009 and sentenced to 50 years in prison.
4. Eric Dalius and Saivian: Eric Dalius, a prominent figure behind Saivian, a cashback program promising high returns, is under scrutiny for allegedly orchestrating a Ponzi scheme. Saivian enticed investors with promises of up to 20% cash back on everyday purchases. However, investigations suggest that the returns were paid using new investments rather than legitimate profits. The collapse of Saivian l
How to Invest in Cryptocurrency for Beginners: A Complete GuideDaniel
Cryptocurrency is digital money that operates independently of a central authority, utilizing cryptography for security. Unlike traditional currencies issued by governments (fiat currencies), cryptocurrencies are decentralized and typically operate on a technology called blockchain. Each cryptocurrency transaction is recorded on a public ledger, ensuring transparency and security.
Cryptocurrencies can be used for various purposes, including online purchases, investment opportunities, and as a means of transferring value globally without the need for intermediaries like banks.
Confirmation of Payee (CoP) is a vital security measure adopted by financial institutions and payment service providers. Its core purpose is to confirm that the recipient’s name matches the information provided by the sender during a banking transaction, ensuring that funds are transferred to the correct payment account.
Confirmation of Payee was built to tackle the increasing numbers of APP Fraud and in the landscape of UK banking, the spectre of APP fraud looms large. In 2022, over £1.2 billion was stolen by fraudsters through authorised and unauthorised fraud, equivalent to more than £2,300 every minute. This statistic emphasises the urgent need for robust security measures like CoP. While over £1.2 billion was stolen through fraud in 2022, there was an eight per cent reduction compared to 2021 which highlights the positive outcomes obtained from the implementation of Confirmation of Payee. The number of fraud cases across the UK also decreased by four per cent to nearly three million cases during the same period; latest statistics from UK Finance.
In essence, Confirmation of Payee plays a pivotal role in digital banking, guaranteeing the flawless execution of banking transactions. It stands as a guardian against fraud and misallocation, demonstrating the commitment of financial institutions to safeguard their clients’ assets. The next time you engage in a banking transaction, remember the invaluable role of CoP in ensuring the security of your financial interests.
For more details, you can visit https://technoxander.com.
Every business, big or small, deals with outgoing payments. Whether it’s to suppliers for inventory, to employees for salaries, or to vendors for services rendered, keeping track of these expenses is crucial. This is where payment vouchers come in – the unsung heroes of the accounting world.
In World Expo 2010 Shanghai – the most visited Expo in the World History
https://www.britannica.com/event/Expo-Shanghai-2010
China’s official organizer of the Expo, CCPIT (China Council for the Promotion of International Trade https://en.ccpit.org/) has chosen Dr. Alyce Su as the Cover Person with Cover Story, in the Expo’s official magazine distributed throughout the Expo, showcasing China’s New Generation of Leaders to the World.
Dr. Alyce Su Cover Story - China's Investment Leadermsthrill
In World Expo 2010 Shanghai – the most visited Expo in the World History
https://www.britannica.com/event/Expo-Shanghai-2010
China’s official organizer of the Expo, CCPIT (China Council for the Promotion of International Trade https://en.ccpit.org/) has chosen Dr. Alyce Su as the Cover Person with Cover Story, in the Expo’s official magazine distributed throughout the Expo, showcasing China’s New Generation of Leaders to the World.
1. 10990 Roe Avenue
Overland Park, KS 66211
Phone 913 696 6100 Fax 913 696 6116
News Release
July 27, 2006
YRC Worldwide Reports Highest Quarterly EPS in Company History
OVERLAND PARK, KAN. --- YRC Worldwide Inc. (NASDAQ: YRCW) today announced second
quarter 2006 adjusted diluted earnings per share (“EPS”) of $1.62 compared to $1.40 per share in
second quarter 2005. Second quarter 2006 adjusted EPS excludes $.04 related to reorganization
expenses and net gains on property disposals that the company does not consider a part of core
operations. Reported EPS for second quarter 2006 was $1.58. Both the adjusted and reported EPS
for second quarter 2006 include $.01 of dilution from the company’s contingent convertible notes
based on an average YRCW stock price of $40.58 for the quarter.
“Due to a combination of strong execution, our unique cost initiatives, and a good economy, we
increased second quarter earnings per share by 16% compared to last year,” stated Bill Zollars,
Chairman, President and CEO of YRC Worldwide. “Our highest ever quarterly earnings per share of
$1.62 was more than our revised guidance of $1.53 to $1.58, as all of our business units performed
better than expected late in the quarter.”
YRC Worldwide reported the following consolidated results for the second quarter 2006:
▪ Record quarterly operating revenue of $2.57 billion compared to second quarter last year of
$2.09 billion, a 23% increase.
▪ Adjusted operating income of $177 million compared to second quarter 2005 adjusted operating
income of $138 million, an increase of $39 million or 28%. Adjustments in 2006 related to
reorganization expenses and net gains on property disposals. Reported operating income was
$172 million compared to reported operating income of $136 million in 2005.
For the six months ended June 30, 2006, YRC Worldwide reported the following consolidated results:
▪ Adjusted diluted EPS of $2.34 compared to $2.32 for the same period last year. Reported diluted
EPS of $2.29 compared to $2.34 for the same period in 2005.
▪ Operating revenue of $4.94 billion, up 31% from the same period last year.
▪ Adjusted operating income of $265 million compared to $225 million for the six months ended
June 30, 2005, an increase of $40 million or 18%. Adjustments in 2006 related to reorganization
expenses and net gains on property disposals. Reported operating income was $260 million
compared to reported operating income of $226 million in 2005.
Please note the 2006 results include the USF companies for the entire period. The 2005 results
include the USF companies from the date of the company’s acquisition of USF Corporation on
May 24, 2005.
Selected Segment Highlights for Second Quarter 2006
▪ YRC Regional Transportation
Second quarter revenue of $654 million.
Adjusted operating income of $53 million and an adjusted operating ratio of 91.8%. Reported
operating income of $54 million with a reported operating ratio of 91.8%.
LTL revenue per hundred weight up 9.4% when compared to second quarter 2005.*
Total tonnage per day up 5.1% and LTL tonnage per day up 4.6% from second quarter 2005.*
2. ▪ Roadway
Second quarter revenue of $877 million, up 5.5% from second quarter last year.
Adjusted operating income of $57 million compared to $52 million in second quarter 2005.
Reported operating income of $58 million compared to $51 million in second quarter last year.
LTL revenue per hundred weight, adjusted for business mix, up 7.0% compared to second
quarter last year.
Total tonnage up 2.4% and LTL tonnage up 1.8% when compared to second quarter last year,
after adjusting for Good Friday.
▪ Yellow Transportation
Second quarter revenue of $886 million, up 4.1% from second quarter last year.
Adjusted operating income of $69 million, consistent with second quarter 2005, and reported
operating income of $66 million.
LTL revenue per hundred weight, adjusted for business mix, up 6.6% compared to second
quarter last year.
Total tonnage up 1.2% and LTL tonnage consistent with last year, after adjusting for Good
Friday.
▪ Meridian IQ
Second quarter revenue of $154 million.
Adjusted operating income of $4.3 million compared to $3.6 million in second quarter 2005.
Reported operating income of $2.7 million compared to $3.6 million in second quarter 2005.
*Includes the operating companies of New Penn Motor Express, USF Bestway, USF Holland and USF Reddaway.
For complete statistical information, refer to the company’s website at yrcw.com under Investor
Relations and then select Earnings Releases & Operating Statistics.
Outlook
“We feel good about the progress made during the quarter at all of our business units. We expected
to quickly get back on track after the first quarter results and we did. We anticipate a healthy
economy and look forward to a solid second half of the year,” Zollars said.
The company’s expectations include the following:
▪ Full year 2006 EPS between $5.65 and $5.85, including $.08 per share of dilution from the
contingent convertibles based on a year-to-date average YRCW stock price of $43.41.
▪ Third quarter 2006 EPS between $1.70 and $1.80, including $.02 per share of dilution from the
contingent convertibles based on the third quarter-to-date YRCW average stock price of $42.53.
▪ Full year 2006 consolidated revenue of about $10 billion, interest expense between $90 and
$92 million and a consolidated income tax rate of 38.3%.
▪ Diluted average shares of around 59 million.
▪ 2006 gross capital expenditures between $375 and $400 million.
Review of Financial Results
YRC Worldwide (NASDAQ: YRCW) will host a conference call for the investment community on
Friday, July 28, 2006, beginning at 9:30 a.m. ET, 8:30 a.m. CT.
Investors and analysts should dial 1.888.609.3912 at least 10 minutes prior to the start of the call.
The conference ID number is 1605043. The conference call will be open to listeners through a live
webcast via StreetEvents at streetevents.com and via the YRC Worldwide Internet site yrcw.com.
3. An audio playback will be available beginning two hours after the call ends until midnight on
August 11, 2006, by calling 1.800.642.1687 and then entering the access code 1605043. An audio
playback also will be available for 30 days after the call via the StreetEvents and YRC Worldwide web
sites.
* * * * *
The preceding disclosures contain references to ‘reported’ and ‘adjusted’ operating income and earnings per
share. Reported numbers include property gains and losses, reorganization expenses and acquisition charges,
while adjusted numbers exclude these items. Management adjusts for these items when evaluating operating
performance to more accurately compare the results among periods.
This news release contains forward-looking statements within the meaning of Section 27A of the Securities Act
of 1933, as amended, and Section 21E of the Securities Exchange Act of 1934, as amended. The words
“expect” and similar expressions are intended to identify forward-looking statements. It is important to note that
the company’s actual future results, revenue and earnings per share could differ materially from those projected
in such forward-looking statements because of a number of factors, including (without limitation), inflation,
inclement weather, price and availability of fuel, sudden changes in the cost of fuel or the index upon which the
company bases its fuel surcharge, competitor pricing activity, expense volatility, including (without limitation)
expense volatility due to changes in rail service or pricing for rail service, ability to capture cost reductions,
including (without limitation) those cost reduction opportunities arising from acquisitions, a downturn in general
or regional economic activity, changes in equity and debt markets, effects of a terrorist attack, and labor
relations, including (without limitation), the impact of work rules, any obligations to multi-employer health,
welfare and pension plans, wage requirements and employee satisfaction.
The company’s expectations for the amount of its diluted average shares are only its expectations regarding this
amount. Actual diluted average shares could differ based on a number of factors including (among others) the
number of employee and director stock option exercises, actual amounts of stock awarded to employees and
directors during the year, the dilutive impact of the contingent convertible notes based on the company’s
average stock price, and any unanticipated issuance of stock for currently unplanned financings or acquisitions.
The company’s expectations regarding its interest expense are only its expectations regarding this expense.
Actual interest expense could differ based on a number of factors including (among others) the company’s
revenue and profitability results and the factors that affect revenue and results described above, the amount,
character and interest rate on the company’s outstanding debt and any financings the company may enter into
in the future.
The company’s expectations regarding its gross capital expenditures are only its expectations regarding these
expenditures. Actual expenditures could differ based on (among others) the following factors: impacts on our
business from the factors described above, the accuracy of our estimates of our spending requirements, the
occurrence of any unanticipated acquisition opportunities, changes in our strategic direction, the need to spend
additional capital on cost reduction opportunities, and the need to replace any unanticipated losses in capital
assets.
The company’s expectations regarding its effective tax rate are only its expectations regarding this rate. The
actual rate could differ based on (among others) the following factors: variances in pre-tax earnings on both a
consolidated and business units basis, variance in pre-tax earnings by jurisdiction, impacts on our business from
the factors described above, variances in estimates on non-deductible expenses, tax authority audit
adjustments, change in tax rates and availability of tax credits.
YRC Worldwide Inc., a Fortune 500 company and one of the largest transportation service providers in the
world, is the holding company for a portfolio of successful brands including Yellow Transportation, Roadway,
Reimer Express, Meridian IQ, USF Holland, USF Reddaway, USF Bestway, USF Glen Moore, and New Penn
Motor Express. The enterprise provides global transportation services, transportation management solutions
and logistics management. The portfolio of brands represents a comprehensive array of services for the
shipment of industrial, commercial and retail goods domestically and internationally. Headquartered in Overland
Park, Kansas, YRC Worldwide employs approximately 70,000 people.
Investor Contact: Phil J. Gaines Media Contact: Suzanne Dawson
YRC Worldwide Linden Alschuler & Kaplan
913.696.6108 212.329.1420
phil.gaines@yrcw.com sdawson@lakpr.com
4. STATEMENTS OF CONSOLIDATED OPERATIONS
YRC Worldwide Inc. and Subsidiaries
For the Three and Six Months Ended June 30
(Amounts in thousands except per share data)
(Unaudited)
Three Months Six Months
2006 2005 2006 2005
OPERATING REVENUE $ 2,565,779 $ 2,088,846 $ 4,939,940 $ 3,766,807
OPERATING EXPENSES:
Salaries, wages and employees' benefits 1,459,881 1,237,467 2,861,813 2,270,914
Operating expenses and supplies 468,422 333,592 918,349 590,049
Purchased transportation 280,618 228,331 533,904 411,984
Depreciation and amortization 74,722 59,080 148,162 105,048
Other operating expenses 105,600 92,444 212,466 164,125
(Gains) losses on property disposals, net (3,226) 1,250 (2,344) (1,984)
Reorganization and acquisition charges 7,481 864 7,481 864
Total operating expenses 2,393,498 1,953,028 4,679,831 3,541,000
OPERATING INCOME 172,281 135,818 260,109 225,807
NONOPERATING (INCOME) EXPENSES:
Interest expense 23,111 14,189 43,659 22,804
Other (563) (1,316) (1,359) (545)
Nonoperating expenses, net 22,548 12,873 42,300 22,259
INCOME BEFORE INCOME TAXES 149,733 122,945 217,809 203,548
INCOME TAX PROVISION 57,481 46,840 83,421 77,550
NET INCOME $ 92,252 $ 76,105 $ 134,388 $ 125,998
AVERAGE SHARES OUTSTANDING-BASIC 57,464 52,639 57,419 50,728
AVERAGE SHARES OUTSTANDING-DILUTED 58,422 55,319 58,801 53,791
BASIC EARNINGS PER SHARE $ 1.61 $ 1.45 $ 2.34 $ 2.48
DILUTED EARNINGS PER SHARE $ 1.58 $ 1.38 $ 2.29 $ 2.34
5. SUPPLEMENTAL FINANCIAL INFORMATION
YRC Worldwide Inc. and Subsidiaries
For the Three Months Ended June 30
(Amounts in thousands except per share data)
(Unaudited)
Three Months
2006 2005 %
Operating revenue:
Yellow Transportation $ 885,850 $ 851,152 4.1
Roadway 876,851 830,870 5.5
a
YRC Regional Transportation 654,066 314,490 n/m
a
Meridian IQ 153,601 95,642 n/m
Corporate and other (4,589) (3,308)
Consolidated 2,565,779 2,088,846 22.8
Reported operating income (loss):
Yellow Transportation 66,320 68,491 (3.2)
Roadway 57,868 51,187 13.1
b a
YRC Regional Transportation 53,587 19,845 n/m
a
Meridian IQ 2,737 3,567 n/m
b
Corporate and other (8,231) (7,272)
Consolidated 172,281 135,818 26.8
c
Adjustments to operating income by segment :
Yellow Transportation 2,401 148
Roadway (735) 1,055
YRC Regional Transportation (275) 394
Meridian IQ 1,525 2
Corporate and other 1,339 515
Consolidated 4,255 2,114
Adjusted operating income (loss):
Yellow Transportation 68,721 68,639 0.1
Roadway 57,133 52,242 9.4
YRC Regional Transportation 53,312 20,239 n/m
Meridian IQ 4,262 3,569 n/m
Corporate and other (6,892) (6,757)
Consolidated $ 176,536 $ 137,932 28.0
Reported operating ratio:
Yellow Transportation 92.5% 92.0%
Roadway 93.4% 93.8%
YRC Regional Transportation 91.8% 93.7%
Meridian IQ 98.2% 96.3%
Consolidated 93.3% 93.5%
Adjusted operating ratio:
Yellow Transportation 92.2% 91.9%
Roadway 93.5% 93.7%
YRC Regional Transportation 91.8% 93.6%
Meridian IQ 97.2% 96.3%
Consolidated 93.1% 93.4%
Reconciliation of reported diluted earnings per
share (EPS) to adjusted diluted EPS:
Reported diluted EPS $ 1.58 $ 1.38
(Gains) losses on property disposals (0.04) 0.01
Reorganization expenses 0.08 -
Acquisition charges - 0.01
Adjusted diluted EPS $ 1.62 $ 1.40
6. SUPPLEMENTAL FINANCIAL INFORMATION
YRC Worldwide Inc. and Subsidiaries
For the Six Months Ended June 30
(Amounts in thousands except per share data)
(Unaudited)
Six Months
2006 2005 %
Operating revenue:
Yellow Transportation $ 1,726,358 $ 1,642,318 5.1
Roadway 1,682,116 1,597,639 5.3
a
YRC Regional Transportation 1,246,111 379,904 n/m
a
Meridian IQ 293,447 152,051 n/m
Corporate and other (8,092) (5,105)
Consolidated 4,939,940 3,766,807 31.1
Reported operating income (loss):
Yellow Transportation 97,874 117,318 (16.6)
Roadway 95,531 88,267 8.2
b a
YRC Regional Transportation 75,010 27,890 n/m
a
Meridian IQ 5,214 4,608 n/m
b
Corporate and other (13,520) (12,276)
Consolidated 260,109 225,807 15.2
c
Adjustments to operating income by segment :
Yellow Transportation 1,794 (2,512)
Roadway (151) 497
YRC Regional Transportation (265) 371
Meridian IQ 1,513 -
Corporate and other 2,246 524
Consolidated 5,137 (1,120)
Adjusted operating income (loss):
Yellow Transportation 99,668 114,806 (13.2)
Roadway 95,380 88,764 7.5
YRC Regional Transportation 74,745 28,261 n/m
Meridian IQ 6,727 4,608 n/m
Corporate and other (11,274) (11,752)
Consolidated $ 265,246 $ 224,687 18.1
Reported operating ratio:
Yellow Transportation 94.3% 92.9%
Roadway 94.3% 94.5%
YRC Regional Transportation 94.0% 92.7%
Meridian IQ 98.2% 97.0%
Consolidated 94.7% 94.0%
Adjusted operating ratio:
Yellow Transportation 94.2% 93.0%
Roadway 94.3% 94.4%
YRC Regional Transportation 94.0% 92.6%
Meridian IQ 97.7% 97.0%
Consolidated 94.6% 94.0%
Reconciliation of reported diluted EPS to adjusted
diluted EPS:
Reported diluted EPS $ 2.29 $ 2.34
Gains on property disposals (0.03) (0.03)
Reorganization expenses 0.08 -
Acquisition charges - 0.01
Adjusted diluted EPS $ 2.34 $ 2.32
7. a
Includes the revenue and operating income of USF operating companies since May 24, 2005, the date of acquisition.
b Amounts related to USF Dugan and USF Red Star, which were shut down in previous periods, have been classified in
'Corporate and Other' for 2006. The 2005 amounts continue to be classified in YRC Regional Transportation.
C Management excludes these items when evaluating operating income and segment performance to more accurately compare
the results of our core operations among periods. Adjustments presented in the 2006 period herein consist of property gains
and losses and reorganization expenses. Adjustments presented in the 2005 period herein consist of property gains and
losses and acquisition charges.
8. Selected Financial Data
YRC Worldwide Inc. and Subsidiaries
(Amounts in thousands unless otherwise noted)
(Unaudited)
For the Six Months Ended June 30,
2006 2005
Net cash from operating activities $ 157,923 $ 184,649
Net cash used in investing activities (243,507) (862,386)
Net cash provided by financing activities 86,826 633,643
Gross capital expenditures (250,162) (120,523)
Net capital expenditures (226,117) (108,086)
Proceeds from exercise of stock options 2,296 800
Free cash flow a (65,898) 77,363
June 30, December 31,
2006 2005
Cash and cash equivalents $ 83,603 $ 82,361
Accounts receivable, net 1,254,080 1,164,383
Net property and equipment 2,299,273 2,205,792
Total assets 6,001,965 5,734,189
Asset backed securitization borrowings 449,500 374,970
Long-term debt, less current portion 1,118,291 1,113,085
Total debt 1,567,791 1,488,055
Total shareholders' equity 2,088,245 1,936,488
Debt to capitalization b 42.9% 43.5%
Debt to capitalization, less cash 41.5% 42.1%
Management uses free cash flow as an indication of the cash available to fund additional capital expenditures, to reduce
a
outstanding debt (including current maturities), or to invest in our growth strategies. Free cash flow is calculated as net cash
from operating activities plus stock option proceeds less net capital expenditures. This measurement is used for internal
management purposes and should not be construed as a better measurement than net cash from operating activities as
defined by generally accepted accounting principles.
b
We calculate debt to capitalization as total debt divided by total debt plus total shareholders' equity.