This document provides an overview and financial analysis of Yes Bank, an Indian private sector bank. Some key details:
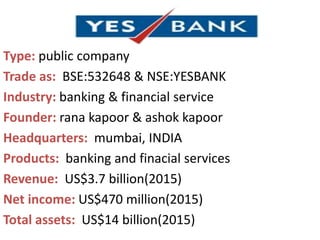
- Yes Bank was founded in 2004 and is headquartered in Mumbai. It provides banking and financial services.
- As of 2015, Yes Bank had revenues of $3.7 billion, net income of $470 million, and total assets of $14 billion.
- The bank has received several awards and recognitions for its performance and innovation.
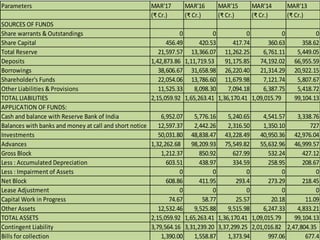
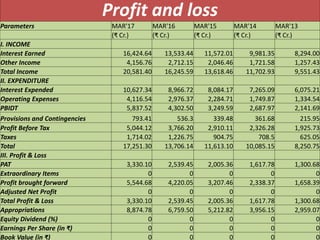
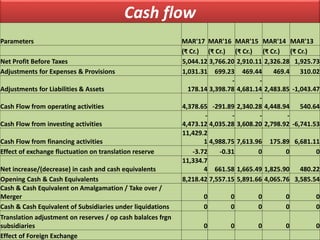
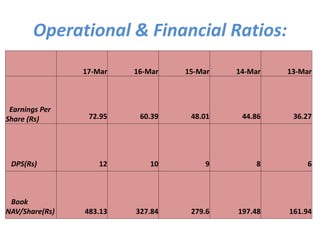
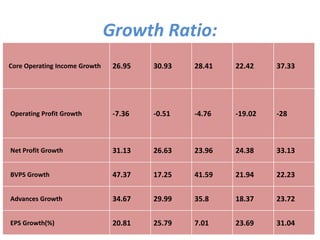
- Over the last 5 years, Yes Bank has seen significant growth in deposits, advances, and total assets, with profits also rising steadily over this period.
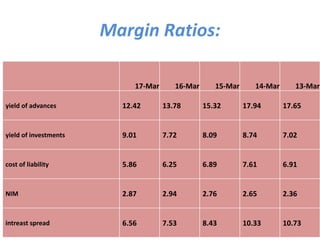
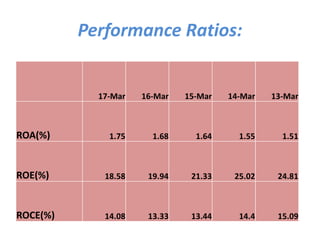
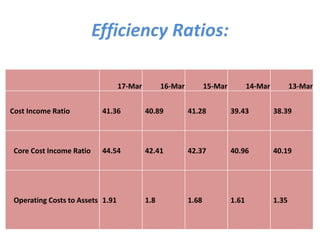
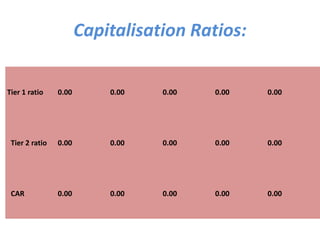
- Various ratios show improving performance and profitability from 2013-2017 across areas like margins,

![Listings and shareholding
Yes Bank equity shares are listed on Bombay Stock Exchange and the National Stock Exchange
of India
Shareholders (as on 31-Mar-2013) Shareholding[12]
Promoter Group 25.72%
Foreign Institutional Investors (FII) 48.95%
Individual shareholders 09.44%
Insurance Companies 09.27%
Banks/Financial Institutions/Mutual Funds/UTI 03.87%
Others 02.855%
Total 100.0%](https://image.slidesharecdn.com/financialstatementanalysis-170829172212/85/Yes-bank-balance-sheet-3-320.jpg)