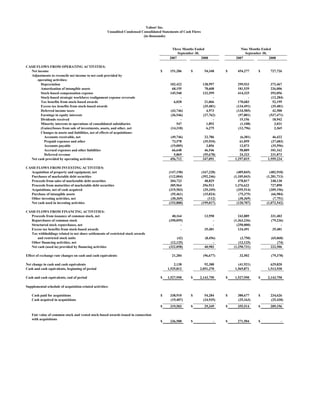
- Yahoo reported third quarter 2008 financial results, with revenues of $1.786 billion, operating income of $70 million, and operating income before depreciation and amortization of $410 million.
- Revenues were up slightly by 1% year-over-year, while operating income was down 53% due to costs associated with strategic initiatives and a more difficult economic climate.
- Yahoo announced cost reduction initiatives aimed at reducing expenses by over $400 million by the end of 2008, including a workforce reduction of at least 10%.
- Yahoo reported financial results for Q3 2008 with total revenues of $1.786 billion, operating income of $70 million, and operating income before depreciation and amortization of $410 million.
- Revenues increased 1% year-over-year while operating income decreased 53% due to costs associated with strategic initiatives and a tougher revenue climate.
- Yahoo began implementing cost reduction initiatives to reduce annual costs by over $400 million, including reducing headcount by at least 10%, to enhance profitability.
- Yahoo reported financial results for Q1 2008 with revenues of $1.8 billion, operating income of $121 million, and operating income before depreciation, amortization, and stock-based compensation of $433 million.
- Net income was $542 million including a $401 million non-cash gain from Alibaba Group's IPO, and non-GAAP net income was $150 million.
- Cash flow from operating activities increased 81% to $786 million due to a $350 million payment from AT&T, and free cash flow increased 75% to $647 million.
Yahoo reported financial results for Q4 2008 and full year 2008. Revenues for Q4 2008 were $1.8 billion, a 1% decrease from the prior year. For the full year, revenues were $7.2 billion, a 3% increase. The company reported a Q4 operating loss of $278 million compared to operating income of $191 million in the prior year. However, adjusted for restructuring and other charges, operating income was $542 million for Q4 2008. Yahoo also saw declines in cash flow from operating activities but ended the year with $3.5 billion in cash and marketable securities.
This document provides financial results and an outlook for TRW Automotive Holdings Corp. for the second quarter and first half of 2008. It includes a press release summarizing key financial figures, as well as supplementary financial summaries and presentation slides. For the second quarter, TRW reported sales of $4.4 billion, an 18.4% increase from the prior year, and net earnings of $127 million. For the first half, sales were $8.6 billion, up 17.3%, and net earnings were $221 million. The company increased its full year 2008 sales and earnings guidance but noted deteriorating conditions in North America and expectations of a softening European market.
Second Quarter of Fiscal Year Ending March 2018 (FY2017)Briefing on Financial...RicohLease
This document provides a briefing on Ricoh Leasing Company's financial results for the second quarter of Fiscal Year 2017, which ended in September 2017. It discusses the company's consolidated results including record high net sales and operating profit that progressed as expected. It also reviews performance by business segment and topics covered in the company's mid-term management plan, including initiatives in expanding their environmental business. The briefing includes forecasts for the full fiscal year and provides key financial metrics and trends.
Third Quarter 2013 Investor PresentationCNOServices
- The document provides financial and operating results for CNO Financial Group for the third quarter of 2013.
- Key highlights include continued growth in sales and premiums across business segments, solid performance from core earnings drivers, and a strong capital and liquidity position.
- CNO deployed $222 million year-to-date for share repurchases and $18 million in dividends, while maintaining strong capital ratios and leverage.
- ADP reported 8% revenue growth and 14% adjusted diluted EPS growth for the second quarter of fiscal year 2018.
- For fiscal year 2018, ADP expects total revenues to grow 7-8% and adjusted diluted EPS to increase 12-13%.
- ADP will continue investing in innovation, service, and distribution while also pursuing acquisitions like its recent purchase of WorkMarket, a freelance management solution provider.
This document brings together a set
of latest data points and publicly
available information relevant for
Energy Industry. We are very excited
to share this content and believe that
readers will benefit from this
periodic publication immensely.
Morgan Stanley reported record quarterly and six-month financial results for fiscal year 2007. Net revenues for the quarter were a record $11.5 billion, up 32% from the previous year. Income from continuing operations for the quarter was also a record at $2.6 billion, up 41% compared to the prior year. All business segments achieved record or near record results, with Institutional Securities seeing a 39% increase in net revenues. The company also announced it will spin off Discover Financial Services on June 30, 2007.
This document summarizes Kodak's preliminary Q4 2008 financial results and actions being taken in response to the global recession. Key points:
- Q4 sales declined 24% to $2.433B due to declines in digital (-23%) and traditional (-27%) businesses.
- Q4 loss from continuing operations was $133M; full year earnings were $54M (results are preliminary pending impairment assessments).
- Kodak is aligning its cost structure to current economic conditions through executive pay cuts, expense reductions, and job cuts.
Atento reported its first quarter 2017 results, with the following highlights:
- Revenue increased 3.0% overall and 8.8% from multisector clients. Brazil and EMEA saw revenue growth while Americas was flat.
- Adjusted EBITDA margin was stable at 11.5% due to inflation pass-through, efficiency initiatives, and an improved revenue mix.
- Adjusted EPS grew 30.8% to $0.17 per share from lower net interest expense and debt paydown.
- Free cash flow before interest improved by $17.8 million to $(9.7) million due to better working capital. Atento reiterated its full-year targets.
Atento reported its third quarter 2018 results, with revenues increasing 0.9% year-over-year driven by continued growth in multisector revenues. Brazil saw a revenue increase of 2.8% and a strong margin expansion of 3.3 percentage points to 11.9% due to operational improvements. The Americas saw revenues decline 1.2% impacted by lower volumes, while EMEA revenues grew 2.1% with adjusted EBITDA margin expanding 3.9 percentage points to 10.3% due to higher multisector volumes.
- ADP reported 8% revenue growth and 11% growth in diluted EPS for the third quarter of fiscal year 2018. Adjusted diluted EPS grew 16%.
- New business bookings increased 9% year-over-year, reflecting strong demand for ADP's HCM solutions.
- For fiscal year 2018, ADP expects 7-8% revenue growth, 16-17% growth in adjusted diluted EPS, and a 2.5% increase in U.S. pays per control.
- Q3 2018 revenue increased 13% to $446 million, driven by a 22% increase in PEG revenue. Batesville revenue decreased 6%.
- GAAP EPS was $0.56, up 9% from the prior year. Adjusted EPS was $0.57, up 8%.
- PEG revenue growth was driven by continued demand across segments. Adjusted EBITDA margin decreased due to a higher proportion of lower margin projects.
- Batesville revenue declined due to lower estimated cremation rates and an upfront incentive linked to a key customer contract renewal. Adjusted EBITDA margin declined due to the contract renewal and cost inflation.
Integer reported strong financial results for the first quarter of 2018. Sales grew 9% organically compared to the first quarter of 2017, driven by growth across all product lines. Adjusted EBITDA increased 7% organically and adjusted net income increased 48% organically. Integer also generated record cash flow in the quarter and used $50 million to repay debt, lowering leverage. For full-year 2018, Integer increased its outlook for sales growth to 3-6% and adjusted EPS growth to 14-25%, driven by continued momentum. The company also announced a planned sale of its Advanced Surgical and Orthopedics product lines for $600 million.
Integer delivered strong financial results in the first quarter of 2018. Sales grew organically by 9% compared to the first quarter of 2017, driven by growth across all product lines. Adjusted EBITDA increased 7% organically and adjusted net income increased 48% organically. Integer is increasing its full-year 2018 outlook and expects sales growth between 3-6% and adjusted EPS growth between 14-25%. The company also announced the planned sale of its Advanced Surgical and Orthopedics product lines for $600 million, which it expects will make Integer a more profitable and less leveraged company with similar cash flow.
ADP reported solid results for the 1st quarter of fiscal year 2017, with 7% revenue growth and strong margin expansion. Revenues increased 7% as reported and 8% on a constant currency basis. Adjusted EBIT margin increased 230 basis points. New business bookings for PEO services were flat compared to the prior year when excluding a single client loss in the consumer health spending account business. ADP reaffirmed its fiscal year 2017 guidance for revenue growth of 7-8% and adjusted diluted EPS growth of 11-13%.
- Q1 earnings presentation for 2017 reported that the company achieved guidance on revenue and profits despite a tough consumer environment.
- Launched 17 new show concepts with many showing potential for growth. Improved key customer metrics including purchase frequency and growth in wearable category customers.
- Digital sales increased as a percentage of total sales and mobile sales increased as a percentage of digital sales. Engagement on social media and streaming platforms also improved.
- Intel reported first-quarter revenue of $8.9 billion, operating income of $1.7 billion, and earnings per share of 23 cents. Excluding share-based compensation, operating income was $2.1 billion and EPS was 27 cents.
- Revenue declined 5% year-over-year and 12% sequentially due to moderating PC growth rates leading to slower chip-level inventory reductions and affecting revenue.
- The outlook for the second quarter expects revenue between $8.0-8.6 billion and gross margin of 49%, plus or minus a couple points.
Fiscal Year Ended March 2017 (FY2016) Briefing on Financial ResultsRicohLease
This document summarizes the financial results of Ricoh Leasing Company for the fiscal year ending March 2017. Some key highlights include:
- Net sales reached a record high of 2,911 billion yen, up 5.5% from the previous year.
- Operating profit was 173 billion yen, another record high and up 2.3% from the previous year.
- Net income was 117 billion yen, another record high and up 6.5% from the previous year.
- Intel reported Q4 revenue of $8.2 billion, down 19% sequentially, with operating income of $1.5 billion, down 50% sequentially and net income of $234 million. For the full year 2008, revenue was $37.6 billion, down 2% from 2007, with operating income of $9 billion, up 9% from 2007 and net income of $5.3 billion.
- Looking ahead, Intel expects Q1 revenue in the vicinity of $7 billion with gross margin in the low 40s due to higher costs. For full year 2009, spending is expected to be between $10.4-10.6 billion with a tax rate of around 27%.
- The results
- Masonite reported 3Q16 net sales of $489.6 million, up 3% from 3Q15. Adjusted EBITDA increased 29% to $65.1 million.
- North American residential sales grew 11% due to strength in both retail and wholesale channels. Adjusted EBITDA margin expanded 210 bps.
- Europe sales declined 11% from foreign exchange impacts, but adjusted EBITDA grew 34% driven by portfolio optimization and higher average selling prices.
- Architectural sales grew 3% and adjusted EBITDA margin increased 110 bps from price increases.
- The company remains focused on operational efficiencies, new product innovation, and digital strategies to support long-term growth
20180228 me greif-q1-2018-earnings-deck_final-(1)greif2015
The document provides an earnings conference call summary for the first quarter of 2018. Key points include:
- Operating profits were down for the Rigid Industrial Packaging & Services segment due to temporary winter slowdowns and higher raw material and transportation costs.
- Paper Packaging & Services saw higher sales, operating profits, and a price increase announced.
- Flexible Products & Services showed improved performance across regions.
- Guidance for the fiscal year was maintained despite some factors such as higher pension and tax reform impacts.
- Tax reform provides long-term benefits including a lower tax rate and accelerated depreciation options.
This document provides a summary of Greif's Q3 2017 earnings conference call held on August 31, 2017. Some key highlights include:
- Net sales increased 14% year-over-year to $962 million. Operating profit before special items increased 13% to $94.5 million.
- All of Greif's business segments saw year-over-year sales growth, with particularly strong growth in the Rigid Industrial Packaging & Services segment.
- Customer satisfaction metrics improved across most business segments compared to the prior year.
- Greif reaffirmed its full-year 2017 guidance for class A earnings per share before special items and free cash flow.
- Greif continues focusing on operational improvements,
1. CNO Financial reported financial and operating results for 1Q13 with earnings growth across its core business segments and higher operating EPS compared to 1Q12.
2. Investment income increased due to growth in invested assets and a targeted credit strategy, while underwriting margins remained strong.
3. Capital levels remained high with an RBC ratio of 366% and leverage of 19.5%, and the company deployed capital by repurchasing convertible debt.
- Revenue for Q2 2018 increased 14% to $452 million, driven by a 23% increase in revenue for the Process Equipment Group. Adjusted EPS increased 23% to $0.65 compared to the prior year.
- The Process Equipment Group saw a 23% revenue increase and a 130 basis point increase in adjusted EBITDA margin to 16.6% due to strong operating leverage, productivity improvements, and pricing increases.
- Batesville's revenue increased 1% while adjusted EBITDA margin decreased 290 basis points to 25.3% primarily due to supply chain inefficiencies and cost inflation.
Google filed a Form 10-Q with the SEC for the quarter ending September 30, 2005. Some key details from the filing include:
- Revenues for the quarter were $1.58 billion, up from $806 million in the same quarter last year. Net income was $381 million, up from $52 million last year.
- Cash and cash equivalents totaled $5.52 billion at the end of the quarter, up from $427 million at the end of 2004.
- Total costs and expenses for the quarter were $1.05 billion, up from $795 million in the same quarter last year.
- Basic and diluted earnings per share for the quarter were $1
- Revenue grew 31% year-over-year and 3% quarter-over-quarter to $5.5 billion, with international revenue reaching $2.8 billion.
- Despite economic challenges, traffic and revenue remained solid in Q3 due to key investments in search and ads.
- Cost containment measures helped maintain a 30% operating margin and $1.29 billion in net income.
- The document is Google Inc.'s Form 10-Q filing with the SEC for the quarterly period ended September 30, 2007.
- It provides Google's consolidated financial statements including balance sheets, income statements, and cash flow statements for interim periods.
- The financial statements show Google's revenues increased over the comparable prior year periods as did costs and expenses, resulting in increased income from operations and net income.
- Yahoo reported Q3 2008 revenue of $1.786 billion, up 1% year-over-year. Revenue excluding traffic acquisition costs was $1.325 billion, down 2% quarter-over-quarter.
- Operating cash flow for Q3 2008 was $410 million, down 12% year-over-year and 4% quarter-over-quarter. Operating cash flow as a percentage of revenue excluding TAC was 31%.
- Free cash flow for Q3 2008 was $231 million, down from $647 million in Q1 2008. Cash and marketable securities totaled $3.299 billion at the end of Q3 2008.
Yahoo's 1999 annual report highlights:
1) Yahoo had become an essential part of people's lives and the only place anyone needs to go to find and connect with anything or anybody.
2) As a global network, Yahoo was uniquely able to leverage its technology platform to support changing consumer and business needs worldwide.
3) Yahoo attracted over 120 million users who trusted the company to provide a wide range of content and perspectives.
Citigroup reported its quarterly financial results. Core income decreased 7% from the prior year quarter to $3.66 billion. Total revenues declined across most business segments, with the exception of the Global Consumer segment which increased revenues slightly. Overall, Citigroup saw lower earnings due to weaker market conditions impacting its trading and investment banking businesses. Capital ratios and credit quality metrics remained strong however, positioning Citigroup well despite the challenging environment.
Yahoo's 1997 annual report summarizes the company's significant growth and leadership in the emerging internet industry. Revenues increased 242% to $67.4 million as traffic and the advertiser base tripled. Yahoo established itself as the #1 internet navigation site and expanded its global presence and services in news, finance, communications and e-commerce. While managing growth carefully, Yahoo positioned itself for continued leadership in delivering quality content and building its trusted brand on a global scale.
This document outlines Terry Semel's annual letter to Yahoo's shareholders for 2003. The summary is:
1) Yahoo had a very successful year in 2003, with revenue growing 71% to $1.6 billion due to diversifying revenue streams beyond dot-com advertising.
2) Key areas of focus and investment were search and commerce, premium services, communications products, and media/content which led to growing user engagement.
3) The marketing services business nearly doubled in revenue due to building the largest online advertising platform with exposure to small/medium and large advertisers.
4) Looking ahead, Semel outlines continued focus on product/service innovation, international growth, broadband content, and building on
Yahoo reported financial results for Q2 2008 with the following highlights:
- Revenues were $1.8 billion, up 6% year-over-year, driven by a 14% increase in marketing services revenues from owned and operated sites.
- Operating income was $101 million, down 45% due to $22 million in costs related to strategic initiatives.
- Operating cash flow (before depreciation, amortization, and stock compensation) was $427 million, down 10% year-over-year.
- Net income was $131 million, down 18% year-over-year.
TRW Automotive Holdings Corp. reported first quarter 2008 financial results with sales of $4.1 billion, a 16.2% increase over the same period in 2007. Net earnings were $94 million or $0.92 per diluted share, compared to a net loss of $86 million or $0.87 per share in 2007. The company increased its full year 2008 sales outlook to a range of $16.2 to $16.6 billion and net earnings per share outlook to a range of $2.30 to $2.60.
TRW Automotive reported third quarter 2008 financial results with sales of $3.6 billion, up 2.8% from the prior year. However, the company reported a net loss of $54 million compared to net earnings of $23 million in the prior year. Sales increased due to currency movements and module sales, but core product sales declined sharply, driving the earnings decrease. For 2008, TRW expects sales of $15.3 billion and net earnings per share of $0.90 to $1.10, reflecting challenges in the automotive industry.
Yahoo reported financial results for the second quarter of 2009. Revenues declined 13% year-over-year to $1.573 billion, exceeding the midpoint of guidance. Non-GAAP net income was $229 million, up 2% year-over-year. The CEO stated that Yahoo is focused on creating innovative products to increase user engagement and offer a compelling advertising proposition. For Q3 2009, Yahoo expects revenues of $1.45-1.55 billion and non-GAAP operating income of $330-370 million.
- Adobe reported record quarterly and annual revenue for its fiscal year 2008. Fourth quarter revenue was $915.3 million, a slight increase from the same quarter last year. Annual revenue for 2008 was $3.58 billion, a 13% increase from fiscal year 2007.
- Despite a difficult economic environment, Adobe was able to achieve double digit growth for the sixth consecutive year through consistent execution and disciplined expense management.
- For the first quarter of fiscal year 2009, Adobe is targeting revenue of $800-850 million and earnings per share of $0.30-0.35 on a GAAP basis and $0.43-0.47 on a non-GAAP basis.
Northrop Grumman reported financial results for Q4 2008 and full year 2008. Q4 sales increased 4% to a record $9.2 billion while 2008 sales rose 6% to a record $33.9 billion. However, the company reported losses for both periods due to a non-cash goodwill impairment charge of $3.1 billion. Excluding this charge, Q4 EPS rose 19% to $1.57 and 2008 EPS increased 1% to $5.21. Total backlog reached a record high of $78 billion and new business awards set a record of $48.3 billion in 2008.
- Unisys Corporation reported first quarter 2007 financial results and continued progress in its multi-year repositioning program, with net income of $3.6 million compared to a net loss of $27.9 million in first quarter 2006.
- The company took restructuring charges of $32.7 million in the first quarter of 2007 to reduce headcount by about 950 employees as part of ongoing cost reduction efforts, and plans an additional $35 million charge in second quarter 2007 related to further facility consolidations and workforce reductions.
- Revenue for the quarter decreased 3% to $1.35 billion from $1.39 billion in first quarter 2006, with services orders showing a double-digit decrease though
- TRW reported financial results for the 4th quarter and full year of 2008. 4th quarter sales were $2.8 billion, down 28% from the previous year, and full year sales were $15 billion, up 2%.
- The company reported a 4th quarter net loss of $946 million and a full year net loss of $779 million due to asset impairments and restructuring charges. Excluding special items, the 4th quarter net loss was $74 million and full year net earnings were $153 million.
- Cash flow from operations was $769 million for the 4th quarter and $773 million for the full year. Free cash flow was $625 million and $291 million respectively.
Pitney Bowes reported third quarter 2008 results with revenue increasing 3% to $1.5 billion and adjusted income from continuing operations of $139 million. On a GAAP basis, income from continuing operations was $100 million and net income was $98 million. Adjusted earnings per share were $0.67 compared to $0.63 in the prior year. For the full year, the company expects free cash flow to exceed $800 million and adjusted earnings per share between $2.75 to $2.82.
Google announced its financial results for the first quarter of 2009. While revenues were down slightly from the previous quarter, they grew 6% over the first quarter of 2008. Operating income was $1.88 billion, or 34% of revenues. Net income was $1.42 billion, with earnings per share of $4.49. The company continued to see strong growth in paid clicks and remains focused on long-term investments.
TRW reported its financial results for the 4th quarter and full year of 2007. Key highlights include:
- Record sales of $14.7 billion for the full year, an increase of 11.9% over 2006.
- 4th quarter sales were $3.9 billion, an increase of 18.8% over the same period in 2006.
- Net earnings for the full year were $90 million, or $0.88 per share. Excluding one-time items, earnings were $2.28 per share.
- Guidance for 2008 expects sales between $15.6-16 billion and earnings per share between $2.15-2.45.
Data Domain, Inc. Reports Fourth Quarter Financial Resultsearningsreport
1) Data Domain reported financial results for the fourth quarter of 2008 with revenue increasing 14% over Q3 2008 and 90% over Q4 2007. Revenue for 2008 increased 122% over 2007.
2) Net income for Q4 2008 was $13.9 million positively impacted by a $13.2 million tax benefit, without this benefit net income would have been $749,000.
3) For Q1 2009, Data Domain estimates revenue between $79-84 million and GAAP net income per share between $(0.01)-$0.01 and non-GAAP between $0.04-$0.07.
Pitney Bowes reported their fourth quarter and annual financial results for 2008. Their adjusted earnings per share increased 8% for the quarter and 2% for the full year. On a GAAP basis, they reported earnings per share of $0.36 for the quarter and $2.00 for the full year. For 2009, they expect revenue to decline 4-7% due to currency impacts, and for adjusted earnings per share to be in the range of $2.55 to $2.75.
Pitney Bowes reported its fourth quarter and annual financial results for 2008. Adjusted earnings per share increased 8% for the quarter and 2% for the full year. Revenue declined 7% for the quarter due to currency fluctuations but increased 2% for the full year. The company expects revenue to decline 4-7% in 2009 due to currency impacts but for adjusted earnings per share to grow in the mid-single digit range compared to 2008.
Pitney Bowes reported their fourth quarter and annual financial results for 2008. Their adjusted earnings per share increased 8% for the quarter and 2% for the full year. On a GAAP basis, they reported earnings per share of $0.36 for the quarter and $2.00 for the full year. For 2009, they expect revenue to decline 4-7% due to currency impacts, and for adjusted earnings per share to be in the range of $2.55 to $2.75.
- AES reported strong third quarter results in 2008, with earnings per share up 57% and adjusted earnings per share up 47% compared to third quarter 2007. Cash flow also increased, with consolidated free cash flow up 9%.
- For full year 2008, AES reaffirmed its operating cash flow and free cash flow guidance but lowered adjusted earnings per share guidance to reflect foreign currency losses. Guidance for 2009 was also lowered primarily due to changes in foreign exchange rate assumptions.
- AES continues to strengthen its financial position and expects that debt maturities in 2009-2010 will be met by existing cash flows. The company is well positioned to weather current market conditions.
bristol myerd squibb Bristol-Myers Squibb Company Reports Second Quarter 2008...finance13
Bristol-Myers Squibb reports strong financial performance in Q2 2008 with 16% growth in global net sales and 24% increase in pre-tax earnings. They reaffirmed 2008 EPS guidance and announced plans to achieve an additional $1 billion in productivity savings by 2012. Key drivers of growth were double-digit sales increases of drugs such as Plavix, Abilify, and the HIV/Hepatitis portfolio. Bristol-Myers Squibb also submitted regulatory filings for the diabetes drug Onglyza in the US and Europe.
Ameriprise Financial reported second quarter 2008 results, with net income increasing 7% year-over-year to $210 million. Earnings per share increased 15% to $0.93. Excluding realized losses and prior year separation costs, earnings per share increased 3% to $1.01. Total revenues declined 8% to $2.0 billion due to market depreciation. The company maintained a strong capital position and increased its quarterly dividend by 13%.
- AsiaInfo reported financial results for the third quarter of 2008, with total revenue increasing 38.4% year-over-year to $44.8 million, exceeding guidance.
- Net income increased 68.9% year-over-year to $5.3 million, with operating margins expanding.
- Revenue growth was driven by strong performance in software and service solutions for telecom customers like China Telecom and China Mobile.
Citibanking North America reported a 14% increase in total revenues and a 92% increase in core income for Q1 2000 compared to Q1 1999. Key drivers included an 86% increase in core income before taxes due to higher non-interest revenue and lower loan loss provisions. Average loans declined 5% while average deposits grew 5%. Asset quality improved with delinquencies and net credit losses declining.
Citigroup reported record earnings for the first quarter of 2000, with core income rising 49% to $3.6 billion compared to the same period last year. Several of Citigroup's business lines saw double-digit earnings growth, including Global Consumer (up 23%), Global Corporate and Investment Bank (up 36%), and Global Investment Management (up 26%). Strong performance across all regions and business segments was driven by favorable global market conditions. Return on equity was 30% and the company repurchased $1.2 billion in stock during the quarter.
Citigroup reported financial results for the second quarter of 2000. Core income increased 21% compared to the second quarter of 1999 to $3.007 billion. Total revenues for the quarter were $16.373 billion, a 10% increase year-over-year. Most of Citigroup's business segments saw revenue and core income growth compared to the previous year. Global Consumer revenues were $7.473 billion, up 6% from the second quarter of 1999. Global Corporate and Investment Bank revenues were $7.855 billion, a 13% increase. Citigroup's preliminary Tier 1 capital ratio was 8.6% for the second quarter of 2000.
This document provides quarterly financial data for Citigroup, including:
- Consolidated financial summaries showing metrics like core income, net income, earnings per share, capital ratios, assets, and returns on equity.
- Segment net revenues and core income broken down by Citigroup's main business segments - Global Consumer, Global Corporate and Investment Bank, and Global Investment Management.
- More detailed financial results for the major businesses within Global Consumer like North America Cards, Mortgage Banking, and International.
- Supplemental financial details including consolidated statements of income, earnings analysis, loan delinquency amounts, and insurance investment portfolio information.
The document contains quarterly and year-to-
Citigroup reported strong financial results for the second quarter and first half of 2000. Core income rose 21% to $3.0 billion for the second quarter and 35% to $6.6 billion for the first half of the year. All of Citigroup's major business segments experienced double-digit income growth, led by the Global Consumer Group and Global Corporate and Investment Bank. Citigroup continued making acquisitions and investments to expand its global businesses and presence on the internet. Chairman and CEO Sanford Weill stated the results demonstrated the impact of the company's market share gains and consistent growth across its businesses.
Citigroup reported its third quarter 2000 financial results. Key highlights include:
- Core income for 3Q 2000 was $3.11 billion, up 27% from 3Q 1999. Year-to-date core income through 3Q 2000 was $9.72 billion, up 32% from the same period in 1999.
- Net income for 3Q 2000 was $3.088 billion, up 27% from 3Q 1999. Year-to-date net income through 3Q 2000 was $9.683 billion, up 34% from the same period in 1999.
- Basic earnings per share for core income in 3Q 2000 was $0.69, up 28% from 3Q 1999.
- Citigroup reported quarterly financial results for 3Q 2000, with net income of $3.088 billion, up 27% from 3Q 1999. Core income was $3.111 billion for the quarter, also up 27% year-over-year.
- Total revenues for Citigroup's Global Consumer segment were $7.515 billion in 3Q 2000, up 5% from 3Q 1999. The Global Corporate and Investment Bank segment reported revenues of $8.097 billion, a 26% increase.
- Total assets reached $805 billion in 3Q 2000, up from $686.8 billion in 3Q 1999. Book value per share increased to $11.55 from $9
Citigroup reported strong third quarter results for 2000, with core income rising 27% to $3.1 billion compared to the third quarter of 1999. Key highlights included:
- Global Consumer core income rose 17% to $1.32 billion, driven by growth in North American cards, mortgage banking, and Asia.
- Global Corporate and Investment Bank core income increased 40% to $1.59 billion, with strong performances from Salomon Smith Barney and emerging markets banking.
- Global Investment Management and Private Banking core income grew 14% to $176 million, with increased revenues across asset management, private banking, and retirement services.
Citigroup reported its quarterly financial results. Some key highlights:
- Core income for Q4 2000 was $3.331 billion, up 11% from Q4 1999.
- Net income for Q4 2000 was $2.84 billion, down 6% from Q4 1999 due to restructuring charges.
- Global Consumer segment revenues grew 9% to $10.243 billion in Q4 2000.
- Global Corporates and Institutions segment revenues grew 16% to $8.464 billion in Q4 2000.
Citigroup reported strong 4th quarter and full-year 2000 earnings. 4th quarter core income was $3.33 billion, an 11% increase, and full-year core income was a record $14.14 billion, up 25%. All of Citigroup's major business segments saw growth in the 4th quarter, led by the Global Consumer Group at 25% growth. For the full year, net income was $13.52 billion. Chairman and CEO Sanford Weill cited the company's global strength and leadership across business lines. Citigroup continued investments in growing markets and internet capabilities.
Citigroup reported its financial results for the first quarter of 2001. Net income decreased 8% compared to the first quarter of 2000. Core income, which excludes restructuring and accounting items, decreased 7%. Within its Global Consumer segment, Banking/Lending revenues increased 14% driven by growth in North America Cards, CitiFinancial, and Mortgage Banking. Core income for Banking/Lending increased 21% led by gains in North America Cards, CitiFinancial, and Citibanking North America. Overall, Citigroup's Global Consumer business saw revenues increase 10% and core income rise 18% compared to the first quarter of the prior year.
Citigroup reported core income of $3.66 billion for Q1 2001, a 7% decrease from Q1 2000. Excluding investment activities, core income rose 7% year-over-year. Global Consumer saw core income increase 18% to $1.78 billion driven by growth in US banking and lending. Global Corporate core income declined 7% to $1.75 billion due to weaker investment markets, though revenues grew 11%. Overall, Citigroup achieved solid results despite challenging markets due to the strength and diversity of its businesses.
Citigroup, the largest global financial services company, reported quarterly financial results. Core income decreased 7% year-over-year to $3.66 billion, while net income decreased 8% to $3.54 billion. Revenues increased 6% to $21.05 billion driven by strong growth in North America Cards, Corporate Finance, and emerging markets. Citibanking North America revenues increased 6% to $613 million with core income before taxes up 24% to $271 million.
Citigroup reported its financial results for the first quarter of 2001. Net income decreased 8% compared to the first quarter of 2000. Core income, which excludes restructuring and accounting items, decreased 7%. Within Global Consumer, Banking/Lending revenues increased 14% driven by growth in North America Cards, CitiFinancial, and Mortgage Banking. Core income for Banking/Lending increased 21% led by gains in North America Cards, CitiFinancial, and Citibanking North America.
Citigroup reported a 13% increase in core income to $3.79 billion for Q2 2001 compared to Q2 2000. Revenue grew 8% to $20.3 billion led by 12% growth in the Global Consumer segment. Core EPS grew 14% to $0.74 per share. Several business segments saw strong growth including 40% growth for CitiFinancial, 17% for North America Cards, and 18% for the Private Bank. Despite difficult market conditions, Corporate Finance delivered 12% earnings growth through increased market share.
Citigroup reported quarterly financial data for 3Q 2001. Some key highlights:
- Core income was $3.262 billion for 3Q 2001, down 8% from 3Q 2000. Year-to-date core income was $10.707 billion, down 1% from the same period in 2000.
- Total revenues for 3Q 2001 were $20.294 billion, up 5% from 3Q 2000. Year-to-date total revenues were $61.656 billion, up 6% from the same period in 2000.
- Global Consumer revenues grew 19% to $11.661 billion in 3Q 2001, driven by strength in North America Cards and Banking/L
Citigroup reported financial results for the third quarter of 2001. Citigroup is a global financial services company with operations in over 100 countries. Some key highlights:
- Core income for 3Q 2001 was $3.26 billion, down 8% from 3Q 2000. Year-to-date core income was $10.7 billion, down 1% from the same period in 2000.
- Total revenues for Global Consumer operations were $11.66 billion for 3Q 2001, up 19% from 3Q 2000, driven by growth in North America Cards and Mortgage Banking.
- Revenues for Global Corporate were $8.01 billion for 3Q 2001, down 5% from 3
Citigroup reported third quarter core income of $3.26 billion, down 7% from the prior year due to $700 million in losses from the September 11th attacks. Revenue grew 5% to $20.29 billion while expenses declined 2%. The diversification of Citigroup's businesses allowed growth in many areas, including a 45% increase in CitiFinancial income and a 25% rise in Citibanking income, despite challenges in the market environment from the attacks. Sanford Weill, CEO, expressed confidence that Citigroup would deliver 15% earnings growth in the fourth quarter assuming a stable market.
Citigroup reported its quarterly financial results. Net income for 4Q 2001 was $3.875 billion, up 36% from 4Q 2000. Core income, which excludes certain items, was $3.862 billion for 4Q 2001, up 16% from the prior year. Total revenues for Global Consumer increased 20% to $11.207 billion compared to 4Q 2000, driven by growth in North America Cards, Citibanking North America, and Mortgage Banking. Revenues for Global Corporate were relatively flat compared to the prior year.
Citigroup reported quarterly financial results. Global core income was $3.859 billion for Q1 2002, up 5% from Q1 2001. By segment, global consumer core income grew 20% to $1.812 billion, while global corporate and investment banking core income fell 13% to $1.286 billion. On a regional basis, core income from North America grew 20% to $2.479 billion, while core income from Western Europe fell 41% to $171 million.
The report *State of D2C in India: A Logistics Update* talks about the evolving dynamics of the d2C landscape with a particular focus on how brands navigate the complexities of logistics. Third Party Logistics enablers emerge indispensable partners in facilitating the growth journey of D2C brands, offering cost-effective solutions tailored to their specific needs. As D2C brands continue to expand, they encounter heightened operational complexities with logistics standing out as a significant challenge. Logistics not only represents a substantial cost component for the brands but also directly influences the customer experience. Establishing efficient logistics operations while keeping costs low is therefore a crucial objective for brands. The report highlights how 3PLs are meeting the rising demands of D2C brands, supporting their expansion both online and offline, and paving the way for sustainable, scalable growth in this fast-paced market.
Best Competitive Marble Pricing in Dubai - ☎ 9928909666Stone Art Hub
Stone Art Hub offers the best competitive Marble Pricing in Dubai, ensuring affordability without compromising quality. With a wide range of exquisite marble options to choose from, you can enhance your spaces with elegance and sophistication. For inquiries or orders, contact us at ☎ 9928909666. Experience luxury at unbeatable prices.
Enhancing Adoption of AI in Agri-food: IntroductionCor Verdouw
Introduction to the Panel on: Pathways and Challenges: AI-Driven Technology in Agri-Food, AI4Food, University of Guelph
“Enhancing Adoption of AI in Agri-food: a Path Forward”, 18 June 2024
Tired of chasing down expiring contracts and drowning in paperwork? Mastering contract management can significantly enhance your business efficiency and productivity. This guide unveils expert secrets to streamline your contract management process. Learn how to save time, minimize risk, and achieve effortless contract management.
NIMA2024 | De toegevoegde waarde van DEI en ESG in campagnes | Nathalie Lam |...BBPMedia1
Nathalie zal delen hoe DEI en ESG een fundamentele rol kunnen spelen in je merkstrategie en je de juiste aansluiting kan creëren met je doelgroep. Door middel van voorbeelden en simpele handvatten toont ze hoe dit in jouw organisatie toegepast kan worden.
High-Quality IPTV Monthly Subscription for $15advik4387
Experience high-quality entertainment with our IPTV monthly subscription for just $15. Access a vast array of live TV channels, movies, and on-demand shows with crystal-clear streaming. Our reliable service ensures smooth, uninterrupted viewing at an unbeatable price. Perfect for those seeking premium content without breaking the bank. Start streaming today!
https://rb.gy/f409dk
Prescriptive analytics BA4206 Anna University PPTFreelance
Business analysis - Prescriptive analytics Introduction to Prescriptive analytics
Prescriptive Modeling
Non Linear Optimization
Demonstrating Business Performance Improvement
SATTA MATKA DPBOSS KALYAN MATKA RESULTS KALYAN CHART KALYAN MATKA MATKA RESULT KALYAN MATKA TIPS SATTA MATKA MATKA COM MATKA PANA JODI TODAY BATTA SATKA MATKA PATTI JODI NUMBER MATKA RESULTS MATKA CHART MATKA JODI SATTA COM INDIA SATTA MATKA MATKA TIPS MATKA WAPKA ALL MATKA RESULT LIVE ONLINE MATKA RESULT KALYAN MATKA RESULT DPBOSS MATKA 143 MAIN MATKA KALYAN MATKA RESULTS KALYAN CHART
Adani Group's Active Interest In Increasing Its Presence in the Cement Manufa...Adani case
Time and again, the business group has taken up new business ventures, each of which has allowed it to expand its horizons further and reach new heights. Even amidst the Adani CBI Investigation, the firm has always focused on improving its cement business.
AI Transformation Playbook: Thinking AI-First for Your BusinessArijit Dutta
I dive into how businesses can stay competitive by integrating AI into their core processes. From identifying the right approach to building collaborative teams and recognizing common pitfalls, this guide has got you covered. AI transformation is a journey, and this playbook is here to help you navigate it successfully.
Ellen Burstyn: From Detroit Dreamer to Hollywood Legend | CIO Women MagazineCIOWomenMagazine
In this article, we will dive into the extraordinary life of Ellen Burstyn, where the curtains rise on a story that's far more attractive than any script.
SATTA MATKA DPBOSS KALYAN MATKA RESULTS KALYAN CHART KALYAN MATKA MATKA RESULT KALYAN MATKA TIPS SATTA MATKA MATKA COM MATKA PANA JODI TODAY BATTA SATKA MATKA PATTI JODI NUMBER MATKA RESULTS MATKA CHART MATKA JODI SATTA COM INDIA SATTA MATKA MATKA TIPS MATKA WAPKA ALL MATKA RESULT LIVE ONLINE MATKA RESULT KALYAN MATKA RESULT DPBOSS MATKA 143 MAIN MATKA KALYAN MATKA RESULTS KALYAN CHART
Satta Matka Dpboss Kalyan Matka Results Kalyan Chart
Read the Earnings Release
1. FOR IMMEDIATE RELEASE
Yahoo! Reports Third Quarter 2008 Financial Results
Revenues - $1,786 Million
Operating Income - $70 Million
Operating Income Before Depreciation, Amortization, and Stock-Based
Compensation Expense - $410 Million
SUNNYVALE, Calif. – October 21, 2008 - Yahoo! Inc. (Nasdaq: YHOO) today reported results for the third
quarter ended September 30, 2008.
quot;As economic conditions and on-line advertising softened in the third quarter, we remained highly focused on
our 2008 strategy to invest in initiatives that enhance not only our long term competitiveness, but also our
ability to deliver for users and advertisers in this more difficult climate. We have been disciplined about
balancing investments with cost management all year, and have now set in motion initiatives to reduce costs
and enhance productivity,quot; said Jerry Yang, co-founder and chief executive officer, Yahoo! Inc. quot;The steps
we are taking this quarter should deliver not only near-term benefits to operating cash flow, but should also
substantially enhance the nimbleness and flexibility with which we compete over the long term. We enter this
slowing market with competitive advantages as the destination of choice for consumers and a leader in
providing online advertisers with the broadest set of advertising management tools and products in the
industry. We plan to continue building on those strengths.quot;
Third Quarter 2008 Financial Results
• Revenues were $1,786 million for the third quarter of 2008, a 1 percent increase compared to $1,768
million for the same period of 2007.
• Marketing services revenues were $1,563 million for the third quarter of 2008, a 1 percent increase
compared to $1,544 million for the same period of 2007.
o Marketing services revenues from Owned and Operated sites were $1,002 million for the third
quarter of 2008, a 9 percent increase compared to $923 million for the same period of 2007.
o Marketing services revenues from Affiliate sites were $561 million for the third quarter of 2008, a
10 percent decrease compared to $621 million for the same period of 2007.
• Fees revenues were $224 million for the third quarter of 2008, compared to $224 million for the same
period of 2007.
• Revenues excluding traffic acquisition costs (“TAC”) were $1,325 million for the third quarter of 2008, a 3
percent increase compared to $1,283 million for the same period of 2007.
• Operating income for the third quarter of 2008 was $70 million, a 53 percent decrease compared to $150
million for the same period of 2007.
o Operating income for the third quarter of 2008 includes incremental costs of $37 million incurred
for outside advisors related to Microsoft’s proposals to acquire all or a part of the Company,
other strategic alternatives, including the Google agreement, the proxy contest, and related
litigation defense (collectively, the “strategic alternatives and related matters”).
• Operating income before depreciation, amortization, and stock-based compensation expense for the
third quarter of 2008 was $410 million, a 12 percent decrease compared to $466 million for the same
period of 2007.
o Operating income before depreciation, amortization, and stock-based compensation expense for
the third quarter of 2008 includes the incremental costs related to the strategic alternatives and
related matters noted above.
• Cash flow from operating activities for the third quarter of 2008 was $347 million, a 24 percent decrease
compared to $457 million for the same period of 2007.
• Free cash flow for the third quarter of 2008 was $215 million, a 31 percent decrease compared to $310
million for the same period of 2007.
2. • Net income for the third quarter of 2008 was $54 million or $0.04 per diluted share compared to $151
million or $0.11 per diluted share for the same period of 2007.
• Non-GAAP net income for the third quarter of 2008 was $123 million or $0.09 per diluted share
compared to non-GAAP net income of $153 million or $0.11 per diluted share for the same period of
2007.
quot;Despite a tougher revenue climate, we were able to stay focused on our strategic objectives, launching
several major product initiatives that have been underway for many months,” said Sue Decker, president,
Yahoo!, Inc. “These include the beta release of our new home page, which will leverage one code base
globally; our new universal profile management tool at profiles.yahoo.com which is the first step toward
rewiring the social graph on Yahoo!; and the launch of APT from Yahoo!TM, a transformative digital
advertising platform. We delivered on our product roadmap with high quality and lower expenses than
originally anticipated. Now we are conducting a deep review of our cost structure to identify more
opportunities to enhance efficiency and build a stronger and more profitable Yahoo!.quot;
Third Quarter 2008 Segment Financial Results
• United States segment revenues for the third quarter of 2008 were $1,280 million, a 7 percent increase
compared to $1,195 million for the same period of 2007.
• International segment revenues for the third quarter of 2008 were $507 million, a 12 percent decrease
compared to $573 million for the same period of 2007.
• United States segment operating income before depreciation, amortization, and stock-based compensation
expense for the third quarter of 2008 was $291 million, a 14 percent decrease compared to $338 million for
the same period of 2007.
o United States segment operating income before depreciation, amortization, and stock-based
compensation expense for the third quarter of 2008 includes the incremental costs related to the
strategic alternatives and related matters noted above.
• International segment operating income before depreciation, amortization, and stock-based compensation
expense for the third quarter of 2008 was $119 million, a 7 percent decrease compared to $128 million for
the same period of 2007.
“An increasingly challenging economic climate and softening advertising demand contributed to revenues
this quarter coming in at the low end of our outlook range. While we are disappointed with our results, we’re
pleased that we continue to benefit from the aggressive cost management efforts we have pursued during
the year. These efforts helped our adjusted operating cash flow come in above the midpoint of our outlook
range for the quarter, despite significant investments in our strategic objectives,” said Blake Jorgensen, chief
financial officer, Yahoo! Inc. “We have the balance sheet strength, liquidity, and free cash flow we need to
continue to make progress on our core strategies as we address this slowdown.”
Cash Flow Information
In addition to free cash flow of $215 million for the third quarter of 2008, Yahoo! generated $14 million from
the issuance of common stock as a result of the exercise of employee stock options. This was offset by $29
million used for acquisitions and $16 million used to acquire intellectual property rights. Cash, cash
equivalents, and investments in marketable debt securities were $3,299 million at September 30, 2008 as
compared to $3,219 million at June 30, 2008, an increase of $80 million.
Cost Reduction Initiatives
During the third quarter, Yahoo! began implementing a series of cost reduction initiatives that contributed to
the Company's adjusted operating cash flow exceeding the midpoint of its outlook for the quarter. The
Company's goal is to reduce its current annualized cost run rate of approximately $3.9 billion by more than
$400 million before the end of 2008. The Company anticipates that both headcount and non-headcount-
related costs will be reduced by these actions. Because the majority of expenses are headcount-related,
Yahoo! expects to reduce its global workforce by at least 10 percent during the fourth quarter of 2008.
3. Yahoo! also plans to implement additional cost-cutting measures aimed at achieving additional structural
efficiencies over the next year. The Company anticipates these will result in substantial additional cost
savings. The goal of these measures is to position Yahoo! for long-term, sustainable growth.
Non-GAAP Financial Measures
Explanations of the Company’s non-GAAP financial measures and the related reconciliations to the GAAP
financial measures the Company considers most comparable are included in the accompanying “Note to
Unaudited Condensed Consolidated Statements of Income,” “Reconciliations to Unaudited Condensed
Consolidated Statements of Income,” and “Reconciliation of GAAP Net Income and GAAP Net Income Per
Share to Non-GAAP Net Income and Non-GAAP Net Income Per Share.”
Quarterly Conference Call
Yahoo! will host a conference call to discuss third quarter results at 5:00 p.m. Eastern Time today. A live
webcast of the conference call, together with supplemental financial information, can be accessed through
the Company's Investor Relations website at http://yhoo.client.shareholder.com/results.cfm. In addition, an
archive of the webcast can be accessed through the same link. An audio replay of the call will be available
for one week following the conference call by calling (888) 286-8010 or (617) 801-6888, reservation number:
99117465.
4. About Yahoo!
Yahoo! Inc. (“Yahoo!” or the “Company”) is a leading global Internet brand and one of the most trafficked
Internet destinations worldwide. Yahoo! is focused on powering its communities of users, advertisers,
publishers, and developers by creating indispensable experiences built on trust. Yahoo! is headquartered in
Sunnyvale, California. For more information, visit pressroom.yahoo.com or the Company’s blog, Yodel
Anecdotal.
Owned and Operated sites refer to Yahoo!’s owned and operated online properties and services.
Affiliate sites refer to Yahoo!'s distribution network of third-party entities who have integrated Yahoo!'s
advertising offerings into their websites or their other offerings.
This press release and its attachments include the following financial measures defined as non-GAAP
financial measures by the Securities and Exchange Commission (“SEC”): revenues excluding traffic
acquisition costs or TAC; operating income before depreciation, amortization, and stock-based
compensation expense (also referred to as operating cash flow); free cash flow; and non-GAAP net income
and non-GAAP net income per share. These measures may be different from non-GAAP financial measures
used by other companies. The presentation of this financial information is not intended to be considered in
isolation or as a substitute for the financial information prepared and presented in accordance with generally
accepted accounting principles (“GAAP”). See “Note to Unaudited Condensed Consolidated Statements of
Income,” “Reconciliations to Unaudited Condensed Consolidated Statements of Income,” and “Reconciliation
of GAAP Net Income and GAAP Net Income Per Share to Non-GAAP Net Income and Non-GAAP Net
Income Per Share” included in this press release for further information regarding these non-GAAP financial
measures.
This press release and its attachments contain forward-looking statements that involve risks and
uncertainties concerning Yahoo!'s expected financial performance (including without limitation the statements
and information in the Business Outlook section and the quotations from management in this press release),
as well as Yahoo!'s strategic and operational plans. Actual results may differ materially from the results
predicted and reported results should not be considered as an indication of future performance. The potential
risks and uncertainties include, among others, the expected benefits of the commercial agreement with
Google may not be realized, including as a result of actions taken by United States or foreign regulatory
authorities and the response or acceptance of the agreement by publishers, advertisers, users, and
employees; the implementation and results of Yahoo!'s ongoing strategic initiatives; the impact of
organizational changes; Yahoo!'s ability to compete with new or existing competitors; reduction in spending
by, or loss of, marketing services customers; the demand by customers for Yahoo!'s premium services;
acceptance by users of new products and services; risks related to joint ventures and the integration of
acquisitions; risks related to Yahoo!'s international operations; failure to manage growth and diversification;
adverse results in litigation, including intellectual property infringement claims; Yahoo!'s ability to protect its
intellectual property and the value of its brands; dependence on key personnel; dependence on third parties
for technology, services, content, and distribution; general economic conditions and changes in economic
conditions; the possibility that Microsoft or another person may in the future make proposals to acquire all or
a part of Yahoo!, or take other actions which may create uncertainty for our employees, publishers,
advertisers, and other business partners; and the possibility of significant costs of defense, indemnification,
and liability resulting from stockholder litigation relating to such proposals. All information set forth in this
press release and its attachments is as of October 21, 2008. Yahoo! does not intend, and undertakes no
duty, to update this information to reflect future events or circumstances. More information about potential
factors that could affect the Company's business and financial results is included under the captions quot;Risk
Factorsquot; and quot;Management's Discussion and Analysis of Financial Condition and Results of Operationsquot; in
the Company's Annual Report on Form 10-K for the year ended December 31, 2007, as amended, and the
Quarterly Report on Form 10-Q for the quarter ended June 30, 2008, which are on file with the SEC and
available at the SEC's website at www.sec.gov. Additional information will also be set forth in those sections
in Yahoo!’s Quarterly Report on Form 10-Q for the quarter ended September 30, 2008, which will be filed
with the SEC in the fourth quarter of 2008.
###
5. Yahoo! and the Yahoo! logos are trademarks and/or registered trademarks of Yahoo! Inc. All other names
are trademarks and/or registered trademarks of their respective owners.
Media Relations Contacts:
Brad Williams, Yahoo! Inc., (408) 349-7069, bhw@yahoo-inc.com
Kim Rubey, Yahoo! Inc., (408) 349-8910, krubey@yahoo-inc.com
Investor Relations Contact:
Cathy La Rocca, Yahoo! Inc., (408) 349-5188, cathy@yahoo-inc.com
6. Yahoo! Inc.
Unaudited Condensed Consolidated Statements of Income
(in thousands, except per share amounts)
Three Months Ended Nine Months Ended
September 30, September 30,
2007 2008 2007 2008
Revenues $ 1,767,506 $ 1,786,426 $ 5,137,276 $ 5,402,113
Cost of revenues 740,200 772,277 2,136,849 2,293,271
Gross profit 1,027,306 1,014,149 3,000,427 3,108,842
Operating expenses:
Sales and marketing 410,936 396,982 1,168,785 1,226,472
Product development 274,682 323,172 795,268 943,497
General and administrative 161,511 199,593 449,934 559,484
Amortization of intangibles 29,985 24,228 82,264 71,192
Strategic workforce realignment costs, net - - - 16,885
Total operating expenses 877,114 943,975 2,496,251 2,817,530
Income from operations 150,192 70,174 504,176 291,312
Other income, net 43,748 8,881 109,935 57,217
Income before income taxes, earnings in equity interests, 193,940 79,055 614,111 348,529
and minority interests
Provision for income taxes (78,653) (50,577) (258,743) (155,243)
Earnings in equity interests (1) 36,546 27,762 97,801 537,471
Minority interests in operations of consolidated subsidiaries (547) (1,892) 1,108 (3,031)
Net income $ 151,286 $ 54,348 $ 454,277 $ 727,726
Net income per share - diluted (2) $ 0.11 $ 0.04 $ 0.32 $ 0.51
Shares used in per share calculation - diluted 1,395,056 1,397,573 1,403,756 1,396,404
Stock-based compensation expense was allocated as follows:
Cost of revenues $ 2,555 $ 4,283 $ 6,919 $ 11,112
Sales and marketing 70,353 51,060 172,731 172,904
Product development 51,603 55,372 164,354 149,896
General and administrative 21,029 21,884 70,321 59,144
Strategic workforce realignment expense reversals - - - (12,284)
Total stock-based compensation expense $ 145,540 $ 132,599 $ 414,325 $ 380,772
Supplemental Financial Data (See Note)
Revenues excluding TAC $ 1,282,601 $ 1,325,312 $ 3,709,443 $ 4,023,339
Operating income before depreciation, amortization, and stock-based compensation
expense (or operating cash flow) $ 466,309 $ 410,378 $ 1,399,973 $ 1,270,557
Free cash flow (3) $ 309,562 $ 215,344 $ 1,006,505 $ 1,092,855
Non-GAAP net income per share - diluted $ 0.11 $ 0.09 $ 0.33 $ 0.30
(1) The nine months ended September 30, 2008 includes Yahoo!'s non-cash gain of $401 million recorded in the first quarter of 2008 related to Alibaba Group's initial
public offering of Alibaba.com, net of tax. The three and nine months ended September 30, 2008 also includes Yahoo!'s non-cash loss of $30 million recorded in the
third quarter of 2008 related to the impairment of our direct investment in Alibaba.com, net of tax.
(2) The impact of outstanding stock awards of entities in which the Company holds equity interests that are accounted for using the equity method reduced the
Company's diluted earnings per share by $0.01 for the nine months ended September 30, 2008.
(3) The nine months ended September 30, 2008 includes a $350 million one-time payment from AT&T Inc. recorded in the first quarter of 2008.
7. Yahoo! Inc.
Note to Unaudited Condensed Consolidated Statements of Income
This press release and its attachments include the non-GAAP financial measures of revenues excluding traffic acquisition costs or TAC, operating income
before depreciation, amortization, and stock-based compensation expense, free cash flow, non-GAAP net income, and non-GAAP net income per share,
which are reconciled to GAAP revenue, income from operations, cash flow from operating activities, net income, and net income per share, respectively,
which we believe are the most comparable GAAP measures. We use these non-GAAP financial measures for internal managerial purposes, when publicly
providing our business outlook, and to facilitate period-to-period comparisons. We describe limitations specific to each non-GAAP financial measure
below. Management generally compensates for limitations in the use of non-GAAP financial measures by relying on comparable GAAP financial
measures and providing investors with a reconciliation of the non-GAAP financial measure to the most directly comparable GAAP financial measure or
measures. Further, management uses non-GAAP financial measures only in addition to and in conjunction with results presented in accordance with
GAAP. We believe that these non-GAAP financial measures reflect an additional way of viewing aspects of our operations that, when viewed with our
GAAP results, provide a more complete understanding of factors and trends affecting our business. These non-GAAP measures should be considered as a
supplement to, and not as a substitute for, or superior to, GAAP revenue, income from operations, cash flow from operating activities, net income, and net
income per share calculated in accordance with GAAP.
Revenues excluding TAC is defined as GAAP revenue less TAC. TAC consists of payments made to Affiliate sites and payments made to companies that
direct consumer and business traffic to the Yahoo! website. We present revenues excluding TAC: (1) to provide a metric for our investors to analyze and
value our Company and (2) to provide investors one of the primary metrics used by the Company for evaluation and decision-making purposes. We
provide revenues excluding TAC because we believe it is useful to investors in valuing our Company. One of the ways investors value companies is to
apply a multiple to revenues. Since a significant portion of the GAAP revenues associated with our sponsored search offerings is paid to our Affiliate
sites, we believe investors find it more meaningful to apply multiples to revenues excluding TAC to assess our value as this avoids “double counting”
revenues that are paid to, and being reported by, our Affiliate sites. Further, management uses revenues excluding TAC for evaluating the performance of
our business, making operating decisions, budgeting purposes, and as a factor in determining management compensation. A limitation of revenues
excluding TAC is that it is a measure which we have defined for internal and investor purposes that may be unique to the Company, and therefore it may
not enhance the comparability of our results to other companies in our industry who have similar business arrangements but address the impact of TAC
differently. Management compensates for these limitations by also relying on the comparable GAAP financial measures of revenues, cost of revenues,
and gross profit, each of which includes the impact of TAC.
Operating income before depreciation, amortization, and stock-based compensation expense (also referred to as operating cash flow) is defined as income
from operations before depreciation, amortization of intangible assets, and stock-based compensation expense (including the compensation of Terry
Semel, who served as our chief executive officer through June 18, 2007 and whose compensation after June 1, 2006 consisted almost entirely of stock-
based compensation). We consider this measure to be an important indicator of the operational strength of the Company. We exclude depreciation and
amortization because while tangible and intangible assets support our businesses, we do not believe the related depreciation and amortization costs are
directly attributable to the operating performance of our business. This measure is used by some investors when assessing the performance of our
Company. In addition, because of the variety of equity awards used by companies, the varying methodologies for determining stock-based compensation
expense, and the subjective assumptions involved in those determinations, we believe excluding stock-based compensation enhances the ability of
management and investors to understand the impact of stock-based compensation expense on our operating income. We do not include depreciation,
amortization, and stock-based compensation expense in our internal measures or in the measures used by the Company to formulate our business outlook
presented with our quarterly financial information to investors. A limitation associated with the non-GAAP measure of operating income before
depreciation, amortization, and stock-based compensation expense is that it does not reflect the periodic costs of certain capitalized tangible and intangible
assets used in generating revenues in our businesses. Management evaluates the costs of such tangible and intangible assets through other financial
measures such as capital expenditures. A further limitation associated with this measure is that it does not include stock-based compensation expense
related to the Company’s workforce. Management compensates for these limitations by also relying on the comparable GAAP financial measure of
income from operations, which includes depreciation, amortization, and stock-based compensation expense.
Free cash flow is a non-GAAP financial measure defined as cash flow from operating activities (adjusted to include excess tax benefits from stock-based
compensation), less net capital expenditures and dividends received. We consider free cash flow to be a liquidity measure which provides useful
information to management and investors about the amount of cash generated by the business after the acquisition of property and equipment, which can
then be used for strategic opportunities including, among others, investing in the Company's business, making strategic acquisitions, strengthening the
balance sheet, and repurchasing stock. A limitation of free cash flow is that it does not represent the total increase or decrease in the cash balance for the
period. Management compensates for this limitation by also relying on the net change in cash and cash equivalents as presented in the Company’s
unaudited condensed consolidated statements of cash flows prepared in accordance with GAAP which incorporates all cash movements during the period.
Non-GAAP net income is defined as net income excluding certain gains, losses, expenses, and their related tax effects that we do not believe are indicative
of our ongoing operating results. Previously, in reporting results for 2006 and 2007, for comparative purposes, stock-based compensation expense
calculated in accordance with Statement of Financial Accounting Standard No. 123 (revised 2004), “Share-based Payment,” and its related tax effects
were excluded in calculating non-GAAP net income. No such adjustment is made to non-GAAP net income numbers reported in this press release and its
attachments since net income amounts reported in 2007 and 2008 in each case include stock-based compensation expense. We consider non-GAAP net
income and non-GAAP net income per share to be profitability measures which facilitate the forecasting of our operating results for future periods and
allow for the comparison of our results to historical periods. A limitation of non-GAAP net income and non-GAAP net income per share is that they do
not include all items that impact our net income and net income per share for the period. Management compensates for this limitation by also relying on
the comparable GAAP financial measures of net income and net income per share, both of which include the gains, losses, expenses and related tax effects
that are excluded from non-GAAP net income and non-GAAP net income per share.
8. Yahoo! Inc.
Reconciliations to Unaudited Condensed Consolidated Statements of Income
(in thousands)
Three Months Ended Nine Months Ended
September 30, September 30,
2007 2008 2007 2008
Revenues for groups of similar services :
Marketing services:
Owned and Operated sites $ 923,061 $ 1,002,070 $ 2,634,896 $ 2,983,451
Affiliate sites 620,540 560,652 1,863,356 1,738,671
Marketing services 1,543,601 1,562,722 4,498,252 4,722,122
Fees 223,905 223,704 639,024 679,991
Total revenues $ 1,767,506 $ 1,786,426 $ 5,137,276 $ 5,402,113
Revenues by segment:
United States $ 1,194,911 $ 1,279,924 $ 3,414,182 $ 3,851,857
International 572,595 506,502 1,723,094 1,550,256
Total revenues $ 1,767,506 $ 1,786,426 $ 5,137,276 $ 5,402,113
Revenues excluding traffic acquisition costs (quot;TACquot;):
GAAP revenue $ 1,767,506 $ 1,786,426 $ 5,137,276 $ 5,402,113
TAC (484,905) (461,114) (1,427,833) (1,378,774)
Revenues excluding TAC $ 1,282,601 $ 1,325,312 $ 3,709,443 $ 4,023,339
Revenues excluding TAC by segment:
United States:
GAAP revenue $ 1,194,911 $ 1,279,924 $ 3,414,182 $ 3,851,857
TAC (232,813) (286,397) (633,463) (834,688)
Revenues excluding TAC $ 962,098 $ 993,527 $ 2,780,719 $ 3,017,169
International:
GAAP revenue $ 572,595 $ 506,502 $ 1,723,094 $ 1,550,256
TAC (252,092) (174,717) (794,370) (544,086)
Revenues excluding TAC $ 320,503 $ 331,785 $ 928,724 $ 1,006,170
Operating income before depreciation, amortization, and stock-based
compensation expense (or operating cash flow):
Income from operations $ 150,192 $ 70,174 $ 504,176 $ 291,312
Depreciation and amortization 170,577 207,605 481,472 598,473
Stock-based compensation expense 145,540 132,599 414,325 380,772
Operating income before depreciation, amortization, and stock-based
compensation expense $ 466,309 $ 410,378 $ 1,399,973 $ 1,270,557
Operating income before depreciation, amortization, and stock-based
compensation expense by segment (or operating cash flow):
Operating income before depreciation, amortization, and stock-based
compensation expense - United States $ 338,423 $ 291,406 $ 1,042,278 $ 904,438
Operating income before depreciation, amortization, and stock-based
compensation expense - International 127,886 118,972 357,695 366,119
Operating income before depreciation, amortization, and stock-based
compensation expense $ 466,309 $ 410,378 $ 1,399,973 $ 1,270,557
United States:
Income from operations $ 68,639 $ 5,707 $ 278,363 $ 76,583
Depreciation and amortization 139,753 171,446 391,399 493,087
Stock-based compensation expense 130,031 114,253 372,516 334,768
Operating income before depreciation, amortization, and stock-based
compensation expense - United States $ 338,423 $ 291,406 $ 1,042,278 $ 904,438
International:
Income from operations $ 81,553 $ 64,467 $ 225,813 $ 214,729
Depreciation and amortization 30,824 36,159 90,073 105,386
Stock-based compensation expense 15,509 18,346 41,809 46,004
Operating income before depreciation, amortization, and stock-based
compensation expense - International $ 127,886 $ 118,972 $ 357,695 $ 366,119
Free cash flow:
Cash flow from operating activities (3) $ 456,712 $ 347,091 $ 1,297,015 $ 1,559,234
Acquisition of property and equipment, net (147,150) (167,228) (409,845) (482,918)
Dividends received - - (15,156) (18,942)
Excess tax benefits from stock-based awards - 35,481 134,491 35,481
Free cash flow (3) $ 309,562 $ 215,344 $ 1,006,505 $ 1,092,855
(3)
The nine months ended September 30, 2008 includes a $350 million one-time payment from AT&T Inc. recorded in the first quarter of 2008.
9. Yahoo! Inc.
Reconciliation of GAAP Net Income and GAAP Net Income Per Share to Non-GAAP Net Income and Non-GAAP Net Income Per Share
(in thousands, except per share amounts)
Three Months Ended
September 30,
2007 2008
GAAP Net income $ 151,286 $ 54,348
(a) Incremental costs incurred for outside advisors related to Microsoft’s proposals to acquire all or a part of the
Company, other strategic alternatives, including the Google agreement, the proxy contest, and related
litigation defense costs - 36,555
(b) To adjust the provision for income taxes to reflect the tax impact of item (a) above for the three months ended
September 30, 2008 - (14,516)
(c) To adjust the provision for income taxes to reflect an effective tax rate of 39.7% and 42.0% for the three
months ended September 30, 2007 and 2008, respectively 1,659 16,537
(d) Yahoo!'s non-cash loss related to the impairment of our direct investment in Alibaba.com, net of tax, which is
included in earnings in equity interests - 30,188
Non-GAAP Net income $ 152,945 $ 123,112
GAAP Net income per share - diluted $ 0.11 $ 0.04
Non-GAAP Net income per share - diluted $ 0.11 $ 0.09
Shares used in per share calculations - diluted 1,395,056 1,397,573
Nine Months Ended
September 30,
2007 2008
GAAP Net income $ 454,277 $ 727,726
(a) Incremental costs incurred for outside advisors related to Microsoft’s proposals to acquire all or a part of the
Company, other strategic alternatives, including the Google agreement, the proxy contest, and related
litigation defense costs - 72,712
(b) Strategic workforce realignment costs, net (comprised of $29 million in pre-tax cash charges, offset by $12
million in related stock-based compensation expense reversals) (4) - 16,885
(c) To adjust the provision for income taxes to reflect the tax impact of items (a) and (b) above for the nine
months ended September 30, 2008 - (34,868)
(d) To adjust the provision for income taxes to reflect an effective tax rate of 39.7% and 42.0% for the nine
months ended September 30, 2007 and 2008, respectively 14,941 6,098
(e) Yahoo!'s non-cash gain related to Alibaba Group's initial public offering of Alibaba.com, net of tax, which is
included in earnings in equity interests (4) - (401,090)
(f) Yahoo!'s non-cash loss related to the impairment of our direct investment in Alibaba.com, net of tax, which is
included in earnings in equity interests - 30,188
Non-GAAP Net income $ 469,218 $ 417,651
(2)
GAAP Net income per share - diluted $ 0.32 $ 0.51
Non-GAAP Net income per share - diluted $ 0.33 $ 0.30
Shares used in per share calculations - diluted 1,403,756 1,396,404
(2) The impact of outstanding stock awards of entities in which the Company holds equity interests that are accounted for using the equity method
reduced the Company's diluted earnings per share by $0.01 for the nine months ended September 30, 2008.
(4) The event occurred in the first quarter of 2008.
10. Yahoo! Inc.
Business Outlook
The following business outlook is based on current information and expectations as of October 21, 2008. Yahoo!'s business outlook as of today is
expected to be available on the Company's Investor Relations website throughout the current quarter. Yahoo! does not expect, and undertakes no
obligation, to update the business outlook prior to the release of the Company's next quarterly earnings announcement, notwithstanding subsequent
developments; however, Yahoo! may update the business outlook or any portion thereof at any time at its discretion.
Three Months Year
Ending Ending
December 31, December 31,
2008 (6) 2008 (7)
Revenues (in millions): $ 1,773 - 1,973 $ 7,175 - 7,375
Operating income before depreciation, amortization, and stock-based
compensation expense (or operating cash flow) (5) outlook (in millions):
Income from operations $ 195 - 235 $ 588 - 628
Depreciation and amortization 205 - 225 803 - 823
Stock-based compensation expense 90 - 110 471 - 491
Operating income before depreciation, amortization, and stock-based
compensation expense (or operating cash flow) $ 490 - 570 $ 1,862 - 1,942
(5) Refer to Note to Unaudited Condensed Consolidated Statements of Income.
(6) This outlook for the three months ending December 31, 2008 excludes any incremental costs incurred for outside advisors related to strategic
alternatives including the Google agreement, defense costs for securities litigation relating to Microsoft's proposals to acquire all or a part of
the Company and other strategic alternatives and any charges arising from the cost reduction initiatives to be implemented in the fourth
quarter of 2008.
(7) This outlook for the year ending December 31, 2008 excludes charges arising from the Company’s strategic workforce realignment
implemented in the first quarter of 2008, including $29 million of such costs incurred through September 30, 2008, incremental costs incurred
for outside advisors related to Microsoft’s proposals to acquire all or a part of the Company, other strategic alternatives, including the Google
agreement, the proxy contest, and related litigation defense costs, including $73 million of such incremental costs incurred through September
30, 2008 and any charges arising from the cost reduction initiatives to be implemented in the fourth quarter of 2008.
11. Yahoo! Inc.
Unaudited Condensed Consolidated Statements of Cash Flows
(in thousands)
Three Months Ended Nine Months Ended
September 30, September 30,
2007 2008 2007 2008
CASH FLOWS FROM OPERATING ACTIVITIES:
Net income $ 151,286 $ 54,348 $ 454,277 $ 727,726
Adjustments to reconcile net income to net cash provided by
operating activities:
Depreciation 102,422 128,997 299,933 372,467
Amortization of intangible assets 68,155 78,608 181,539 226,006
Stock-based compensation expense 145,540 132,599 414,325 393,056
Stock-based strategic workforce realignment expense reversals - - - (12,284)
Tax benefits from stock-based awards 6,028 21,066 170,683 52,199
Excess tax benefits from stock-based awards - (35,481) (134,491) (35,481)
Deferred income taxes (43,746) 4,973 (134,585) 42,500
Earnings in equity interests (36,546) (27,762) (97,801) (537,471)
Dividends received - - 15,156 18,942
Minority interests in operations of consolidated subsidiaries 547 1,892 (1,108) 3,031
(Gains)/losses from sale of investments, assets, and other, net (14,318) 6,275 (12,796) 2,365
Changes in assets and liabilities, net of effects of acquisitions:
Accounts receivable, net (49,746) 22,786 (6,381) 46,422
Prepaid expenses and other 73,578 (35,934) 61,059 (37,683)
Accounts payable (19,005) 3,856 12,073 (35,596)
Accrued expenses and other liabilities 66,648 46,546 50,809 101,162
Deferred revenue 5,869 (55,678) 24,323 231,873
Net cash provided by operating activities 456,712 347,091 1,297,015 1,559,234
CASH FLOWS FROM INVESTING ACTIVITIES:
Acquisition of property and equipment, net (147,150) (167,228) (409,845) (482,918)
Purchases of marketable debt securities (112,004) (392,246) (1,105,043) (1,281,713)
Proceeds from sales of marketable debt securities 204,723 48,829 478,817 248,130
Proceeds from maturities of marketable debt securities 305,964 356,913 1,376,622 727,890
Acquisitions, net of cash acquired (319,503) (29,349) (355,514) (209,196)
Purchase of intangible assets (55,461) (15,824) (75,375) (66,984)
Other investing activities, net (30,369) (112) (30,369) (7,751)
Net cash used in investing activities (153,800) (199,017) (120,707) (1,072,542)
CASH FLOWS FROM FINANCING ACTIVITIES:
Proceeds from issuance of common stock, net 40,164 13,958 243,889 331,403
Repurchases of common stock (350,055) - (1,363,236) (79,236)
Structured stock repurchases, net - - (250,000) -
Excess tax benefits from stock-based awards - 35,481 134,491 35,481
Tax withholdings related to net share settlements of restricted stock awards
and restricted stock units (42) (8,456) (3,750) (65,068)
Other financing activities, net (12,125) - (12,125) (74)
Net cash (used in) provided by financing activities (322,058) 40,983 (1,250,731) 222,506
Effect of exchange rate changes on cash and cash equivalents 21,284 (96,677) 32,502 (79,378)
Net change in cash and cash equivalents 2,138 92,380 (41,921) 629,820
Cash and cash equivalents, beginning of period 1,525,812 2,051,370 1,569,871 1,513,930
Cash and cash equivalents, end of period $ 1,527,950 $ 2,143,750 $ 1,527,950 $ 2,143,750
Supplemental schedule of acquisition-related activities:
Cash paid for acquisitions $ 338,910 $ 54,284 $ 380,677 $ 234,626
Cash acquired in acquisitions (19,407) (24,935) (25,163) (25,430)
$ 319,503 $ 29,349 $ 355,514 $ 209,196
Fair value of common stock and vested stock-based awards issued in connection
with acquisitions
$ 236,500 $ - $ 271,504 $ -
12. Yahoo! Inc.
Unaudited Condensed Consolidated Balance Sheets
(in thousands)
December 31, September 30,
2007 2008
ASSETS
Current assets:
Cash and cash equivalents $ 1,513,930 $ 2,143,750
Short-term marketable debt securities 487,544 1,070,350
Accounts receivable, net 1,055,532 992,936
Prepaid expenses and other current assets 180,716 189,785
Total current assets 3,237,722 4,396,821
Long-term marketable debt securities 361,998 85,128
Property and equipment, net 1,331,632 1,490,655
Goodwill 4,002,030 4,038,445
Intangible assets, net 611,497 556,466
Other long-term assets 503,945 226,113
Investments in equity interests 2,180,917 3,114,852
Total assets $ 12,229,741 $ 13,908,480
LIABILITIES AND STOCKHOLDERS' EQUITY
Current liabilities:
Accounts payable $ 176,162 $ 150,990
Accrued expenses and other current liabilities 1,006,188 1,076,991
Deferred revenue 368,470 446,565
Short-term debt 749,628 -
Total current liabilities 2,300,448 1,674,546
Long-term deferred revenue 95,129 246,263
Other long-term liabilities 28,086 63,008
Deferred and other long-term tax liabilities, net 260,993 307,553
Minority interests in consolidated subsidiaries 12,254 15,285
Stockholders' equity 9,532,831 11,601,825
Total liabilities and stockholders' equity $ 12,229,741 $ 13,908,480