Download to read offline
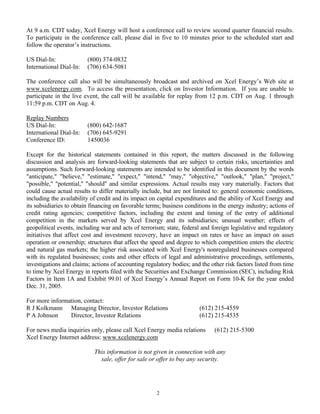
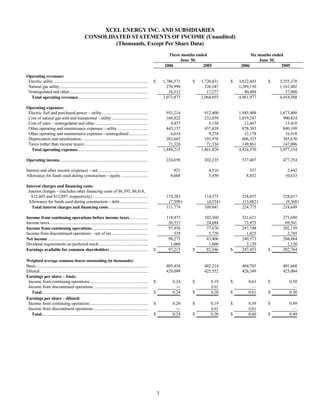
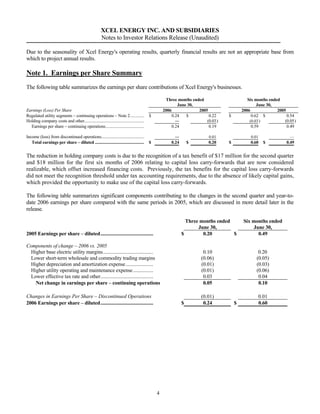
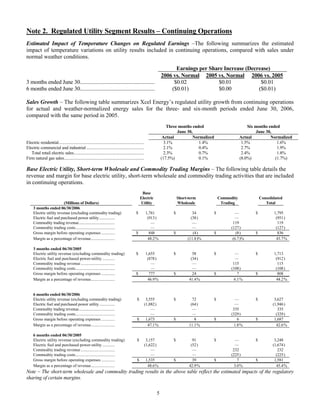
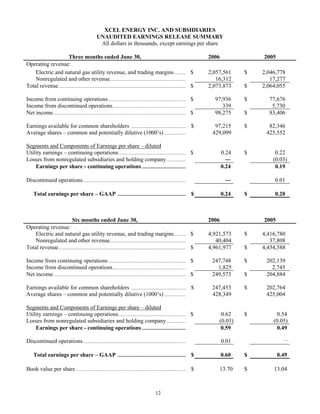
Xcel Energy announced its second quarter 2006 earnings. Income from continuing operations was $98 million compared to $78 million in the second quarter of 2005. Net income was also $98 million compared to $83 million in the prior year. Increased earnings were primarily due to stronger base electric and natural gas utility margins, partially offset by lower short-term wholesale margins. The company reaffirmed its 2006 earnings guidance of $1.25 to $1.35 per share.


