Download to read offline


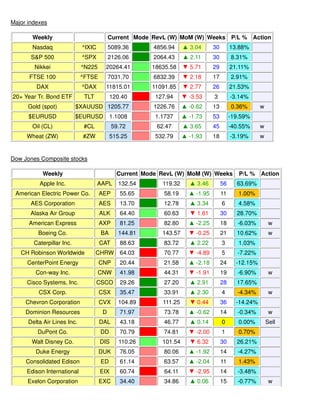
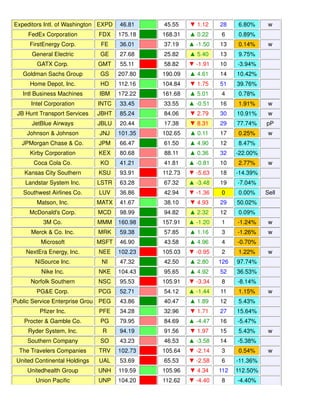
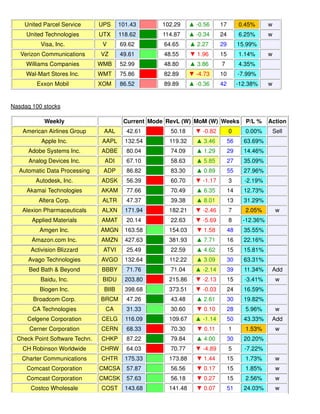
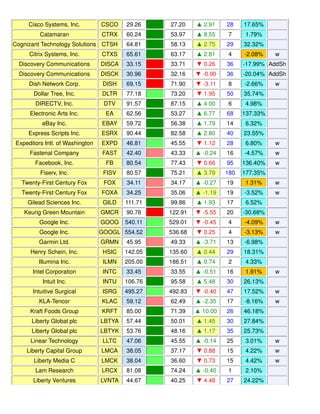
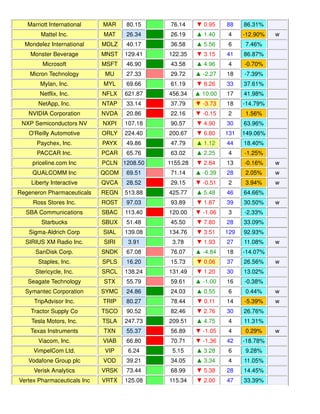
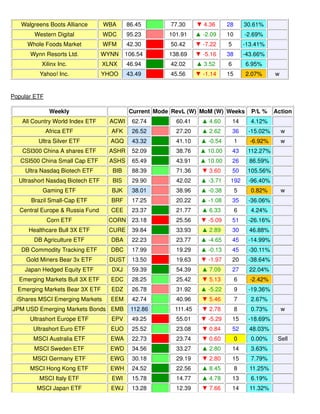
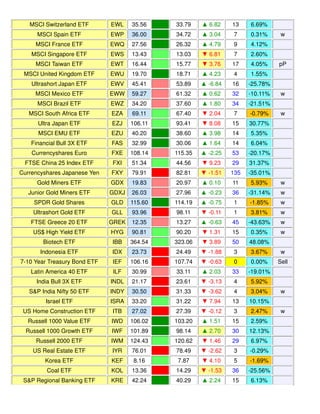
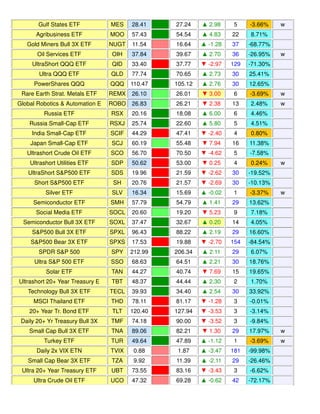
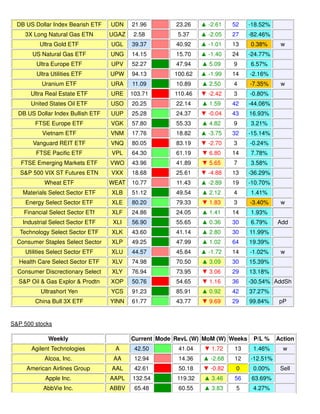
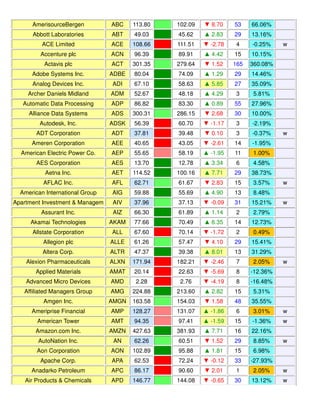
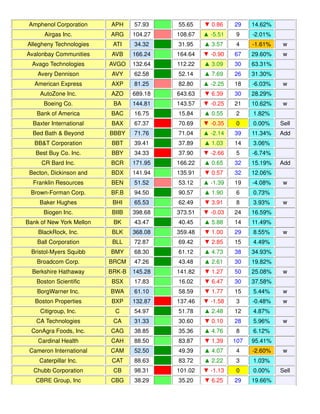

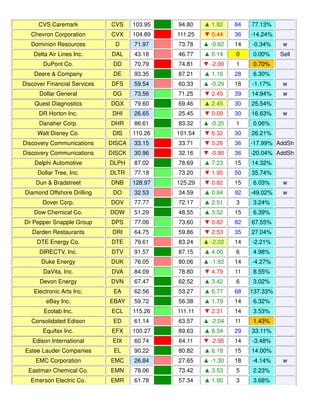
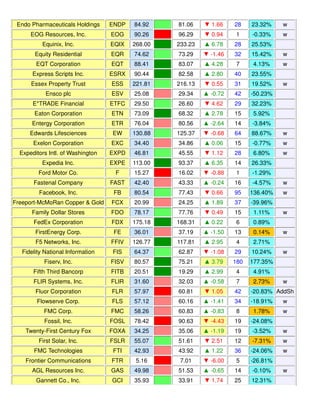
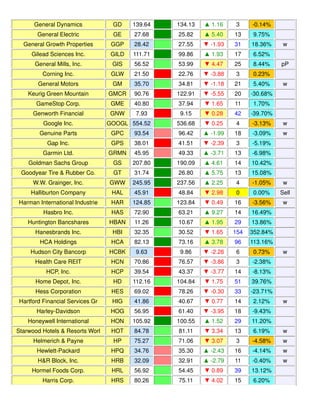
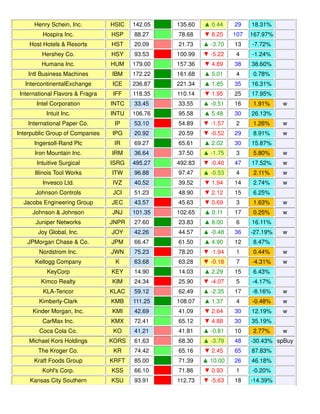
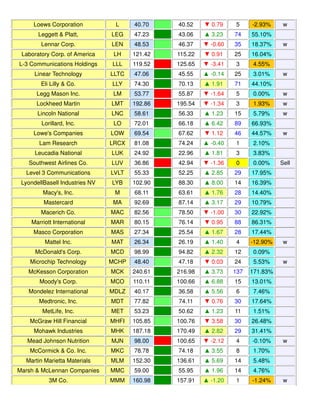
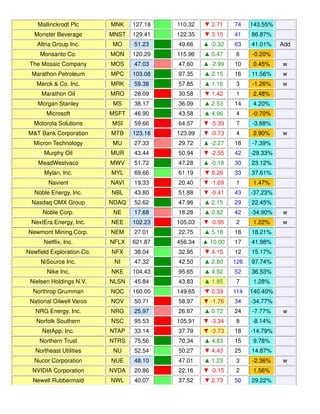
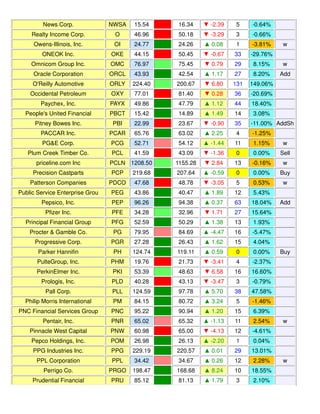
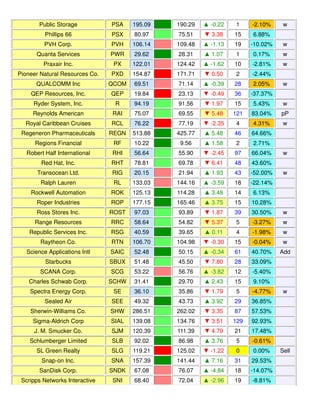
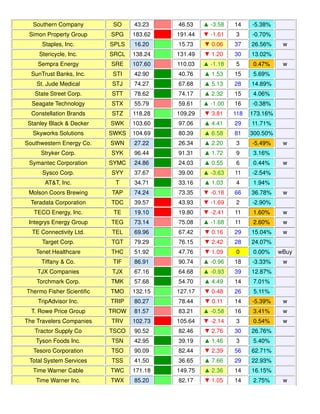
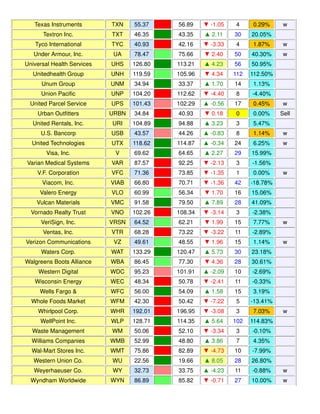
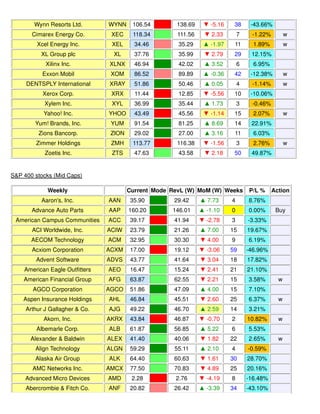
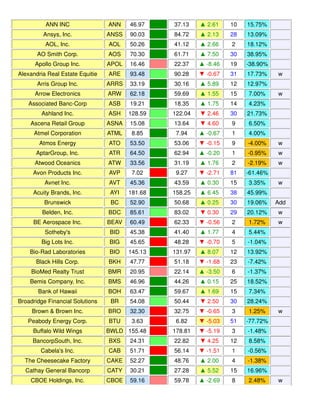
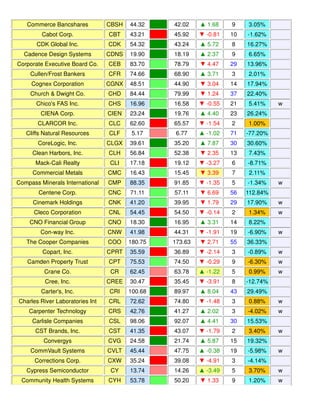
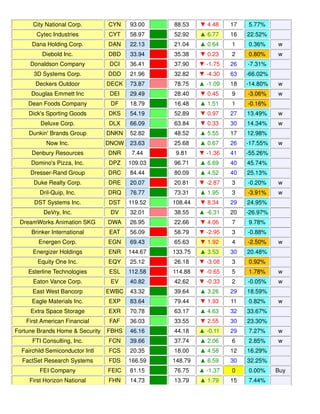

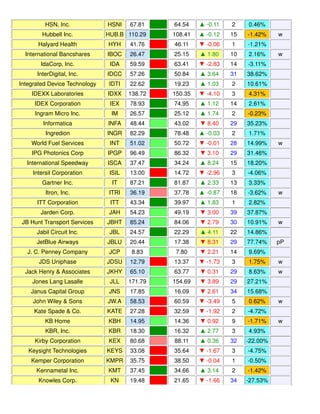
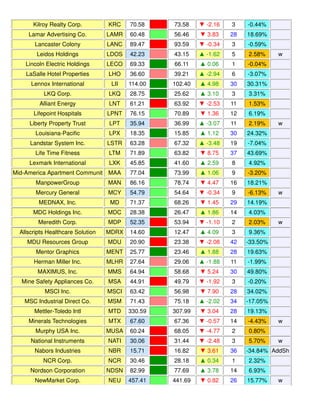
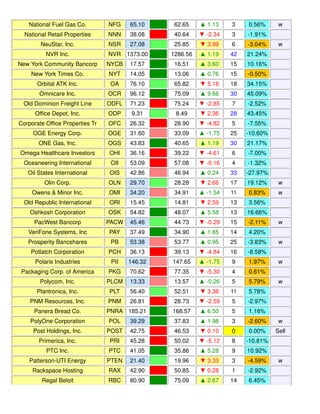
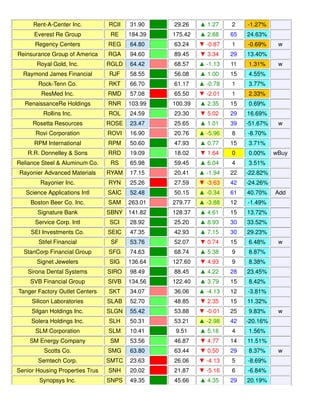
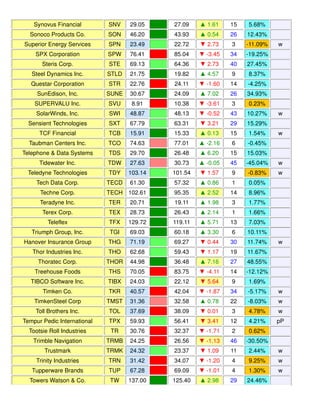
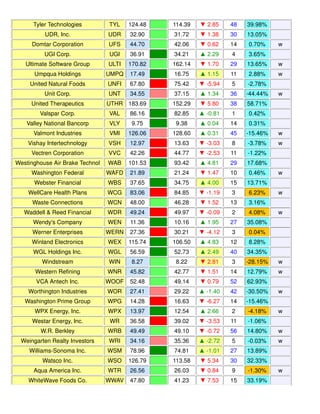
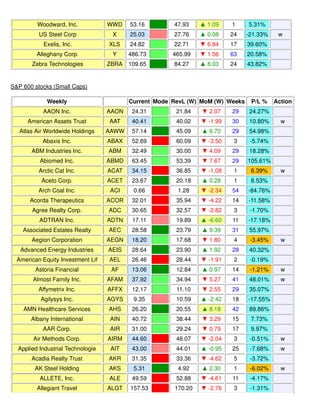
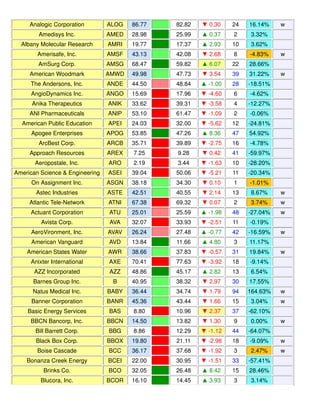
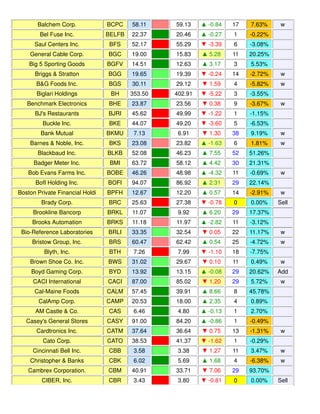
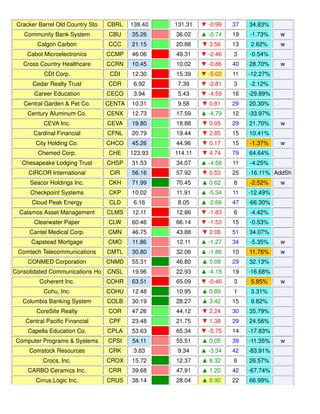
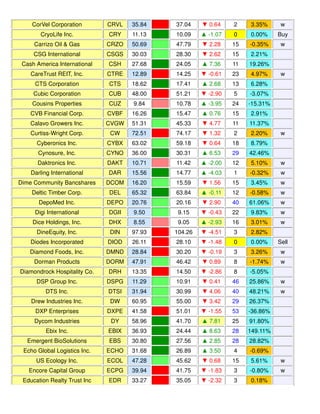
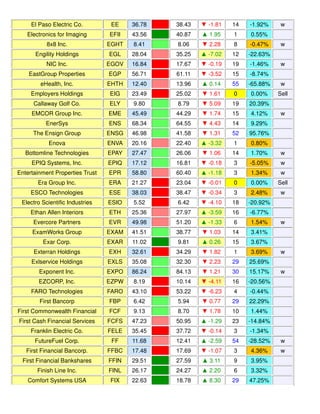
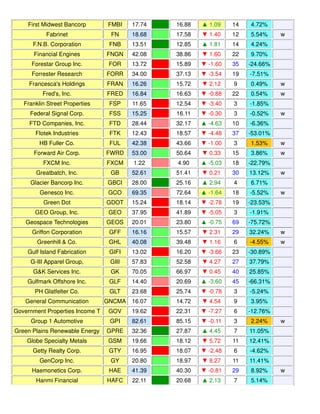
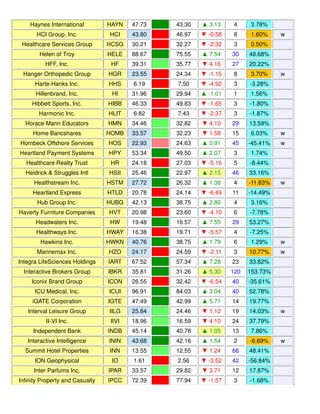
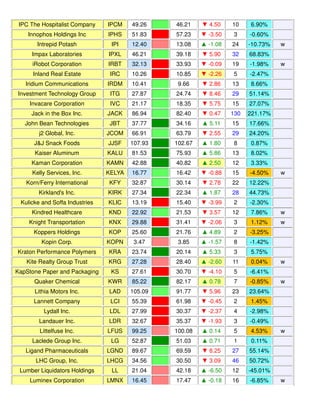
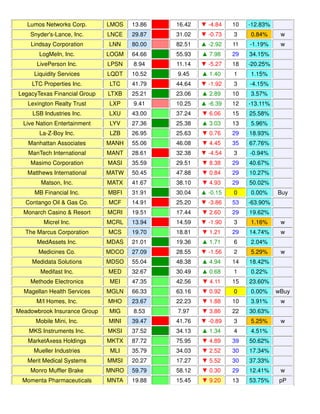
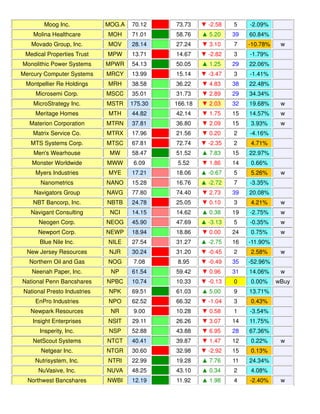
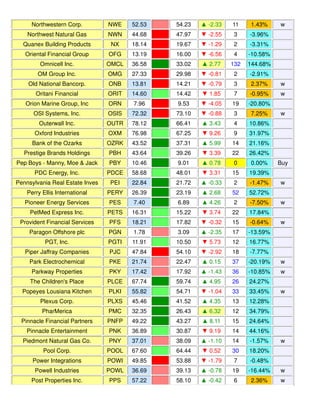
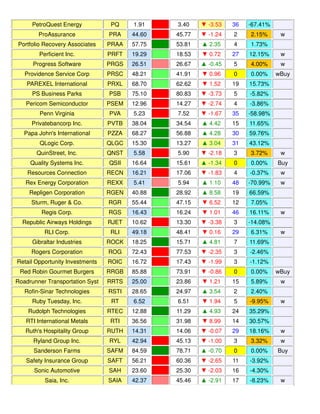
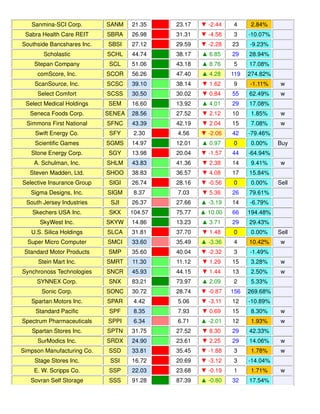
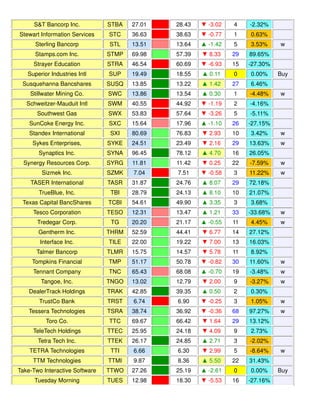
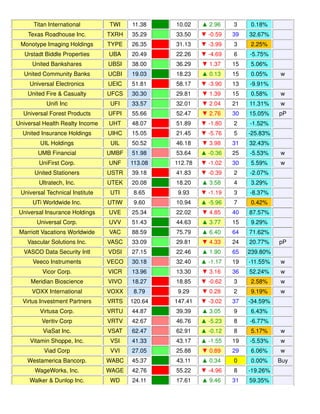
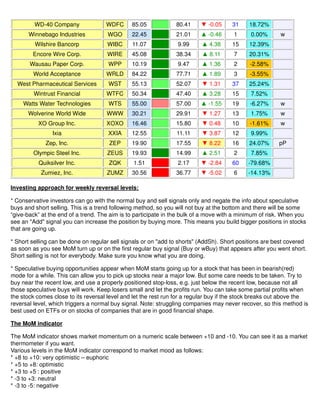


The document provides weekly reversal levels and momentum indicators for various stocks and indexes as of May 23, 2015, offering guidance for market orientation and long-term investing strategies. It categorizes the market conditions with color codes representing bullish or bearish trends and provides trading signals such as buy, sell, and watch. Additionally, it includes specific data on numerous stocks, their reversal levels, momentum, and performance percentages since previous signals.


