Downloaded 418 times
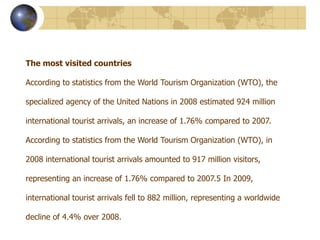
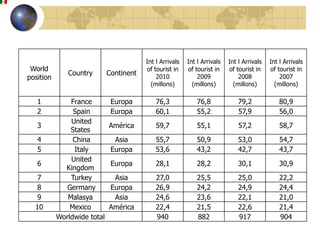
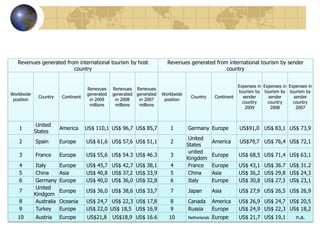
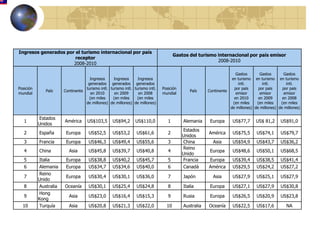
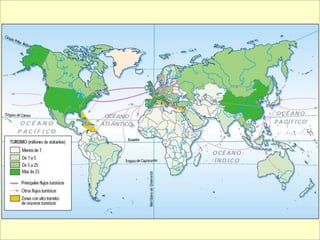


International tourism faced many challenges in 2008-2009 due to the global economic crisis, including a 4.4% decline in tourist arrivals from 917 million in 2008 to 882 million in 2009. However, the industry began recovering in 2010 with arrivals growing to 940 million. France remained the most visited country while tourism revenues grew fastest in the United States and Spain.