


![14 World Wealth Report 2009
to 34%, from 43% in 2007, but that was still 9 percentage in the second half of 2008, happy to settle for a return of, not
points above the global average allocation to equities. on, their capital.
elsewhere, hNWIs also scaled back on their equity holdings latin american hNWIs allocated the highest proportion
amid stock-market volatility and declines. the allotment was among regions to fixed income investments (40%), though
21% in both europe and the Middle east by the end of 2008, that was up just 1% from 2007. Their preference for fixed
down 10 percentage points from 2007 levels in each case. In income largely reflects their traditionally low risk appetite.
latin america, it was down 8 percentage points to 20%. Conversely, hNWIs in emerging/developing asia (i.e., exclud-
ing Japan) allocated a much smaller proportion (17%) of their
HNWIs, WARy OF MARkETS AND RISk, kEPT overall portfolio to fixed income investments.
MORE CASH IN 2008
as the global banking and financial crises worsened, and credit REAL ESTATE, ESPECIALLy RESIDENTIAL,
tightened, hNWIs became more risk-averse and wary of complex REGAINED SOME OF ITS APPEAL FOR
products in 2008, with global net inflows into money market HNWIs IN 2008
funds exceeding $455 billion for the year.35 Ultimately, there was Real estate investments picked up again in 2008, rising to
a significant increase in the amount of hNWI wealth in cash- 18% of total hNWI financial assets from 14% in 2007, when
based holdings—an average of 21% of overall portfolios, up 7 its share had dropped by 10 percentage points from the year
percentage points from pre-crisis levels in 2006. before. the return to real estate reflected the preference of
hNWIs for tangible assets, as well as a trend toward bargain-
the proportion of cash-based holdings was highest among hNWIs
hunting, especially in commercial real estate and newly built
in Japan (30%), where the savings rate has been traditionally
segments,36 but also in residential real estate, where prices saw
high, and was nearly as high in the rest of asia (26%, up 5
the worst decline on record. Inflation hedging may also have
percentage points from 2007). By contrast, hNWIs in North
spurred some buying.37
america—where the use of credit is a ubiquitous source of funding
and payments—held the lowest amount of cash/deposits as a overall, residential real estate38 accounted for 45% of total
percentage of their total portfolios (14%, up only 3 percentage hNWI real estate investments at the end of 2008. luxury
points). residential property values dropped in 2008 to levels last seen
in 2003 and 2004, prompting some hNWIs to buy, particularly
Cash-based investments held outside of the formal banking
“once in a lifetime” properties.39
system (e.g. held in a vault etc) totaled 19% of global hNWI
cash and deposit-based investments. hNWIs across asia the emerging regions of the Middle east and asia-Pacific
(excluding Japan) held the highest proportion of cash (excluding Japan) had the highest HNWI allocation to real
outside of an account—29%, largely reflecting the lack of estate investment (25% and 23%, respectively), and the greatest
confidence hNWIs had in the regions’ emerging-market proportion of residential real estate (54% and 58%, respectively).
banking systems, which tend to be less transparent than those Both regions have experienced an exponential boom in real
in more developed markets. North american hNWIs held estate investment over the last few years, but a steep drop in
the least amount of cash outside of an account, at 14% of cash end-user demand has combined with lack of available financing
holdings. to fuel a rapid decline in prices, particularly in the fourth quarter
of 2008.
HNWIs, SEEkING SAFETy, ALSO ALLOCATED
Within the Middle east, the biggest change in the real estate
MORE WEALTH TO FIxED INCOME
market has been the shift in buyer profile—from short-term
hNWIs continued to allocate an increasing proportion of
speculative investors back to professional investors, who focus
their investments to fixed-income investments in 2008,
on cash-on-cash yield potential40 (i.e., focusing on the return
bringing the allotment to 29% of global hNWI portfolios at
on invested capital, not the asset value itself). Real estate in the
the end of 2008, up 2 percentage points from 2007.
Middle eastern lynchpin of dubai peaked in september, before
In fact, many hNWIs around the world were willing to eschew falling about 25% in value during the fourth quarter of 2008.41
returns altogether in favor of safety. For example, hNWIs were
hNWI holdings of commercial real estate accounted for 28%
among the investors who bought zero-yield US Treasury bills
of total hNWI real estate holdings, little changed from 29% in
35
Reuters, “Money market funds big winners in 2008”, April 21, 2009, http://uk.reuters.com/ 39
kay Coughlin, President CEO, Christie’s Great Estates. Interview by Capgemini, April 2009
article/fundsNews/idUkLNE50602x20090107 40
Colliers International, GCC Real Estate Overview Second Quarter 2009 [Online], April 21,
36
knight Frank/Citi Private Bank, The Wealth Report [Online], March 24, 2009, www. 2009, http://www.colliers-me.com/marketreports.aspx
knightfrank.com/wealthreport/TheWealthReport2009.pdf 41
The Economist, “Dubai: A new world”, April 25, 2009, http://www.economist.com/finance/
37
kay Coughlin, President CEO, Christie’s Great Estates. Interview by Capgemini, April 2009 displaystory.cfm?story_id=13527891
38
Not including primary residence](https://image.slidesharecdn.com/worldwealthreport2009-1257275850514-phpapp01/85/World-Wealth-Report-2009-16-320.jpg)


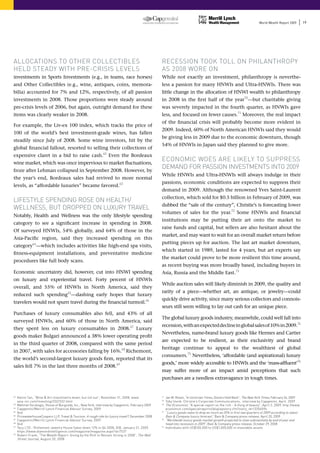


The global HNWI population and wealth contracted significantly in 2008 due to the financial crisis: - The HNWI population fell 14.9% while their wealth dropped 19.5%, wiping out gains from 2006-2007. - Ultra-HNWIs suffered even larger declines of 24.6% in population and 23.9% in wealth. - The US, Japan and Germany still accounted for over half of global HNWIs despite declines, while China surpassed the UK as the 4th largest HNWI population. - HNWI wealth is forecast to start growing again at an annual rate of 8.1% as the global economy recovers, with Asia-Pacific projected to overtake


