Download to read offline
![2011 Asia-Pacific WEALTH report6
Asia-Pacific HNW Segment Extended Post-Crisis Recovery in 2010
2
Mid-tier HNWIs are defined as those having investable assets of US$5 million to US$30 million, excluding primary residence, collectibles, consumables, and consumer durables, and Ultra-
HNWIs have more than US$30 million.
Within Asia-Pacific, many markets had managed to
recoup their 2008 wealth losses in 2009, but Australia,
Singapore, and Indonesia only surpassed 2007 levels in
2010, and Hong Kong has yet to do so. Wealth held by
Hong Kong’s HNWIs declined a staggering 65.4% in
2008, so even the huge gains of the last two years (35.0%
in 2010, and 108.9% in 2009) have not been able to
eradicate those losses. Still, the level of wealth is nearing
2007 highs.
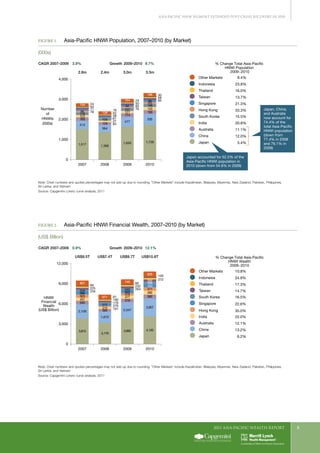
Japan and China Are Still the
Largest HNWI Markets, but
Others Are Catching Up
Japan is the behemoth HNWI market in Asia-Pacific,
home to 1.7 million or 52.5% of the region’s HNWIs.
Next largest, and far behind, are China (535,000, or
16.1%) and Australia (193,000, or 5.8%). Still, other
HNWI markets are clearly growing—especially in
developing and emerging economies, contributing to
very gradual fragmentation. The combined share of
Asia-Pacific’s HNWI population held by Japan, China,
and Australia has declined from 77.4% in 2008, to
74.4% in 2010.
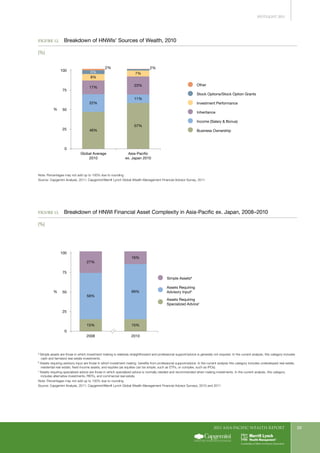
Notably, though, HNWI wealth in the region is heavily
concentrated in very few hands (as these economies are by
definition still “emerging,” so wealth is not broadly
distributed). As the aggregate levels of wealth in these
markets rise, it is likely that the HNWI populations will
naturally expand and diversify over time, but in 2010,
mid-tier and Ultra-HNWIs accounted for nearly 50% of
the region’s HNWI wealth, while comprising less than
10% of the total Asia-Pacific HNWI population.2
Different market-specific developments occurred
in Asia-Pacific during 2010:
ƒƒ Hong Kong HNWIs are known to be aggressive in
pursuit of returns, and their preference for equity and
real estate investments has driven both the demise and
the recovery of the segment during the turbulent years
since 2007. Wealth held by Hong Kong’s HNWIs
surged 35% in 2010, after huge gains (up 108.9%) in
2009, but wealth had sunk a staggering 65.4% in 2008,
so even the recovery of the last two years has yet to push
the level of HNWI wealth above 2007 highs—though
it neared the 2007 level in 2010.
ƒƒ Other growth markets such as Singapore, India, and
China have seen the expansion of HNWI populations
and wealth, fueled by strong macroeconomic growth
(evidenced in indicators such as gross national income
[GNI] and national savings) and by market
performance (especially equities and real estate).
ƒƒ The more mature markets of Australia and Japan have
seen a more moderate pace of recovery—in their
financial markets, economies, and HNW segments.
In 2010, eight of the world’s 20 fastest-growing HNWI
populations were Asia-Pacific markets, including Hong
Kong, Vietnam, Sri Lanka, Indonesia, Singapore, and
India. Asia-Pacific will very likely remain the source of
many of the world’s fastest-growing HNWI
populations in the future, but the pace of their growth
will depend heavily on both the macroeconomic course
of emerging markets and the strength of demand from
mature markets.
Looking forward, the outlook is unclear for many of the
key asset classes that have driven wealth creation for
Asia-Pacific HNWIs (see next chapter, “2010 in
Review”), particularly real estate and equities. Also,
governments face numerous challenges that could
constrain economic expansion in the coming years.](https://image.slidesharecdn.com/c350238b-ce8d-4953-a9d4-f7b687d4f820-150518062524-lva1-app6892/85/Asia-Pacific_Wealth_Report_2011_____English_Version-6-320.jpg)
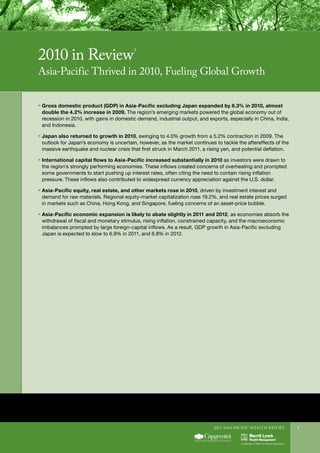

The Asia-Pacific HNWI population and wealth extended their post-crisis recovery in 2010: The Asia-Pacific HNWI population grew to 3.3 million, exceeding Europe's population and nearing North America's. The population is now 18.3% larger than in 2007 before the crisis. HNWI wealth in the region grew 12.1% to US$10.8 trillion in 2010, outpacing the growth in Europe. Wealth ended 2010 up 14.1% from 2007 levels. Japan remains the largest HNWI segment but other markets like China, Australia, Hong Kong, and India are growing rapidly. The combined share of Japan,


