Workshop3_Yuvadee
•Download as PPTX, PDF•
0 likes•90 views
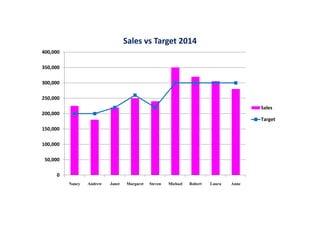
This bar graph shows the sales figures for 9 employees in 2014 compared to their targets. Nancy, Janet, Steven, Michael, and Robert exceeded their sales targets, while Andrew, Margaret, Laura, and Anne did not reach their 2014 targets. The graph provides a visual comparison of each person's sales performance relative to the goals set for that year.
Report
Share
Report
Share
Recommended
Dissecting sales data
This document analyzes and summarizes sales data from 2014 for a company. It includes monthly sales comparisons, sales by salesperson, sales by region, top 5 customers by sales, total revenue and sales percentages by product, and transaction counts by invoice amount. Charts and graphs are provided to visualize trends in the sales data.
Denys starovoitov ...
O dia está ensolarado e quente, com 15°C, sem chuva e ventos fracos. O ar está perfumado com o doce aroma das flores que se espalham.
Greece lightening
The ink has barely dried on the ECB’s shock-and-awe QE program that the market’s attention has already shifted back to Greece. The election over the weekend of a new government, led by Prime Minister Tsipras, has reignited the seemingly annual debate about whether/when Greece will default on its debt and leave the eurozone.
Neuschwanstein
This short document promotes creating presentations using Haiku Deck, a tool for making slideshows. It encourages the reader to get started making their own Haiku Deck presentation and sharing it on SlideShare. In just one sentence, it pitches the idea of using Haiku Deck to easily create engaging slideshows.
Relaciones
Esta organización depende de voluntarios y empresas colaboradoras para su financiamiento, incluyendo empresas de comunicación y medios de comunicación que apoyan su misión.
Presentación1
La lucha libre alcanzó su mayor popularidad con la televisión y las primeras transmisiones nocturnas de este deporte espectáculo. México ha ocupado tradicionalmente el primer puesto mundial en lucha libre, seguido de Japón y Estados Unidos. El documento también describe los orígenes de la lucha libre en México y la fundación de la Empresa Mexicana de Lucha Libre el 21 de septiembre de 1933.
Algebra sistemas - Evidencias
La Unión Europea ha acordado un embargo petrolero contra Rusia en respuesta a la invasión de Ucrania. El embargo prohibirá las importaciones marítimas de petróleo ruso a la UE y pondrá fin a las entregas a través de oleoductos dentro de seis meses. Esta medida forma parte de un sexto paquete de sanciones de la UE destinadas a aumentar la presión económica sobre el gobierno de Putin.
ACC 561 WEEK 1 COMPLETE
Haiku Deck is a presentation tool that allows users to create Haiku style slideshows. The tool encourages users to get started making their own Haiku Deck presentations which can be shared on SlideShare. In just a few clicks, users can design beautiful, minimalist slideshows.
ACC 401 WEEK 5
This short document promotes creating Haiku Deck presentations on SlideShare and getting started making one. It encourages the reader to be inspired to make their own presentation using Haiku Deck on the SlideShare platform. A call to action is given to get started creating a Haiku Deck presentation.
Presentación5
La empresa ofrece los mejores diseños y la mejor calidad para empresas, ubicada en la Manzana D5 Casa 45 de Torcoroma lll, y también proporcionan un correo electrónico y número de teléfono para contactarlos.
Ahmed Abdelhay CV2
The document is a resume for Ahmed Abdelhay seeking an IT position. It outlines his education including a Bachelor's degree in Computer Engineering from George Mason University with a focus on networking, programming, and embedded systems. It also lists relevant projects, certifications, and professional experience in IT support roles overseeing networks, security, and systems for various companies in Qatar. His skills include networking, routing, switching, database management, and troubleshooting hardware and software issues.
Presentación1
La placa base o tarjeta madre es una placa de circuito impreso fundamental en la construcción de una computadora. Conecta los principales componentes como el microprocesador, la memoria RAM y las ranuras de expansión. Incluye un chipset y BIOS que gestionan el flujo de datos entre los componentes y cargan el sistema operativo. Admite conectores de alimentación, zócalo de CPU, ranuras de memoria y otros circuitos necesarios para el funcionamiento básico de la computadora.
Workshop7_Yuvadee
The document contains percentages that add up to 100%. The largest percentage is 29%, followed by 22% and 19%. The remaining percentages are 12%, 14%, and 4% respectively.
Workshop6_Yuvadee
This document discusses key leadership qualities including power, self-control, social ability, and vision. It lists the name "Manee Thana Somsri" but does not provide any other context or information about the content of the document.
Workshop5_Yuvadee
This chart shows the sales and margin percentage for a company over the first 5 months of the year. Sales were highest in March at around $2 million but margins peaked in February at 1%. Overall the chart illustrates the relationship between monthly sales revenue and profit margins.
How to Manage Your Lost Opportunities in Odoo 17 CRM
Odoo 17 CRM allows us to track why we lose sales opportunities with "Lost Reasons." This helps analyze our sales process and identify areas for improvement. Here's how to configure lost reasons in Odoo 17 CRM
BÀI TẬP BỔ TRỢ TIẾNG ANH 8 CẢ NĂM - GLOBAL SUCCESS - NĂM HỌC 2023-2024 (CÓ FI...
BÀI TẬP BỔ TRỢ TIẾNG ANH 8 CẢ NĂM - GLOBAL SUCCESS - NĂM HỌC 2023-2024 (CÓ FI...Nguyen Thanh Tu Collection
https://app.box.com/s/y977uz6bpd3af4qsebv7r9b7s21935vdDigital Artifact 1 - 10VCD Environments Unit
Digital Artifact 1 - 10VCD Environments Unit - NGV Pavilion Concept Design
How to Build a Module in Odoo 17 Using the Scaffold Method
Odoo provides an option for creating a module by using a single line command. By using this command the user can make a whole structure of a module. It is very easy for a beginner to make a module. There is no need to make each file manually. This slide will show how to create a module using the scaffold method.
Top five deadliest dog breeds in America
Thinking of getting a dog? Be aware that breeds like Pit Bulls, Rottweilers, and German Shepherds can be loyal and dangerous. Proper training and socialization are crucial to preventing aggressive behaviors. Ensure safety by understanding their needs and always supervising interactions. Stay safe, and enjoy your furry friends!
More Related Content
Viewers also liked
Algebra sistemas - Evidencias
La Unión Europea ha acordado un embargo petrolero contra Rusia en respuesta a la invasión de Ucrania. El embargo prohibirá las importaciones marítimas de petróleo ruso a la UE y pondrá fin a las entregas a través de oleoductos dentro de seis meses. Esta medida forma parte de un sexto paquete de sanciones de la UE destinadas a aumentar la presión económica sobre el gobierno de Putin.
ACC 561 WEEK 1 COMPLETE
Haiku Deck is a presentation tool that allows users to create Haiku style slideshows. The tool encourages users to get started making their own Haiku Deck presentations which can be shared on SlideShare. In just a few clicks, users can design beautiful, minimalist slideshows.
ACC 401 WEEK 5
This short document promotes creating Haiku Deck presentations on SlideShare and getting started making one. It encourages the reader to be inspired to make their own presentation using Haiku Deck on the SlideShare platform. A call to action is given to get started creating a Haiku Deck presentation.
Presentación5
La empresa ofrece los mejores diseños y la mejor calidad para empresas, ubicada en la Manzana D5 Casa 45 de Torcoroma lll, y también proporcionan un correo electrónico y número de teléfono para contactarlos.
Ahmed Abdelhay CV2
The document is a resume for Ahmed Abdelhay seeking an IT position. It outlines his education including a Bachelor's degree in Computer Engineering from George Mason University with a focus on networking, programming, and embedded systems. It also lists relevant projects, certifications, and professional experience in IT support roles overseeing networks, security, and systems for various companies in Qatar. His skills include networking, routing, switching, database management, and troubleshooting hardware and software issues.
Presentación1
La placa base o tarjeta madre es una placa de circuito impreso fundamental en la construcción de una computadora. Conecta los principales componentes como el microprocesador, la memoria RAM y las ranuras de expansión. Incluye un chipset y BIOS que gestionan el flujo de datos entre los componentes y cargan el sistema operativo. Admite conectores de alimentación, zócalo de CPU, ranuras de memoria y otros circuitos necesarios para el funcionamiento básico de la computadora.
Viewers also liked (8)
More from yuvadee425
Workshop7_Yuvadee
The document contains percentages that add up to 100%. The largest percentage is 29%, followed by 22% and 19%. The remaining percentages are 12%, 14%, and 4% respectively.
Workshop6_Yuvadee
This document discusses key leadership qualities including power, self-control, social ability, and vision. It lists the name "Manee Thana Somsri" but does not provide any other context or information about the content of the document.
Workshop5_Yuvadee
This chart shows the sales and margin percentage for a company over the first 5 months of the year. Sales were highest in March at around $2 million but margins peaked in February at 1%. Overall the chart illustrates the relationship between monthly sales revenue and profit margins.
More from yuvadee425 (7)
Recently uploaded
How to Manage Your Lost Opportunities in Odoo 17 CRM
Odoo 17 CRM allows us to track why we lose sales opportunities with "Lost Reasons." This helps analyze our sales process and identify areas for improvement. Here's how to configure lost reasons in Odoo 17 CRM
BÀI TẬP BỔ TRỢ TIẾNG ANH 8 CẢ NĂM - GLOBAL SUCCESS - NĂM HỌC 2023-2024 (CÓ FI...
BÀI TẬP BỔ TRỢ TIẾNG ANH 8 CẢ NĂM - GLOBAL SUCCESS - NĂM HỌC 2023-2024 (CÓ FI...Nguyen Thanh Tu Collection
https://app.box.com/s/y977uz6bpd3af4qsebv7r9b7s21935vdDigital Artifact 1 - 10VCD Environments Unit
Digital Artifact 1 - 10VCD Environments Unit - NGV Pavilion Concept Design
How to Build a Module in Odoo 17 Using the Scaffold Method
Odoo provides an option for creating a module by using a single line command. By using this command the user can make a whole structure of a module. It is very easy for a beginner to make a module. There is no need to make each file manually. This slide will show how to create a module using the scaffold method.
Top five deadliest dog breeds in America
Thinking of getting a dog? Be aware that breeds like Pit Bulls, Rottweilers, and German Shepherds can be loyal and dangerous. Proper training and socialization are crucial to preventing aggressive behaviors. Ensure safety by understanding their needs and always supervising interactions. Stay safe, and enjoy your furry friends!
How to Fix the Import Error in the Odoo 17
An import error occurs when a program fails to import a module or library, disrupting its execution. In languages like Python, this issue arises when the specified module cannot be found or accessed, hindering the program's functionality. Resolving import errors is crucial for maintaining smooth software operation and uninterrupted development processes.
CACJapan - GROUP Presentation 1- Wk 4.pdf
Macroeconomics- Movie Location
This will be used as part of your Personal Professional Portfolio once graded.
Objective:
Prepare a presentation or a paper using research, basic comparative analysis, data organization and application of economic information. You will make an informed assessment of an economic climate outside of the United States to accomplish an entertainment industry objective.
Assessment and Planning in Educational technology.pptx
In an education system, it is understood that assessment is only for the students, but on the other hand, the Assessment of teachers is also an important aspect of the education system that ensures teachers are providing high-quality instruction to students. The assessment process can be used to provide feedback and support for professional development, to inform decisions about teacher retention or promotion, or to evaluate teacher effectiveness for accountability purposes.
Exploiting Artificial Intelligence for Empowering Researchers and Faculty, In...
Exploiting Artificial Intelligence for Empowering Researchers and Faculty, In...Dr. Vinod Kumar Kanvaria
Exploiting Artificial Intelligence for Empowering Researchers and Faculty,
International FDP on Fundamentals of Research in Social Sciences
at Integral University, Lucknow, 06.06.2024
By Dr. Vinod Kumar KanvariaISO/IEC 27001, ISO/IEC 42001, and GDPR: Best Practices for Implementation and...
Denis is a dynamic and results-driven Chief Information Officer (CIO) with a distinguished career spanning information systems analysis and technical project management. With a proven track record of spearheading the design and delivery of cutting-edge Information Management solutions, he has consistently elevated business operations, streamlined reporting functions, and maximized process efficiency.
Certified as an ISO/IEC 27001: Information Security Management Systems (ISMS) Lead Implementer, Data Protection Officer, and Cyber Risks Analyst, Denis brings a heightened focus on data security, privacy, and cyber resilience to every endeavor.
His expertise extends across a diverse spectrum of reporting, database, and web development applications, underpinned by an exceptional grasp of data storage and virtualization technologies. His proficiency in application testing, database administration, and data cleansing ensures seamless execution of complex projects.
What sets Denis apart is his comprehensive understanding of Business and Systems Analysis technologies, honed through involvement in all phases of the Software Development Lifecycle (SDLC). From meticulous requirements gathering to precise analysis, innovative design, rigorous development, thorough testing, and successful implementation, he has consistently delivered exceptional results.
Throughout his career, he has taken on multifaceted roles, from leading technical project management teams to owning solutions that drive operational excellence. His conscientious and proactive approach is unwavering, whether he is working independently or collaboratively within a team. His ability to connect with colleagues on a personal level underscores his commitment to fostering a harmonious and productive workplace environment.
Date: May 29, 2024
Tags: Information Security, ISO/IEC 27001, ISO/IEC 42001, Artificial Intelligence, GDPR
-------------------------------------------------------------------------------
Find out more about ISO training and certification services
Training: ISO/IEC 27001 Information Security Management System - EN | PECB
ISO/IEC 42001 Artificial Intelligence Management System - EN | PECB
General Data Protection Regulation (GDPR) - Training Courses - EN | PECB
Webinars: https://pecb.com/webinars
Article: https://pecb.com/article
-------------------------------------------------------------------------------
For more information about PECB:
Website: https://pecb.com/
LinkedIn: https://www.linkedin.com/company/pecb/
Facebook: https://www.facebook.com/PECBInternational/
Slideshare: http://www.slideshare.net/PECBCERTIFICATION
Introduction to AI for Nonprofits with Tapp Network
Dive into the world of AI! Experts Jon Hill and Tareq Monaur will guide you through AI's role in enhancing nonprofit websites and basic marketing strategies, making it easy to understand and apply.
How to Add Chatter in the odoo 17 ERP Module
In Odoo, the chatter is like a chat tool that helps you work together on records. You can leave notes and track things, making it easier to talk with your team and partners. Inside chatter, all communication history, activity, and changes will be displayed.
বাংলাদেশ অর্থনৈতিক সমীক্ষা (Economic Review) ২০২৪ UJS App.pdf
বাংলাদেশের অর্থনৈতিক সমীক্ষা ২০২৪ [Bangladesh Economic Review 2024 Bangla.pdf] কম্পিউটার , ট্যাব ও স্মার্ট ফোন ভার্সন সহ সম্পূর্ণ বাংলা ই-বুক বা pdf বই " সুচিপত্র ...বুকমার্ক মেনু 🔖 ও হাইপার লিংক মেনু 📝👆 যুক্ত ..
আমাদের সবার জন্য খুব খুব গুরুত্বপূর্ণ একটি বই ..বিসিএস, ব্যাংক, ইউনিভার্সিটি ভর্তি ও যে কোন প্রতিযোগিতা মূলক পরীক্ষার জন্য এর খুব ইম্পরট্যান্ট একটি বিষয় ...তাছাড়া বাংলাদেশের সাম্প্রতিক যে কোন ডাটা বা তথ্য এই বইতে পাবেন ...
তাই একজন নাগরিক হিসাবে এই তথ্য গুলো আপনার জানা প্রয়োজন ...।
বিসিএস ও ব্যাংক এর লিখিত পরীক্ষা ...+এছাড়া মাধ্যমিক ও উচ্চমাধ্যমিকের স্টুডেন্টদের জন্য অনেক কাজে আসবে ...
Recently uploaded (20)
How to Manage Your Lost Opportunities in Odoo 17 CRM
How to Manage Your Lost Opportunities in Odoo 17 CRM
BÀI TẬP BỔ TRỢ TIẾNG ANH 8 CẢ NĂM - GLOBAL SUCCESS - NĂM HỌC 2023-2024 (CÓ FI...
BÀI TẬP BỔ TRỢ TIẾNG ANH 8 CẢ NĂM - GLOBAL SUCCESS - NĂM HỌC 2023-2024 (CÓ FI...
How to Build a Module in Odoo 17 Using the Scaffold Method
How to Build a Module in Odoo 17 Using the Scaffold Method
Digital Artefact 1 - Tiny Home Environmental Design
Digital Artefact 1 - Tiny Home Environmental Design
Liberal Approach to the Study of Indian Politics.pdf
Liberal Approach to the Study of Indian Politics.pdf
Assessment and Planning in Educational technology.pptx
Assessment and Planning in Educational technology.pptx
Exploiting Artificial Intelligence for Empowering Researchers and Faculty, In...
Exploiting Artificial Intelligence for Empowering Researchers and Faculty, In...
ISO/IEC 27001, ISO/IEC 42001, and GDPR: Best Practices for Implementation and...
ISO/IEC 27001, ISO/IEC 42001, and GDPR: Best Practices for Implementation and...
Introduction to AI for Nonprofits with Tapp Network
Introduction to AI for Nonprofits with Tapp Network
বাংলাদেশ অর্থনৈতিক সমীক্ষা (Economic Review) ২০২৪ UJS App.pdf
বাংলাদেশ অর্থনৈতিক সমীক্ষা (Economic Review) ২০২৪ UJS App.pdf
Workshop3_Yuvadee
- 1. 0 50,000 100,000 150,000 200,000 250,000 300,000 350,000 400,000 Nancy Andrew Janet Margaret Steven Michael Robert Laura Anne Sales vs Target 2014 Sales Target