workchoiceandscarcity-230617065233-76b52255.pdf
•
0 likes•2 views
This document was derived from the Economics Scope for Economics Year 1 (Witswatersrand) . It covers concepts on work, choice and scarcity .
Report
Share
Report
Share
Download to read offline

Recommended
Engineering Economy - WEEK 1.pdf
1) The contractor must choose between two sites for a new highway mixing plant, with Site A having a shorter average hauling distance but higher rental costs than Site B.
2) Comparing the fixed, variable, and total costs of each site shows Site A to have higher total costs of BD573,000 compared to BD503,000 for Site B.
3) For the contractor to start making a profit being paid BD12 per cubic yard delivered, the breakeven point is delivering 24,200 cubic yards to cover the total costs of BD90,750 plus hauling costs.
Ms 09 managerial economics
This document provides information about obtaining fully solved assignments from an assignment help service. It lists an email address and phone number to contact for assistance with MBA course assignments. It then provides a sample assignment for the Managerial Economics course, covering all blocks and due by April 30th, 2014. The assignment includes 6 questions relating to topics like opportunity cost, demand curves, cost functions, oligopolistic markets, and the effects of supply and demand shifts. It concludes with a request to submit the completed assignment to the study center coordinator.
Consumer preference and choice(production theory)
Consumer preferences and choices are based on the utility or satisfaction derived from consuming goods. There are two views on utility - the cardinal view which measures utility in quantifiable units, and the ordinal view which ranks preferences. The law of diminishing marginal utility and equimarginal utility principle explain how consumption changes with price. Indifference curves illustrate preferences graphically on a budget constraint. Consumer equilibrium maximizes utility subject to the budget. Revealed preference theory observes consumer behavior. Consumer surplus measures the benefit consumers gain when price is below what they are willing to pay.
Ms 09 managerial economics (1)
Dear students get fully solved assignments
Send your semester & Specialization name to our mail id :
“ help.mbaassignments@gmail.com ”
or
Call us at : 08263069601
(Prefer mailing. Call in emergency )
How to Analyze the Results of LinearPrograms—Part 2 Price I.docx
How to Analyze the Results of Linear
Programs—Part 2: Price Interpretation
HARVEY J. GREENBERG Mathematics Department
University of Colorado at Deliver
POBoxU3364
Denver, Colorado 80217-3364
In the second part of a four-part series, I consider an exercise in
analysis that arises in many applications: Why is the price of
(some co77imodityy equal to (whatever its solution valuey? The
ability to interpret dual prices in a linear programming solution
is part of economic analysis, and the mathematical basis is as
old as linear programming, itself. New approaches, however,
go beyond the usual duality arguments in answering this ques-
tion in more practical terms. One of these new approaches is
path tracing, which seeks a portion of the linear program that
accounts for the row's price by activity costs from sources to
the row. In some cases this is a simple path in a network prob-
lem. More generally, in ordinary network terms, it can be a tree
or involve embedded cycles, but it is regarded as a path in
hypergraph terms.
T his paper is concerned with interpret- and partly because of its simplicity. 1 shall
ing dual prices in an optima! instance show how we can go deeper into explain-
of a linear program. 1 use terms and con- ing why a price has a particular value at
cepts that were introduced in Part 1 optimality. Then, I shall consider another
[Greenberg 1993a] of this series. problem, witb which I shall illustrate a
I shall begin with the transportation path tracing procedure. After stepping
problem, partly because of its familiarity through the analysis as an LP expert, I
CDpyn^hl "- iyy3, Thf Insliluli' of Mdn^gi'mL-nt SCKncvs PROGRAMMING—LINLAR
OO91-2lO2/')3/2305/0O97$(ll.25
This paper was refereed.
INTERFACES 23: 5 September-October 1993 {pp. 97-114)
GREENBERG
shall demonstrate automatic interpretation
with the ANALYZE rule-base [Greenberg
1988, 1993b].
Transportation Problem
1 start with the transportation problem.
We are given a set of suppliers, which t
denote by / in the set [ 1, 2, . . . , m}, and a
set of consumers, which I denote by / in
the set {I, 2, . . . , n\. The /-th supplier has
s, units, and the j-th consumer demands d,
units. Assume total supply is at least as
great as total demand: 2, s, > Z,tf,. The
cost to ship one unit from the /-th supplier
to the ;'-th consumer is c,,, and assume total
cost is a linear function of shipment levels.
An algebraic formulation is given by
minimize
subject to
X > 0;
2 -v,y < S; for / - 1, . . . , m;
I
2 y:,, ^ df for ; =̂ 1, . . . , n.
A solution to an instance of the trans-
portation problem not only gives optimal
levels of flows, x*, but also gives dual
prices associated with the constraints. Let
us interpret these prices with a few basic
properties, then I shall consider numerical
examples to go deeper into price interpre-
tation.
Let Xi be the /-th supplier price, and let
TT, be the/-th consumer price. Mathemati-
cally, the dual linear program is given by
maximize
subje ...
3. eng. cost and estimation
This document provides an overview of engineering cost estimation. It defines various types of engineering cost estimates such as rough, semi-detailed, and detailed estimates. It discusses common difficulties in making cost estimates such as one-of-a-kind estimates and limitations of time and resources. The document also describes several common mathematical models used for cost estimating, including the per unit model, segmenting model, cost indexes, power-sizing model, and triangulation. It provides examples of how to use these models to estimate costs. Finally, it discusses the impact of learning curves on cost estimates over time.
3 150316005311-conversion-gate01
This document provides an overview of engineering cost estimation. It defines various types of engineering cost estimates such as rough, semi-detailed, and detailed estimates. It discusses common difficulties in making cost estimates such as one-of-a-kind estimates and limitations of time and resources. The document also describes several common mathematical models used for cost estimating, including the per unit model, segmenting model, cost indexes, power-sizing model, and triangulation. It provides examples of how to use these models to estimate costs. Finally, it discusses the impact of learning curves on cost estimates over time.
Ap microeconomics revew slides
This document provides an overview and outline of topics covered on the AP Microeconomics exam, including:
I. Basic economic concepts like scarcity, opportunity cost, and production possibilities frontier.
II. Economic systems such as command, market and mixed economies as well as concepts like allocative and productive efficiency.
III. Supply and demand including determinants, equilibrium, price ceilings and floors, and government policies.
IV. Elasticity including price, income and cross price elasticity, and the impact of taxes.
V. Consumer choice and the utility maximization rule.
VI. Costs of production including the production function, total, average and marginal costs.
VII.
7 utility
IC2
Q Good X
Substitution Effect
The document discusses concepts of utility theory including cardinal and ordinal utility, law of diminishing marginal utility, indifference curves, and consumer equilibrium. It provides explanations and diagrams to illustrate:
- The law of diminishing marginal utility and how total utility and marginal utility are related.
- Indifference curves and how they represent combinations of goods that provide the same level of satisfaction.
- How a consumer reaches equilibrium where marginal utility per dollar spent is equal across all goods, given prices and income.
- How changes in income or prices can shift the budget line or indifference curves and impact equilibrium.
Mb0048 operations research
Dear students get fully solved assignments
Send your semester & Specialization name to our mail id :
help.mbaassignments@gmail.com
or
call us at : 08263069601
Imt 20 managerial economics m1
The document discusses marginalism and incrementalism, and provides examples to distinguish between the two concepts. It states that marginalism focuses on unit changes in goods created or sold, and how those relate to consumer choice and demand. Incrementalism considers "chunk changes" in more than one independent variable at a time, and is more flexible than marginalism. The document also provides several other distinctions between the two principles.
Sener salci 2018 04-24
The document discusses third-degree price discrimination, where a firm can segment consumers based on observable characteristics and charge different prices to different groups. Under third-degree price discrimination, optimal profits are achieved by separating markets and setting different prices (pa ≠ pb) in each. However, whether using single or multiple prices, monopoly pricing depends on demand characteristics like price elasticity. The firm finds the profit-maximizing quantities (qa* and qb*) and corresponding prices (pa* and pb*) by setting marginal revenue equal to marginal cost in each market. The market with less elastic demand will face a higher price and larger markup over cost.
Indifference curve analysis
Macro Economics
For downloading this contact- bikashkumar.bk100@gmail.com
Prepared by Students of University of Rajshahi
Arif Hossain
Md.Abdul Aual
Risul Islam
Abul Kalam
MD Rasel Mollah
MD Rabiul Islam
B-COM PART 1 Eco 2014 r solved
Professor Hicks and Allen developed the indifference curve approach in 1928 as an improvement over earlier approaches that assumed utility could be measured and that consumers only purchase one good at a time. The indifference curve approach is based on ordinal utility and assumes consumers are interested in combinations of goods. It assumes rational consumer behavior, ordinal and non-satiable utility, diminishing marginal rate of substitution, consistency in choices, and that preferences are not contradictory. Goods are substitutable, so the consumer is indifferent between combinations that provide the same satisfaction. Indifference curves illustrate combinations that provide equal utility.
Single Resource Revenue Management Problems withDependent De.docx
Single Resource Revenue Management Problems with
Dependent Demands c©
Guillermo Gallego
Spring 2013
Abstract
Providers of perishable capacity, such as airline seats and hotel rooms, use market
segmentation tools to sell the same capacity to different customers at difference prices.
They impose time-of-purchase and usage restrictions such as Saturday Night stays on
low fares to increase demand while limiting bookings to prevent demand cannibalization
from customers who book late and travel for business. Capacity providers may also
bundle or unbundle ancillary services such as advance seat selection, meals, mileage
accrual, and luggage handling to justify price differences for the same basic service. We
will assume that the fare class structure (a menu of prices, restrictions and ancillary
services) is given and that the capacity provider’s goal is to allocate capacity among
fare classes to maximize expected revenues net of the cost of the ancillary services.
We assume that customer demand is governed by a discrete choice model and depends
on the products available for sale. Thus, if a customer does not find his preferred
product, he may decide not to purchase or to purchase an alternative product in the
offer set. The problem is to decide, at each state, which set of products to make available
for sale. Since there are an exponential number of sets that can be offered, we study
the structure of the optimization problem to define and characterize efficient sets with
the purpose of reducing the dimensionality of the optimization problem and to obtain
insights into the type of products, e.g., nested-by-fares, that may be optimal to offer. We
provide a dynamic programming formulation for the revenue management problem and
use fare and demand transformations to relate it to the formulation of the independent
demand model. We present an upper bound on the value function throughout the use
of approximate dynamic programming with affine functions. A formulation that does
not allow fares to be opened once they are closed is also presented. We then turn
our attention to static models, where the time element is suppressed. We present an
optimal solution to the two fare problem and an efficient heuristic for the multi-fare
case. Numerical examples show that the proposed heuristic works almost as well as the
optimal solution for the restricted dynamic programming model where fares cannot be
reopened once they are closed.
1
1 Introduction
Suppliers of perishable capacity often offer a menu of products that vary in terms of price and
quality. If the products differ only on price we would expect most, if not all, customers to
buy the lowest priced product that gives him a positive surplus and to walk away otherwise.
When differences in quality are also present, customers do not always buy the lowest priced
product. As an example, a customer may be willing to pay an extra $50 for a room with an
ocean view or $29 for advance seat selection and priority.
MC0079 SMU 2013 Falll Session
This document contains an assignment submission for a course on computer based optimization methods. It includes the student's name, registration number, learning center details, course and subject information, date of submission, and spaces for marks awarded and evaluator signatures.
The document also contains the student's answers to 4 questions. The questions are about applications of operations research, Erlang distributions, solving a linear programming problem graphically, and using finite queuing tables. The student provides detailed responses to each question discussing the relevant concepts.
Economics 100 most important questions cbse
This document contains model answers to 16 common economics questions. It begins by defining key economic concepts like scarcity, economic problem, and opportunity cost. It then discusses production possibility curve and different types of economic problems like what to produce and how to produce. Other topics covered include demand and its determinants, law of demand, consumer equilibrium using indifference curve approach, and effects of price changes of related goods on demand. For each question, the response provides a clear and concise answer along with examples to illustrate key economic principles.
Costs and revenues
This document provides an overview of key cost and revenue concepts for businesses. It defines accounting costs, opportunity costs, fixed costs, variable costs, average costs, marginal costs, sunk costs, total revenue, average revenue and marginal revenue. It explains how these concepts are used in business decision making and their relationships through diagrams of cost and revenue curves.
Micro economics - Summary for CPT
The document provides an overview of economics concepts including:
- Production, factors of production, production functions, and laws of returns.
- Demand, determinants of demand, demand schedules/curves, price elasticity, and income elasticity.
- Costs including economic costs, direct/indirect costs, cost functions, and average/marginal costs.
- Price determination including equilibrium price, demand and supply shifts, perfect competition equilibrium, and monopolistic equilibrium.
COST-BENEFIT ANALYSIS (2010)-1.ppt
This document provides information on cost-benefit analysis (CBA) and how it can be used to evaluate the economic feasibility of projects. It discusses how CBA works by quantifying and comparing the costs and benefits of a project in monetary terms. A key decision criterion is the benefit-cost ratio (BCR), where a project is acceptable if BCR is greater than 1. The document also outlines limitations of CBA and challenges in applying it to social projects due to difficulties in valuation of certain costs and benefits.
The general economic environment
There are numerous general economic concepts that must be taken into account in engineering studies.
In broad terms, economics deals with the interactions between people and wealth, and engineering is concerned with the cost-effective use of
scientific knowledge to benefit humankind.
This section introduces some of these basic economic concepts and indicates how they may be factors for consideration in engineering studies and managerial decisions.
Consumer prefrence and choice
The document discusses consumer preferences and choice. It defines utility as the satisfaction derived from consumption and explains the concepts of total utility, marginal utility, and diminishing marginal utility. It contrasts cardinal and ordinal utility analysis, discussing indifference curves and how consumers seek to maximize utility subject to their budget constraint. The summary also mentions revealed preference theory, consumer equilibrium conditions, and how consumer surplus is measured as the difference between the maximum price consumers are willing to pay versus the actual price.
Economics
Economics can be defined as a social science that is studied about the behavior of people.
“A social science that deals with how consumers, producers and societies choose alternatives, among uses of scarce resources in process of producing, exchanging and consuming goods and services.”
eco.pdf
u agdjkfaiwe sfaifhqiwehriqwhfjas fa efaehtilahetriquhewt qfiqaehtqiehti3qe rqihtqiwehiq3h4 fqierhqiewrhqehyr5i43gtigqe ietqgirqprhqituq4 qerheirhqiouer erqrgqo qwherqi3r rq3iroq qorq34 rqi3ergq rqith43 q tq4i q4ir qi3qirq ietq49thqrj3qn4tnq4tqn vi34tqn q34rnqi3 4rw3itwht w4itw 4t4itw rt4 t iw34th4yt rtp34t
iueriqeri74 qiwiretq eq6t4b7 8qi rqer9 iew q q9ewyqi erqvy ieiiqo oeutiqehtv ieirqiegriq43hgrq pwerqwegrqi3grqiegtrq3r
Solucion(5)
This document provides teaching notes for a chapter on the costs of production. It discusses key topics like accounting versus economic costs, definitions of total, average and marginal costs, and cost minimization. It emphasizes distinguishing accounting and economic costs, understanding cost curves, and how costs relate to profit maximization and the supply curve. It provides questions to review the chapter, including questions about opportunity costs, true/false statements about costs, implications of marginal costs, cost minimization, and properties of isocost lines.
Micro economics tools for health economics
This document provides an outline of microeconomic tools that are useful for health economics. It discusses concepts like scarcity, opportunity cost, efficiency, demand, supply, market equilibrium, elasticity, consumer theory including indifference curves and budget constraints, and production possibility frontiers. Key points covered include the law of demand and supply, how demand and supply curves are derived, factors that shift curves like income, prices of substitutes and complements. It also discusses technical efficiency, cost-effective efficiency and allocative efficiency.
Chapter 11 pricing with market power
The document discusses various pricing strategies firms can use when they have market power, including price discrimination, peak-load pricing, and two-part tariffs. It explains how firms can segment markets and charge different prices to maximize profits by capturing consumer surplus. Specifically, it covers first-degree, second-degree, and third-degree price discrimination, and discusses examples like airlines, movies, and electricity pricing. The two-part tariff is introduced as a strategy to separate the decision to purchase a good into two prices: a fixed entry fee and a variable usage fee.
Natural Reso cha 3-1.pptx
This document discusses the concepts of efficiency, costs, and benefits in allocating resources. It defines static and dynamic efficiency. Static efficiency is achieved when marginal benefits from a resource allocation equal marginal costs, maximizing net benefits. The market equilibrium satisfies static efficiency. Total benefits are measured by the area under the demand curve, and total costs by the area under the supply curve. Consumers and producers both gain from trade, capturing benefits in the form of consumer and producer surplus, respectively. Dynamic efficiency considers intertemporal allocation and how decisions made now impact future consumption and production possibilities.
PEARSON CORRELATION ANALYSIS STATISTICS .pdf
This document consists of examples on the pearson correlation analysis as well as the regression equation
INDEX NUMBERS FORMULAE STATISTICS ANSWER BOOKpdf
This worksheet comprises on formulae for laspeyres and paasche price and quantity index
More Related Content
Similar to workchoiceandscarcity-230617065233-76b52255.pdf
7 utility
IC2
Q Good X
Substitution Effect
The document discusses concepts of utility theory including cardinal and ordinal utility, law of diminishing marginal utility, indifference curves, and consumer equilibrium. It provides explanations and diagrams to illustrate:
- The law of diminishing marginal utility and how total utility and marginal utility are related.
- Indifference curves and how they represent combinations of goods that provide the same level of satisfaction.
- How a consumer reaches equilibrium where marginal utility per dollar spent is equal across all goods, given prices and income.
- How changes in income or prices can shift the budget line or indifference curves and impact equilibrium.
Mb0048 operations research
Dear students get fully solved assignments
Send your semester & Specialization name to our mail id :
help.mbaassignments@gmail.com
or
call us at : 08263069601
Imt 20 managerial economics m1
The document discusses marginalism and incrementalism, and provides examples to distinguish between the two concepts. It states that marginalism focuses on unit changes in goods created or sold, and how those relate to consumer choice and demand. Incrementalism considers "chunk changes" in more than one independent variable at a time, and is more flexible than marginalism. The document also provides several other distinctions between the two principles.
Sener salci 2018 04-24
The document discusses third-degree price discrimination, where a firm can segment consumers based on observable characteristics and charge different prices to different groups. Under third-degree price discrimination, optimal profits are achieved by separating markets and setting different prices (pa ≠ pb) in each. However, whether using single or multiple prices, monopoly pricing depends on demand characteristics like price elasticity. The firm finds the profit-maximizing quantities (qa* and qb*) and corresponding prices (pa* and pb*) by setting marginal revenue equal to marginal cost in each market. The market with less elastic demand will face a higher price and larger markup over cost.
Indifference curve analysis
Macro Economics
For downloading this contact- bikashkumar.bk100@gmail.com
Prepared by Students of University of Rajshahi
Arif Hossain
Md.Abdul Aual
Risul Islam
Abul Kalam
MD Rasel Mollah
MD Rabiul Islam
B-COM PART 1 Eco 2014 r solved
Professor Hicks and Allen developed the indifference curve approach in 1928 as an improvement over earlier approaches that assumed utility could be measured and that consumers only purchase one good at a time. The indifference curve approach is based on ordinal utility and assumes consumers are interested in combinations of goods. It assumes rational consumer behavior, ordinal and non-satiable utility, diminishing marginal rate of substitution, consistency in choices, and that preferences are not contradictory. Goods are substitutable, so the consumer is indifferent between combinations that provide the same satisfaction. Indifference curves illustrate combinations that provide equal utility.
Single Resource Revenue Management Problems withDependent De.docx
Single Resource Revenue Management Problems with
Dependent Demands c©
Guillermo Gallego
Spring 2013
Abstract
Providers of perishable capacity, such as airline seats and hotel rooms, use market
segmentation tools to sell the same capacity to different customers at difference prices.
They impose time-of-purchase and usage restrictions such as Saturday Night stays on
low fares to increase demand while limiting bookings to prevent demand cannibalization
from customers who book late and travel for business. Capacity providers may also
bundle or unbundle ancillary services such as advance seat selection, meals, mileage
accrual, and luggage handling to justify price differences for the same basic service. We
will assume that the fare class structure (a menu of prices, restrictions and ancillary
services) is given and that the capacity provider’s goal is to allocate capacity among
fare classes to maximize expected revenues net of the cost of the ancillary services.
We assume that customer demand is governed by a discrete choice model and depends
on the products available for sale. Thus, if a customer does not find his preferred
product, he may decide not to purchase or to purchase an alternative product in the
offer set. The problem is to decide, at each state, which set of products to make available
for sale. Since there are an exponential number of sets that can be offered, we study
the structure of the optimization problem to define and characterize efficient sets with
the purpose of reducing the dimensionality of the optimization problem and to obtain
insights into the type of products, e.g., nested-by-fares, that may be optimal to offer. We
provide a dynamic programming formulation for the revenue management problem and
use fare and demand transformations to relate it to the formulation of the independent
demand model. We present an upper bound on the value function throughout the use
of approximate dynamic programming with affine functions. A formulation that does
not allow fares to be opened once they are closed is also presented. We then turn
our attention to static models, where the time element is suppressed. We present an
optimal solution to the two fare problem and an efficient heuristic for the multi-fare
case. Numerical examples show that the proposed heuristic works almost as well as the
optimal solution for the restricted dynamic programming model where fares cannot be
reopened once they are closed.
1
1 Introduction
Suppliers of perishable capacity often offer a menu of products that vary in terms of price and
quality. If the products differ only on price we would expect most, if not all, customers to
buy the lowest priced product that gives him a positive surplus and to walk away otherwise.
When differences in quality are also present, customers do not always buy the lowest priced
product. As an example, a customer may be willing to pay an extra $50 for a room with an
ocean view or $29 for advance seat selection and priority.
MC0079 SMU 2013 Falll Session
This document contains an assignment submission for a course on computer based optimization methods. It includes the student's name, registration number, learning center details, course and subject information, date of submission, and spaces for marks awarded and evaluator signatures.
The document also contains the student's answers to 4 questions. The questions are about applications of operations research, Erlang distributions, solving a linear programming problem graphically, and using finite queuing tables. The student provides detailed responses to each question discussing the relevant concepts.
Economics 100 most important questions cbse
This document contains model answers to 16 common economics questions. It begins by defining key economic concepts like scarcity, economic problem, and opportunity cost. It then discusses production possibility curve and different types of economic problems like what to produce and how to produce. Other topics covered include demand and its determinants, law of demand, consumer equilibrium using indifference curve approach, and effects of price changes of related goods on demand. For each question, the response provides a clear and concise answer along with examples to illustrate key economic principles.
Costs and revenues
This document provides an overview of key cost and revenue concepts for businesses. It defines accounting costs, opportunity costs, fixed costs, variable costs, average costs, marginal costs, sunk costs, total revenue, average revenue and marginal revenue. It explains how these concepts are used in business decision making and their relationships through diagrams of cost and revenue curves.
Micro economics - Summary for CPT
The document provides an overview of economics concepts including:
- Production, factors of production, production functions, and laws of returns.
- Demand, determinants of demand, demand schedules/curves, price elasticity, and income elasticity.
- Costs including economic costs, direct/indirect costs, cost functions, and average/marginal costs.
- Price determination including equilibrium price, demand and supply shifts, perfect competition equilibrium, and monopolistic equilibrium.
COST-BENEFIT ANALYSIS (2010)-1.ppt
This document provides information on cost-benefit analysis (CBA) and how it can be used to evaluate the economic feasibility of projects. It discusses how CBA works by quantifying and comparing the costs and benefits of a project in monetary terms. A key decision criterion is the benefit-cost ratio (BCR), where a project is acceptable if BCR is greater than 1. The document also outlines limitations of CBA and challenges in applying it to social projects due to difficulties in valuation of certain costs and benefits.
The general economic environment
There are numerous general economic concepts that must be taken into account in engineering studies.
In broad terms, economics deals with the interactions between people and wealth, and engineering is concerned with the cost-effective use of
scientific knowledge to benefit humankind.
This section introduces some of these basic economic concepts and indicates how they may be factors for consideration in engineering studies and managerial decisions.
Consumer prefrence and choice
The document discusses consumer preferences and choice. It defines utility as the satisfaction derived from consumption and explains the concepts of total utility, marginal utility, and diminishing marginal utility. It contrasts cardinal and ordinal utility analysis, discussing indifference curves and how consumers seek to maximize utility subject to their budget constraint. The summary also mentions revealed preference theory, consumer equilibrium conditions, and how consumer surplus is measured as the difference between the maximum price consumers are willing to pay versus the actual price.
Economics
Economics can be defined as a social science that is studied about the behavior of people.
“A social science that deals with how consumers, producers and societies choose alternatives, among uses of scarce resources in process of producing, exchanging and consuming goods and services.”
eco.pdf
u agdjkfaiwe sfaifhqiwehriqwhfjas fa efaehtilahetriquhewt qfiqaehtqiehti3qe rqihtqiwehiq3h4 fqierhqiewrhqehyr5i43gtigqe ietqgirqprhqituq4 qerheirhqiouer erqrgqo qwherqi3r rq3iroq qorq34 rqi3ergq rqith43 q tq4i q4ir qi3qirq ietq49thqrj3qn4tnq4tqn vi34tqn q34rnqi3 4rw3itwht w4itw 4t4itw rt4 t iw34th4yt rtp34t
iueriqeri74 qiwiretq eq6t4b7 8qi rqer9 iew q q9ewyqi erqvy ieiiqo oeutiqehtv ieirqiegriq43hgrq pwerqwegrqi3grqiegtrq3r
Solucion(5)
This document provides teaching notes for a chapter on the costs of production. It discusses key topics like accounting versus economic costs, definitions of total, average and marginal costs, and cost minimization. It emphasizes distinguishing accounting and economic costs, understanding cost curves, and how costs relate to profit maximization and the supply curve. It provides questions to review the chapter, including questions about opportunity costs, true/false statements about costs, implications of marginal costs, cost minimization, and properties of isocost lines.
Micro economics tools for health economics
This document provides an outline of microeconomic tools that are useful for health economics. It discusses concepts like scarcity, opportunity cost, efficiency, demand, supply, market equilibrium, elasticity, consumer theory including indifference curves and budget constraints, and production possibility frontiers. Key points covered include the law of demand and supply, how demand and supply curves are derived, factors that shift curves like income, prices of substitutes and complements. It also discusses technical efficiency, cost-effective efficiency and allocative efficiency.
Chapter 11 pricing with market power
The document discusses various pricing strategies firms can use when they have market power, including price discrimination, peak-load pricing, and two-part tariffs. It explains how firms can segment markets and charge different prices to maximize profits by capturing consumer surplus. Specifically, it covers first-degree, second-degree, and third-degree price discrimination, and discusses examples like airlines, movies, and electricity pricing. The two-part tariff is introduced as a strategy to separate the decision to purchase a good into two prices: a fixed entry fee and a variable usage fee.
Natural Reso cha 3-1.pptx
This document discusses the concepts of efficiency, costs, and benefits in allocating resources. It defines static and dynamic efficiency. Static efficiency is achieved when marginal benefits from a resource allocation equal marginal costs, maximizing net benefits. The market equilibrium satisfies static efficiency. Total benefits are measured by the area under the demand curve, and total costs by the area under the supply curve. Consumers and producers both gain from trade, capturing benefits in the form of consumer and producer surplus, respectively. Dynamic efficiency considers intertemporal allocation and how decisions made now impact future consumption and production possibilities.
Similar to workchoiceandscarcity-230617065233-76b52255.pdf (20)
Single Resource Revenue Management Problems withDependent De.docx
Single Resource Revenue Management Problems withDependent De.docx
More from Alison Tutors
PEARSON CORRELATION ANALYSIS STATISTICS .pdf
This document consists of examples on the pearson correlation analysis as well as the regression equation
INDEX NUMBERS FORMULAE STATISTICS ANSWER BOOKpdf
This worksheet comprises on formulae for laspeyres and paasche price and quantity index
MEASURES OF CENTRAL TENDENCY STATISTICS pdf
This document comprises of notes and formulaes on measures of central tendency
BCOM STATISTICS EXAM PAPER 1 REGENT COLLEGE
This document comprises of answers on Exam Paper 1 BCom Statistics from Regent College
CONTINGENCY TABLES STATISTICS EXAMPLES .pdf
This document consists of examples on Contingency tables.
MEASURES OF DISPERSION STATISTICS NOTESpdf
This document consists of notes on measures of dispersion . It tests on concepts such as
-calculation of range
-Interquartile range
-standard deviation
-variance
-mean
INTEREST EDUVOS MATHEMATICS QUESTIONS .pdf
This document comprises of questions on Interest . It tests on the following concepts
-Calculating Accumulated Value given Simple interest
-Calculating Accumulated Value given Compound Interest
-Calculating Principle, Number of years , interest rate for simple and compound interest
CamScanner 06-10-2024 18.56.pdf MATHS ANSWERS
This document comprises of answers for the previously uploaded document
QUADRATICS AS LEVEL (1) MATHEMATICS .pdf
These questions are based on Quadratics.
Q1- FM 2023 12
Q2- MJ 2023 11
Q3- MJ 2023 12
Q4- MJ 2023 12
Q5- FM 2022 12
Q6- FM 2022 12
Q7- MJ 2022 11
Q8- MJ 2022 13
Q9- ON 2022 12
Q10- FM 2021 12
Q11- MJ 2021 11
Q12- MJ 2021 12
Q13- MJ 2021 13
Q14- ON 2021 11
Q15- MJ 2020 11
Q16 - MJ 2020 12
Q17- MJ 2020 13
Q18
Q19- ON 2020 12
Q20- ON 2020 13
Q21- MJ 2019 11
Q22- MJ 2019 13
BUSINESS MANAGEMENT CH1&2 END OF CHAPTER QUESTIONS.pdf
This document is based on Business Management module from Mancosa. It has 2 chapters thus:
- The nature of international business management
-International Trade and Investment
PERCENTAGES EDUVOS MATHEMATICS PRACTICE QUESTIONS.pdf
This document comprises of questions on Percentages from Eduvos Study notes. The concepts being tested include:
- conversion of percentages to fractions
-conversion of decimals to fractions
- calculating percentage increase or decrease
- ratios
MATHS ASSIGNMENT 1 GCSE PRACTICE QUESTIONS .pdf
These questions were based on November 2022 and June 2022 GCSE Questions
POM 3 JUNE 2022 PROJECT MANAGEMENT QUESTION.pdf
This document has questions on Project management asked in the paper 3 June 2022
The paper tested on the following concepts :
-steps involved in creating a feasibility study
-definition of project manager and project management
-responsibilities of a project manager
-project management methodology
-Work Breakdown Structure
-Net Present Value
POM 100 11 NOVEMBER STADIO NOTES GUIDE.pdf
This document contains answers for a Project Management Question Paper from 11 November 2023.
It tests the following concepts
-Types of feasibility
- Responsibilities of a project manager
-Project life cycle
-Work Breakdown Structure
- Stakeholder Analysis
PROJECT MANAGEMENT 2 (1) STADIO COURSES.pdf
This document comprises of topics based on The Project Management, the project manager and project lifecycle.
The concepts being tackled include:
-definition of project manager
-responsibilities of a project manager
-stages in the project management lifecycle
-organizational strategy
-Main functions of PMO
PROJECT MANAGEMENT 1 STADIO SECOND YEAR.pdf
This document comprises of notes from Chapter 1 and Chapter 4 from STADIO
Chapter 1 assesses the following :
- differentiating between different types of feasibility and detailing the process of conducting a feasibility study
-applying the best practice to create the components of the proposal
- applying the knowledge of project initiation process to both fictional and real-life cases and scenarios
Chapter 4 focuses on project stakeholders and scope.
The topic covers the following:
- explaining the role and importance of project stakeholders
- identifying project stakeholders in a project and the key characteristic of each
-create a project charter
- defining a project's scope and highlight its purpose
TRIGONOMETRY (1) GRADE 10 MATHEMATICS.pdf
Questions are based on Trigonometry and were taken from 2022& 2023 papers
EUCLIDEAN GEOMETRY ANSWER BANK GRADE 10 MATHS.pdf
This document has answers on Euclidean Geometry
Questions were taken from 2022 & 2023
EUCLIDEAN GEOMETRY (1) GRADE 10 MATHEMATICS .pdf
These questions largely revolve on proofs. They were taken from 2022 & 2023 papers
More from Alison Tutors (20)
BUSINESS MANAGEMENT CH1&2 END OF CHAPTER QUESTIONS.pdf
BUSINESS MANAGEMENT CH1&2 END OF CHAPTER QUESTIONS.pdf
PERCENTAGES EDUVOS MATHEMATICS PRACTICE QUESTIONS.pdf
PERCENTAGES EDUVOS MATHEMATICS PRACTICE QUESTIONS.pdf
Recently uploaded
LAND USE LAND COVER AND NDVI OF MIRZAPUR DISTRICT, UP
This Dissertation explores the particular circumstances of Mirzapur, a region located in the
core of India. Mirzapur, with its varied terrains and abundant biodiversity, offers an optimal
environment for investigating the changes in vegetation cover dynamics. Our study utilizes
advanced technologies such as GIS (Geographic Information Systems) and Remote sensing to
analyze the transformations that have taken place over the course of a decade.
The complex relationship between human activities and the environment has been the focus
of extensive research and worry. As the global community grapples with swift urbanization,
population expansion, and economic progress, the effects on natural ecosystems are becoming
more evident. A crucial element of this impact is the alteration of vegetation cover, which plays a
significant role in maintaining the ecological equilibrium of our planet.Land serves as the foundation for all human activities and provides the necessary materials for
these activities. As the most crucial natural resource, its utilization by humans results in different
'Land uses,' which are determined by both human activities and the physical characteristics of the
land.
The utilization of land is impacted by human needs and environmental factors. In countries
like India, rapid population growth and the emphasis on extensive resource exploitation can lead
to significant land degradation, adversely affecting the region's land cover.
Therefore, human intervention has significantly influenced land use patterns over many
centuries, evolving its structure over time and space. In the present era, these changes have
accelerated due to factors such as agriculture and urbanization. Information regarding land use and
cover is essential for various planning and management tasks related to the Earth's surface,
providing crucial environmental data for scientific, resource management, policy purposes, and
diverse human activities.
Accurate understanding of land use and cover is imperative for the development planning
of any area. Consequently, a wide range of professionals, including earth system scientists, land
and water managers, and urban planners, are interested in obtaining data on land use and cover
changes, conversion trends, and other related patterns. The spatial dimensions of land use and
cover support policymakers and scientists in making well-informed decisions, as alterations in
these patterns indicate shifts in economic and social conditions. Monitoring such changes with the
help of Advanced technologies like Remote Sensing and Geographic Information Systems is
crucial for coordinated efforts across different administrative levels. Advanced technologies like
Remote Sensing and Geographic Information Systems
9
Changes in vegetation cover refer to variations in the distribution, composition, and overall
structure of plant communities across different temporal and spatial scales. These changes can
occur natural.
How to Make a Field Mandatory in Odoo 17
In Odoo, making a field required can be done through both Python code and XML views. When you set the required attribute to True in Python code, it makes the field required across all views where it's used. Conversely, when you set the required attribute in XML views, it makes the field required only in the context of that particular view.
Executive Directors Chat Leveraging AI for Diversity, Equity, and Inclusion
Let’s explore the intersection of technology and equity in the final session of our DEI series. Discover how AI tools, like ChatGPT, can be used to support and enhance your nonprofit's DEI initiatives. Participants will gain insights into practical AI applications and get tips for leveraging technology to advance their DEI goals.
RPMS TEMPLATE FOR SCHOOL YEAR 2023-2024 FOR TEACHER 1 TO TEACHER 3
RPMS Template 2023-2024 by: Irene S. Rueco
PCOS corelations and management through Ayurveda.
This presentation includes basic of PCOS their pathology and treatment and also Ayurveda correlation of PCOS and Ayurvedic line of treatment mentioned in classics.
বাংলাদেশ অর্থনৈতিক সমীক্ষা (Economic Review) ২০২৪ UJS App.pdf
বাংলাদেশের অর্থনৈতিক সমীক্ষা ২০২৪ [Bangladesh Economic Review 2024 Bangla.pdf] কম্পিউটার , ট্যাব ও স্মার্ট ফোন ভার্সন সহ সম্পূর্ণ বাংলা ই-বুক বা pdf বই " সুচিপত্র ...বুকমার্ক মেনু 🔖 ও হাইপার লিংক মেনু 📝👆 যুক্ত ..
আমাদের সবার জন্য খুব খুব গুরুত্বপূর্ণ একটি বই ..বিসিএস, ব্যাংক, ইউনিভার্সিটি ভর্তি ও যে কোন প্রতিযোগিতা মূলক পরীক্ষার জন্য এর খুব ইম্পরট্যান্ট একটি বিষয় ...তাছাড়া বাংলাদেশের সাম্প্রতিক যে কোন ডাটা বা তথ্য এই বইতে পাবেন ...
তাই একজন নাগরিক হিসাবে এই তথ্য গুলো আপনার জানা প্রয়োজন ...।
বিসিএস ও ব্যাংক এর লিখিত পরীক্ষা ...+এছাড়া মাধ্যমিক ও উচ্চমাধ্যমিকের স্টুডেন্টদের জন্য অনেক কাজে আসবে ...
Natural birth techniques - Mrs.Akanksha Trivedi Rama University
Natural birth techniques - Mrs.Akanksha Trivedi Rama UniversityAkanksha trivedi rama nursing college kanpur.
Natural birth techniques are various type such as/ water birth , alexender method, hypnosis, bradley method, lamaze method etcPengantar Penggunaan Flutter - Dart programming language1.pptx
Pengantar Penggunaan Flutter - Dart programming language1.pptx
Digital Artifact 1 - 10VCD Environments Unit
Digital Artifact 1 - 10VCD Environments Unit - NGV Pavilion Concept Design
BBR 2024 Summer Sessions Interview Training
Qualitative research interview training by Professor Katrina Pritchard and Dr Helen Williams
Hindi varnamala | hindi alphabet PPT.pdf
हिंदी वर्णमाला पीपीटी, hindi alphabet PPT presentation, hindi varnamala PPT, Hindi Varnamala pdf, हिंदी स्वर, हिंदी व्यंजन, sikhiye hindi varnmala, dr. mulla adam ali, hindi language and literature, hindi alphabet with drawing, hindi alphabet pdf, hindi varnamala for childrens, hindi language, hindi varnamala practice for kids, https://www.drmullaadamali.com
Community pharmacy- Social and preventive pharmacy UNIT 5
Covered community pharmacy topic of the subject Social and preventive pharmacy for Diploma and Bachelor of pharmacy
DRUGS AND ITS classification slide share
Any substance (other than food) that is used to prevent, diagnose, treat, or relieve symptoms of a
disease or abnormal condition
Recently uploaded (20)
LAND USE LAND COVER AND NDVI OF MIRZAPUR DISTRICT, UP
LAND USE LAND COVER AND NDVI OF MIRZAPUR DISTRICT, UP
Pride Month Slides 2024 David Douglas School District
Pride Month Slides 2024 David Douglas School District
Executive Directors Chat Leveraging AI for Diversity, Equity, and Inclusion
Executive Directors Chat Leveraging AI for Diversity, Equity, and Inclusion
RPMS TEMPLATE FOR SCHOOL YEAR 2023-2024 FOR TEACHER 1 TO TEACHER 3
RPMS TEMPLATE FOR SCHOOL YEAR 2023-2024 FOR TEACHER 1 TO TEACHER 3
Digital Artefact 1 - Tiny Home Environmental Design
Digital Artefact 1 - Tiny Home Environmental Design
বাংলাদেশ অর্থনৈতিক সমীক্ষা (Economic Review) ২০২৪ UJS App.pdf
বাংলাদেশ অর্থনৈতিক সমীক্ষা (Economic Review) ২০২৪ UJS App.pdf
Natural birth techniques - Mrs.Akanksha Trivedi Rama University
Natural birth techniques - Mrs.Akanksha Trivedi Rama University
Pengantar Penggunaan Flutter - Dart programming language1.pptx
Pengantar Penggunaan Flutter - Dart programming language1.pptx
Community pharmacy- Social and preventive pharmacy UNIT 5
Community pharmacy- Social and preventive pharmacy UNIT 5
workchoiceandscarcity-230617065233-76b52255.pdf
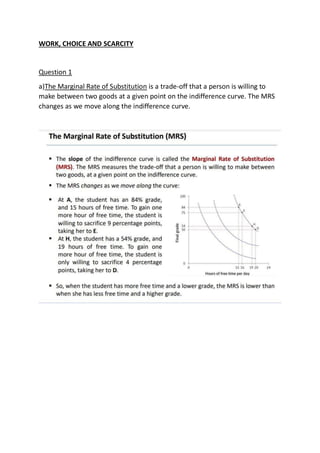
- 1. WORK, CHOICE AND SCARCITY Question 1 a)The Marginal Rate of Substitution is a trade-off that a person is willing to make between two goods at a given point on the indifference curve. The MRS changes as we move along the indifference curve.
- 2. S ..What is opportunity cost?
- 3. b) Marginal Rate of Transformation : measures the quantity of one good that must be sacrificed to acquire an additional one. This is the slope of feasible frontier. Please take note : c) Explain clearly with the aid of a diagram ,why an individual’s optimal choice must be at a point where MRS=MRT.
- 4. QUESTION 2
- 8. Please give the student the graph from drafted notes to try out Refer back to Q2 in the past paper Question 3 – refer to the memo . Only additional notes are given in this text 3a) feasible set is the set of goods that the consumer can afford to purchase
- 9. b) Use a diagram to explain why an individual’s indifference curves can never cross? Indifference curves never intersect because by definition , all points on the same curve represent equivalent satisfaction. If two curves were to overlap , then that would create a graph
- 11. MCQs Q1) D
- 13. Notes have been provided for the latter questions Q2) C Q3) B Q4) E Q5) E 2022 PAPERS Q5) D ….refer back to the diagram of the feasible frontier Q7) B MRT = change in y/ change in x (gradient) Anything that is in the Feasible frontier is not feasible
- 14. Increasing MRT= increasing opportunity cost constant MRT = constant opportunity cost Decreasing MRT = decreasing opportunity cost Q9) C Q10) – PLEASE SKIP FOR NOW Q11) A Employment Rents -Employees are paid more than their reservation option ( receiving employment rents) , so they prefer to be employed Employment rent= cost of job loss , which includes : -Lost income while searching for a job -costs required to start a new job eg relocation -loss of non-wage benefits eg medical insurance -social costs ( stigma of being unemployed ) Reservation wage= value of next best option Employment rent = wage – reservation wage- disutility of effort Q14) E Opportunity costs represents the potential benefits that an individual , investor or business misses out on when choosing one alternative over another. Economic costs are also known as opportunity costs, looking at the potential difference between taking one action over another . They measure both the explicit and implicit costs. Accounting costs are explicit costs that occur in exchange for a defined good or service . Q18) Marginal Product and Diminishing returns
- 15. The law of diminishing marginal returns ; as you add variable resources to fixed resources the additional output will eventually decrease . Workers Pizza Marginal Product 0 0 _ 1 5 5 2 15 10 3 20 5 4 22 2 5 22 0 6 18 -4 Law of diminishing marginal returns applies in short run while at least one production variable is kept constant Question 1 – Please refer to Question Paper 2020 QUESTION PAPER