Download to read offline


![Asseenfromourpreviousfigures,the numberof nodesmustbe perfectsquare of wholenumberinorder
to fill in our grid topology otherwise it will give an error.
Simulation:
For n=16 random topology:
From the figure above, it is clear that since node 8 and 16 becomes dead, the sender node 2 sends the
packet to receiver node 1 using route [2, 11, 1].](https://image.slidesharecdn.com/wirelesssensornetworkssimulation-160609104956/85/Wireless-sensor-networks-simulation-5-320.jpg)
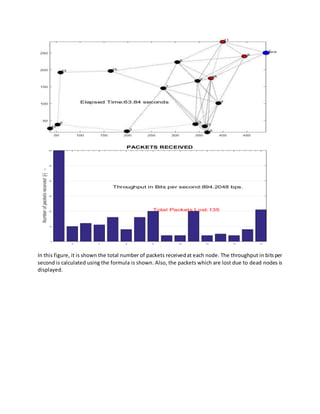


The document discusses a simulation model for wireless sensor networks (WSN) proposed by Milansimek, focusing on sensor placement, throughput, and energy consumption. It highlights the effects of dead nodes on routing and the relationship between the number of nodes and the overall mean energy consumption and packet loss. Results indicate that increasing the number of nodes decreases packet loss and mean energy consumption.