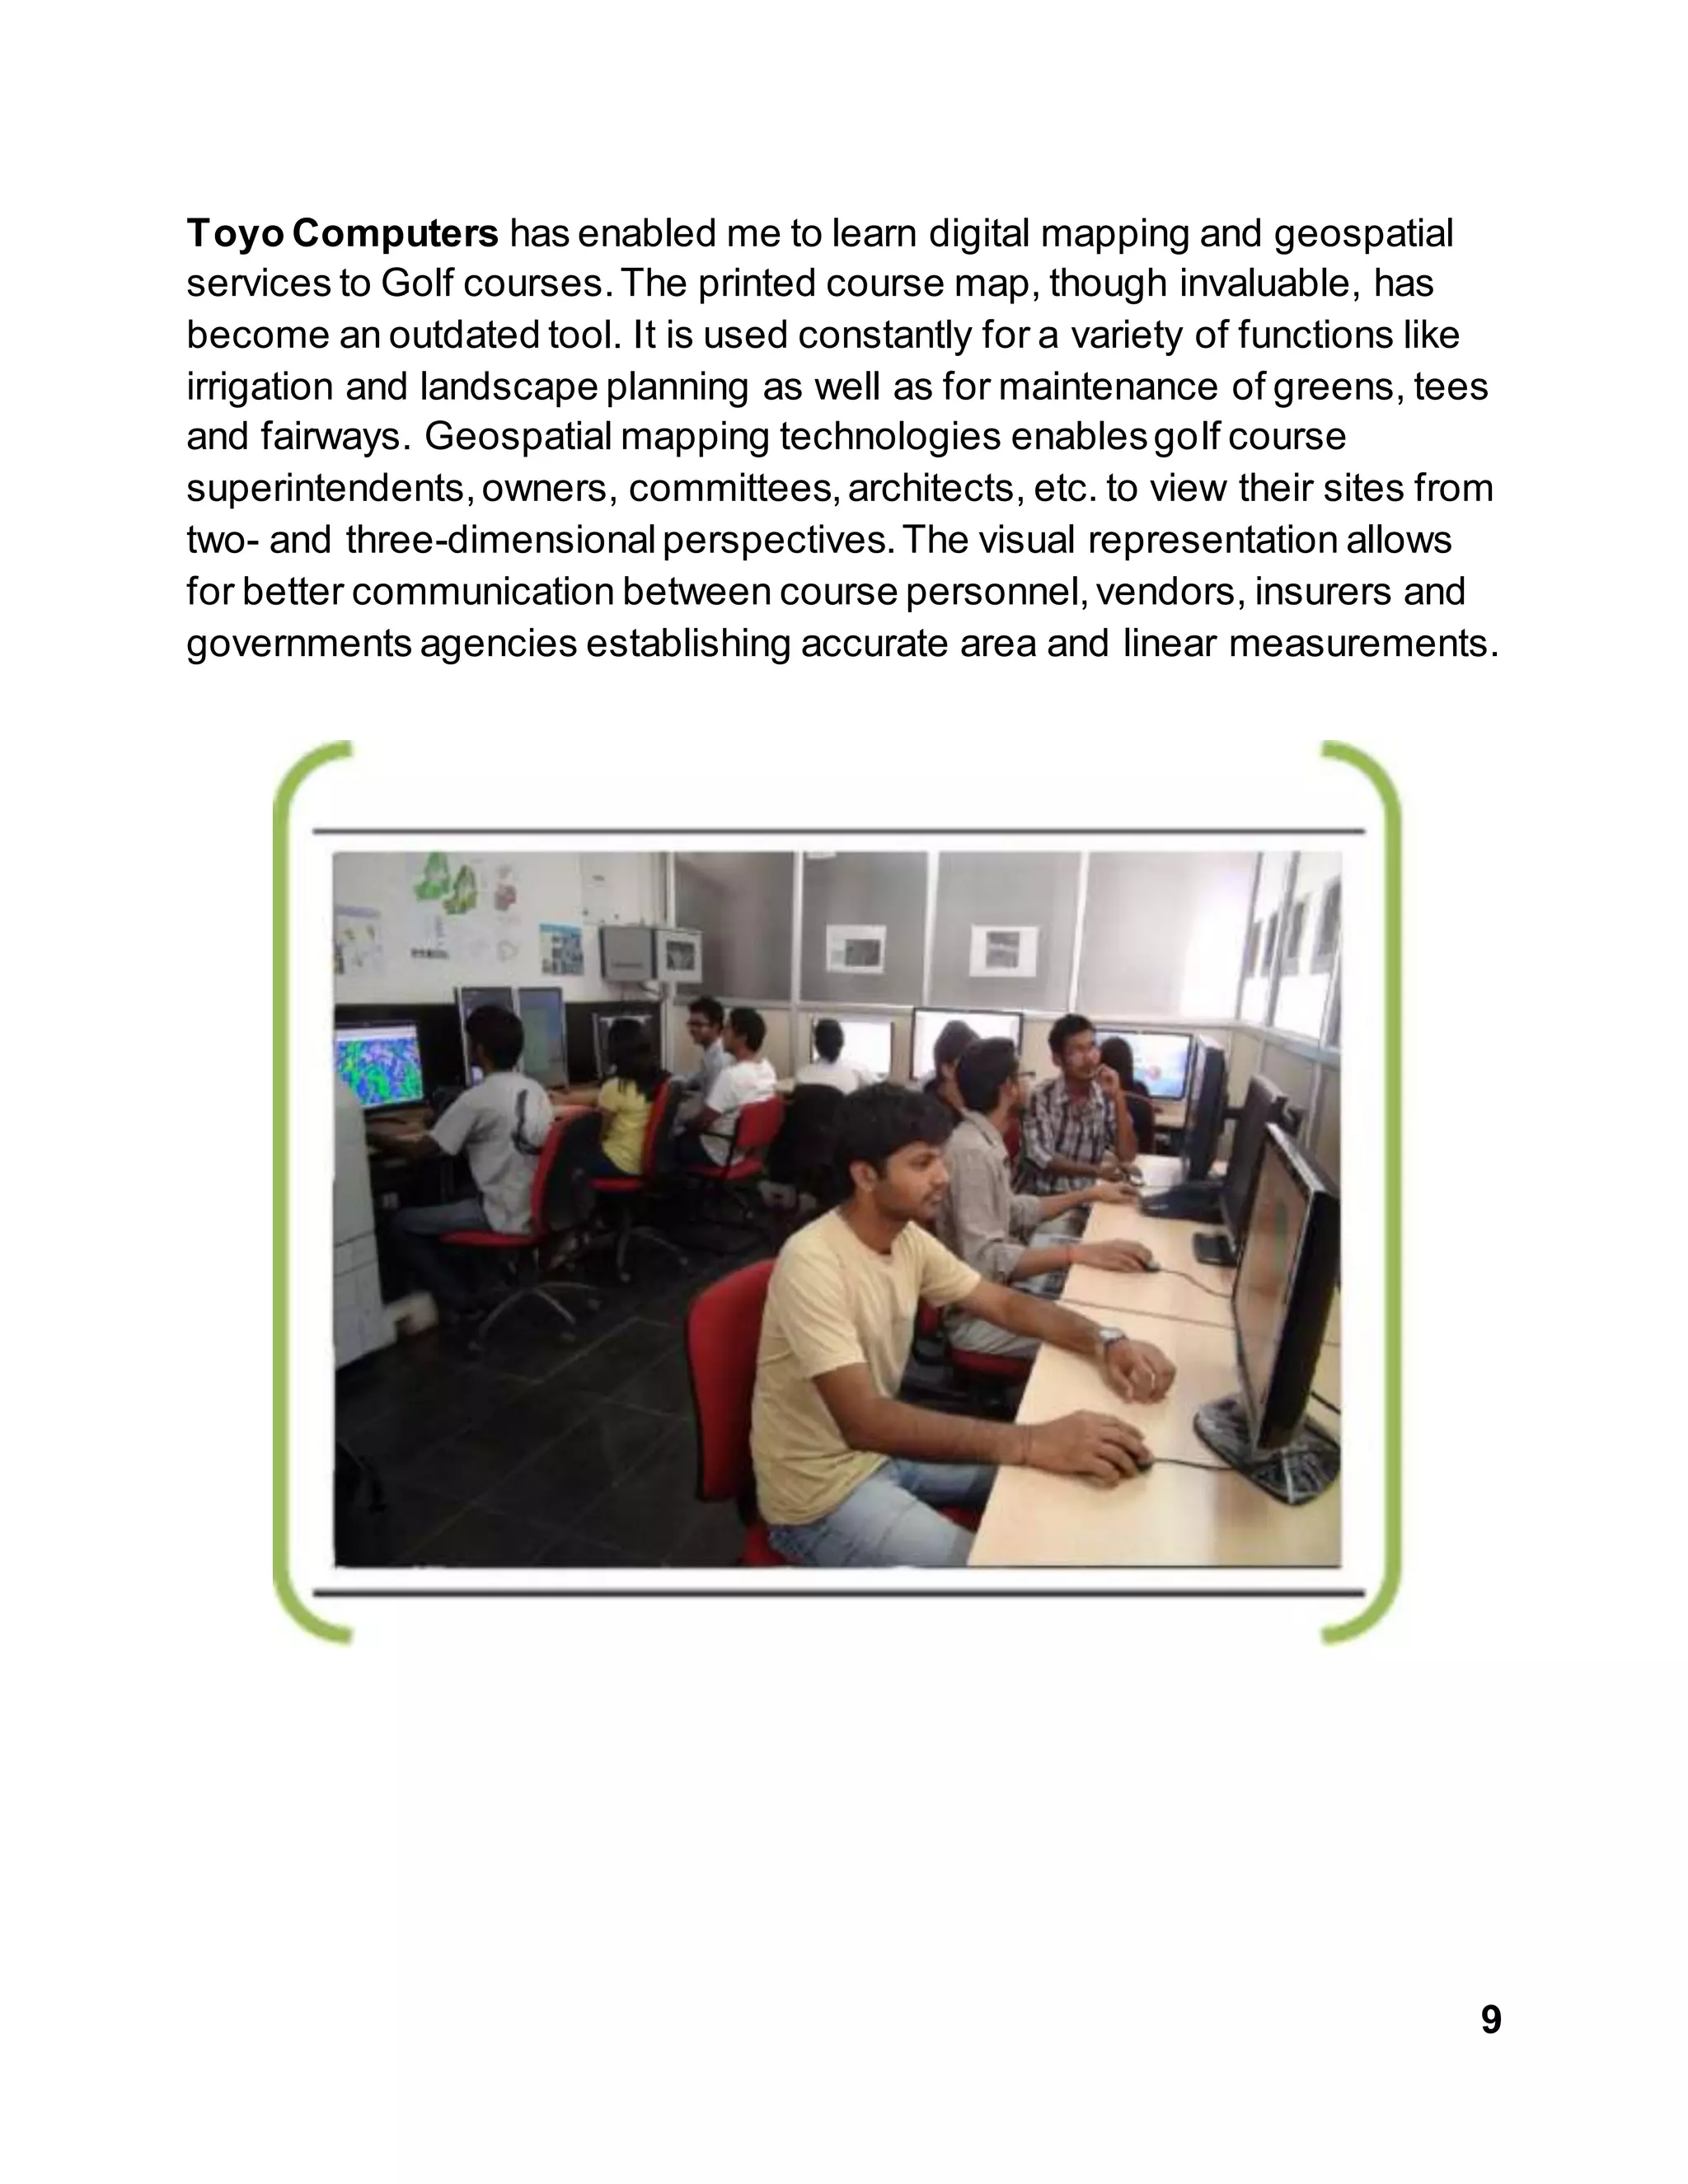
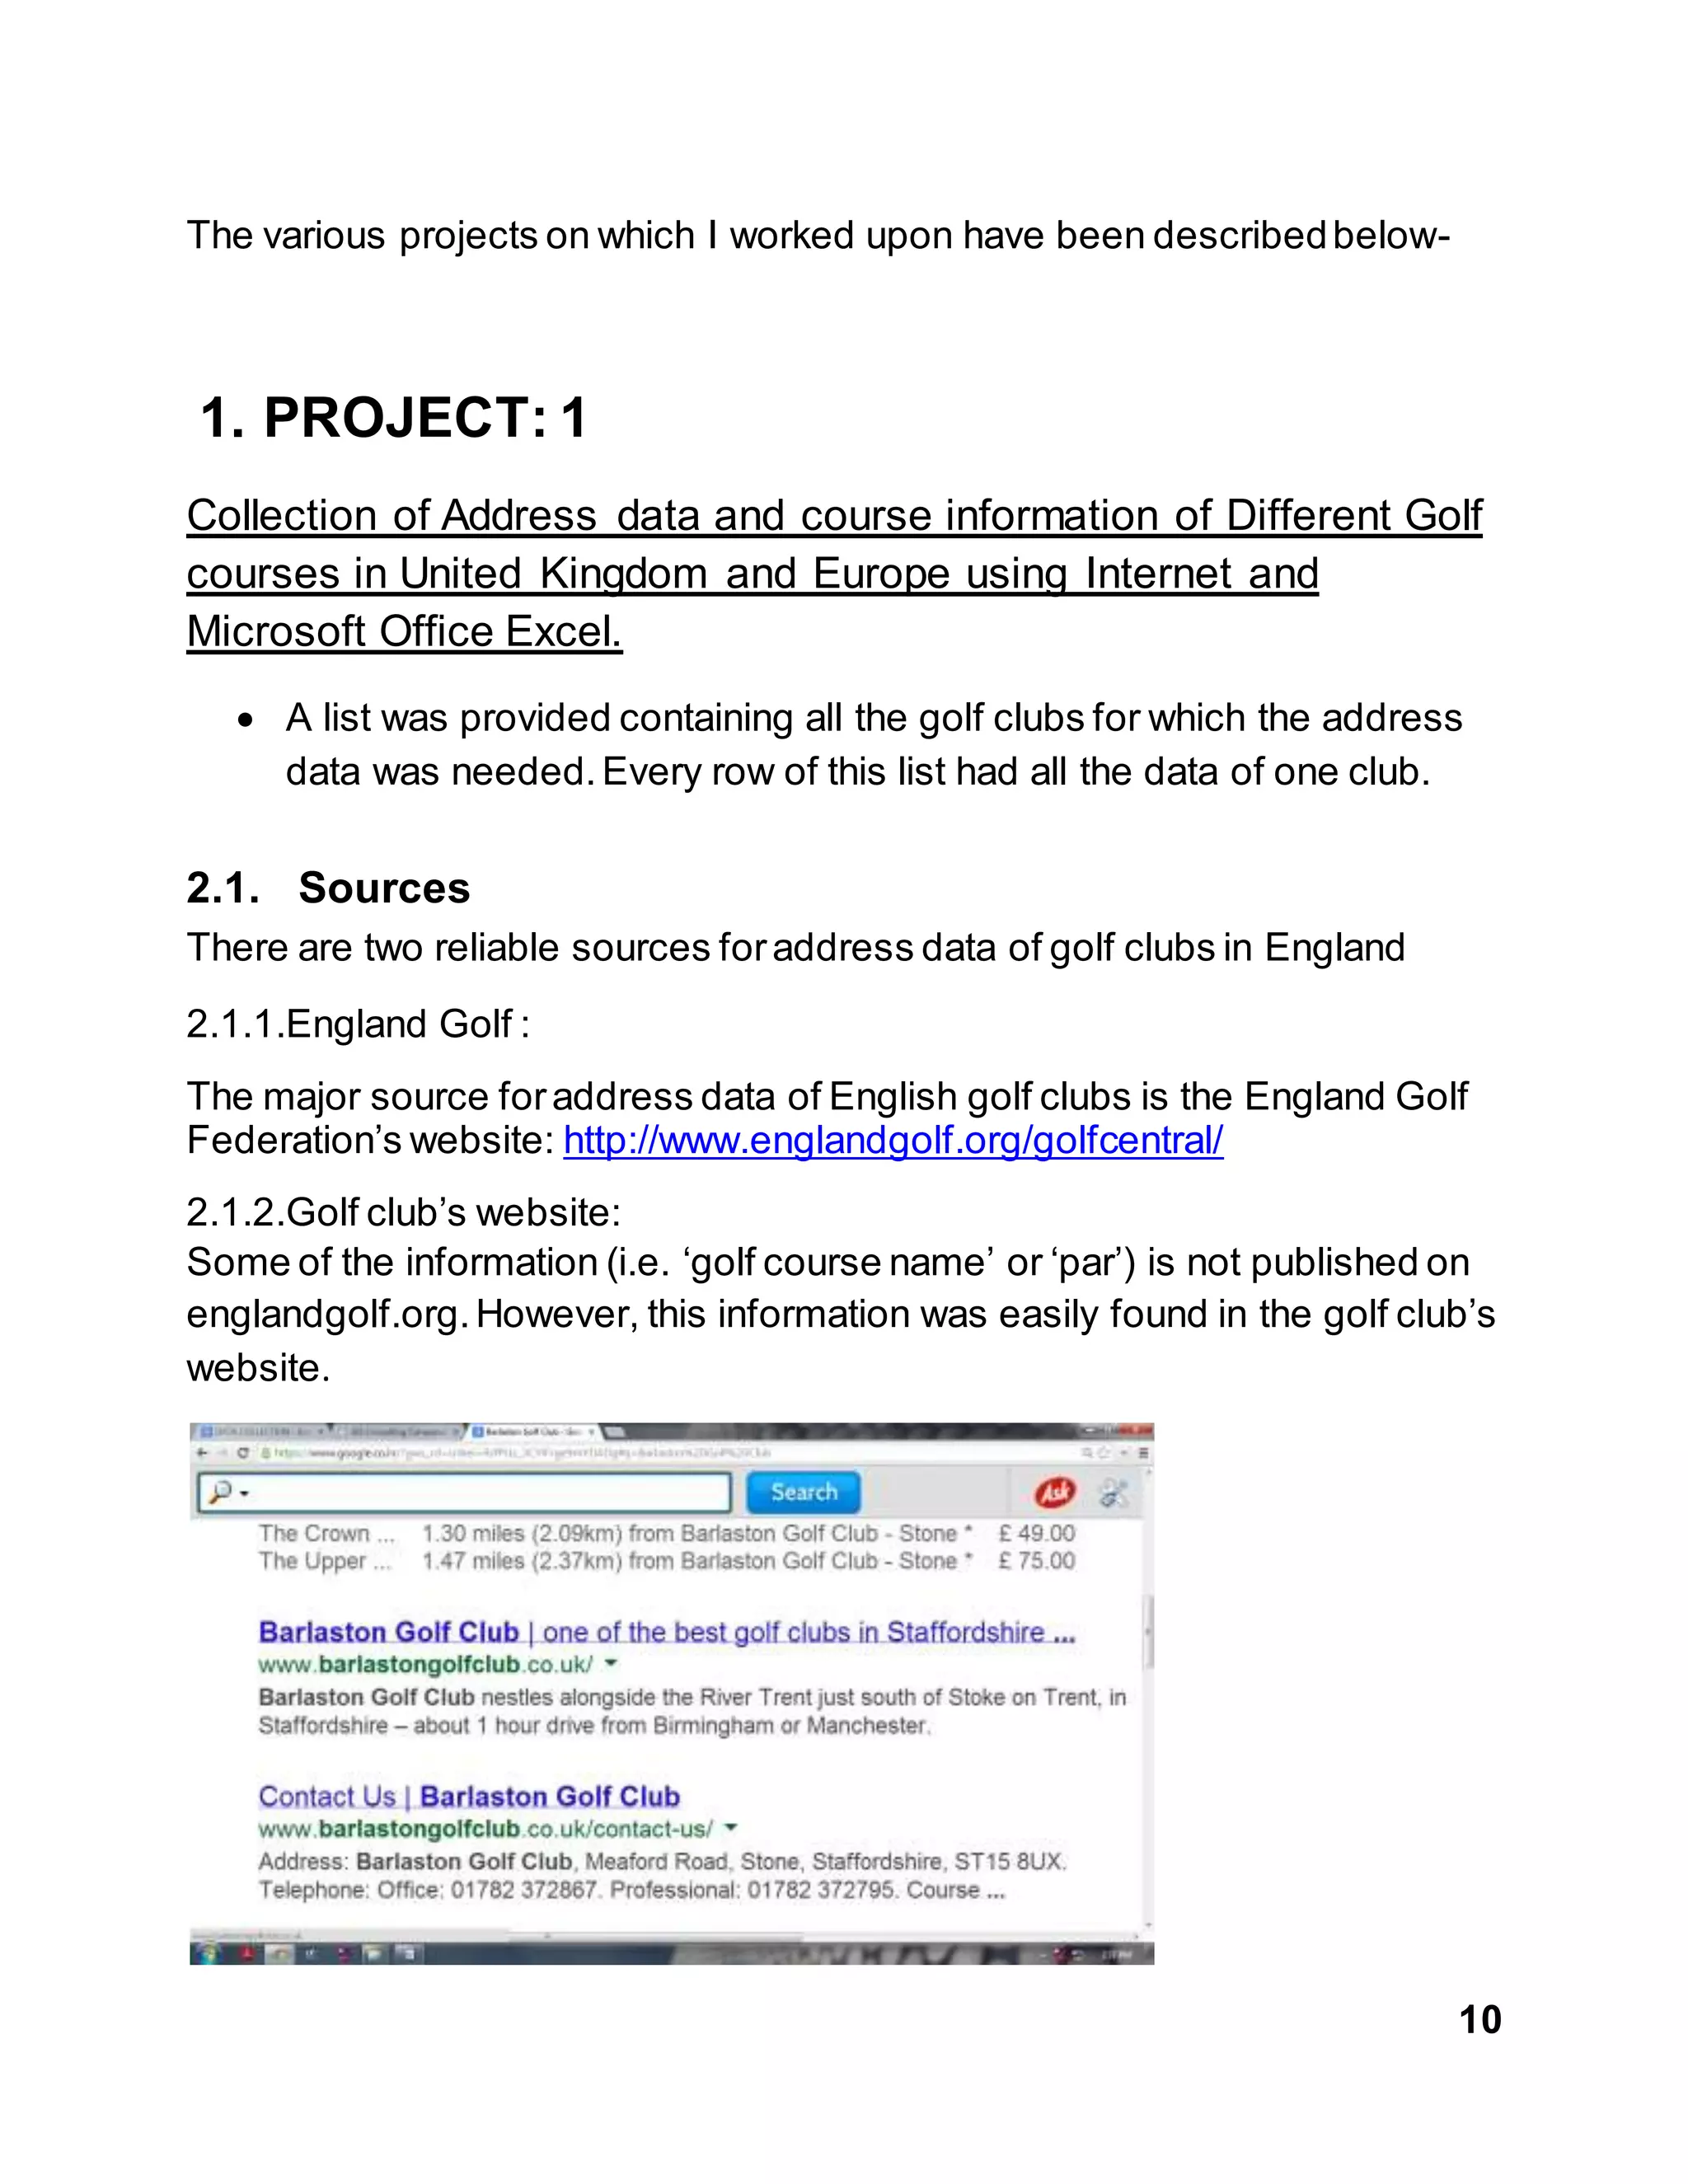
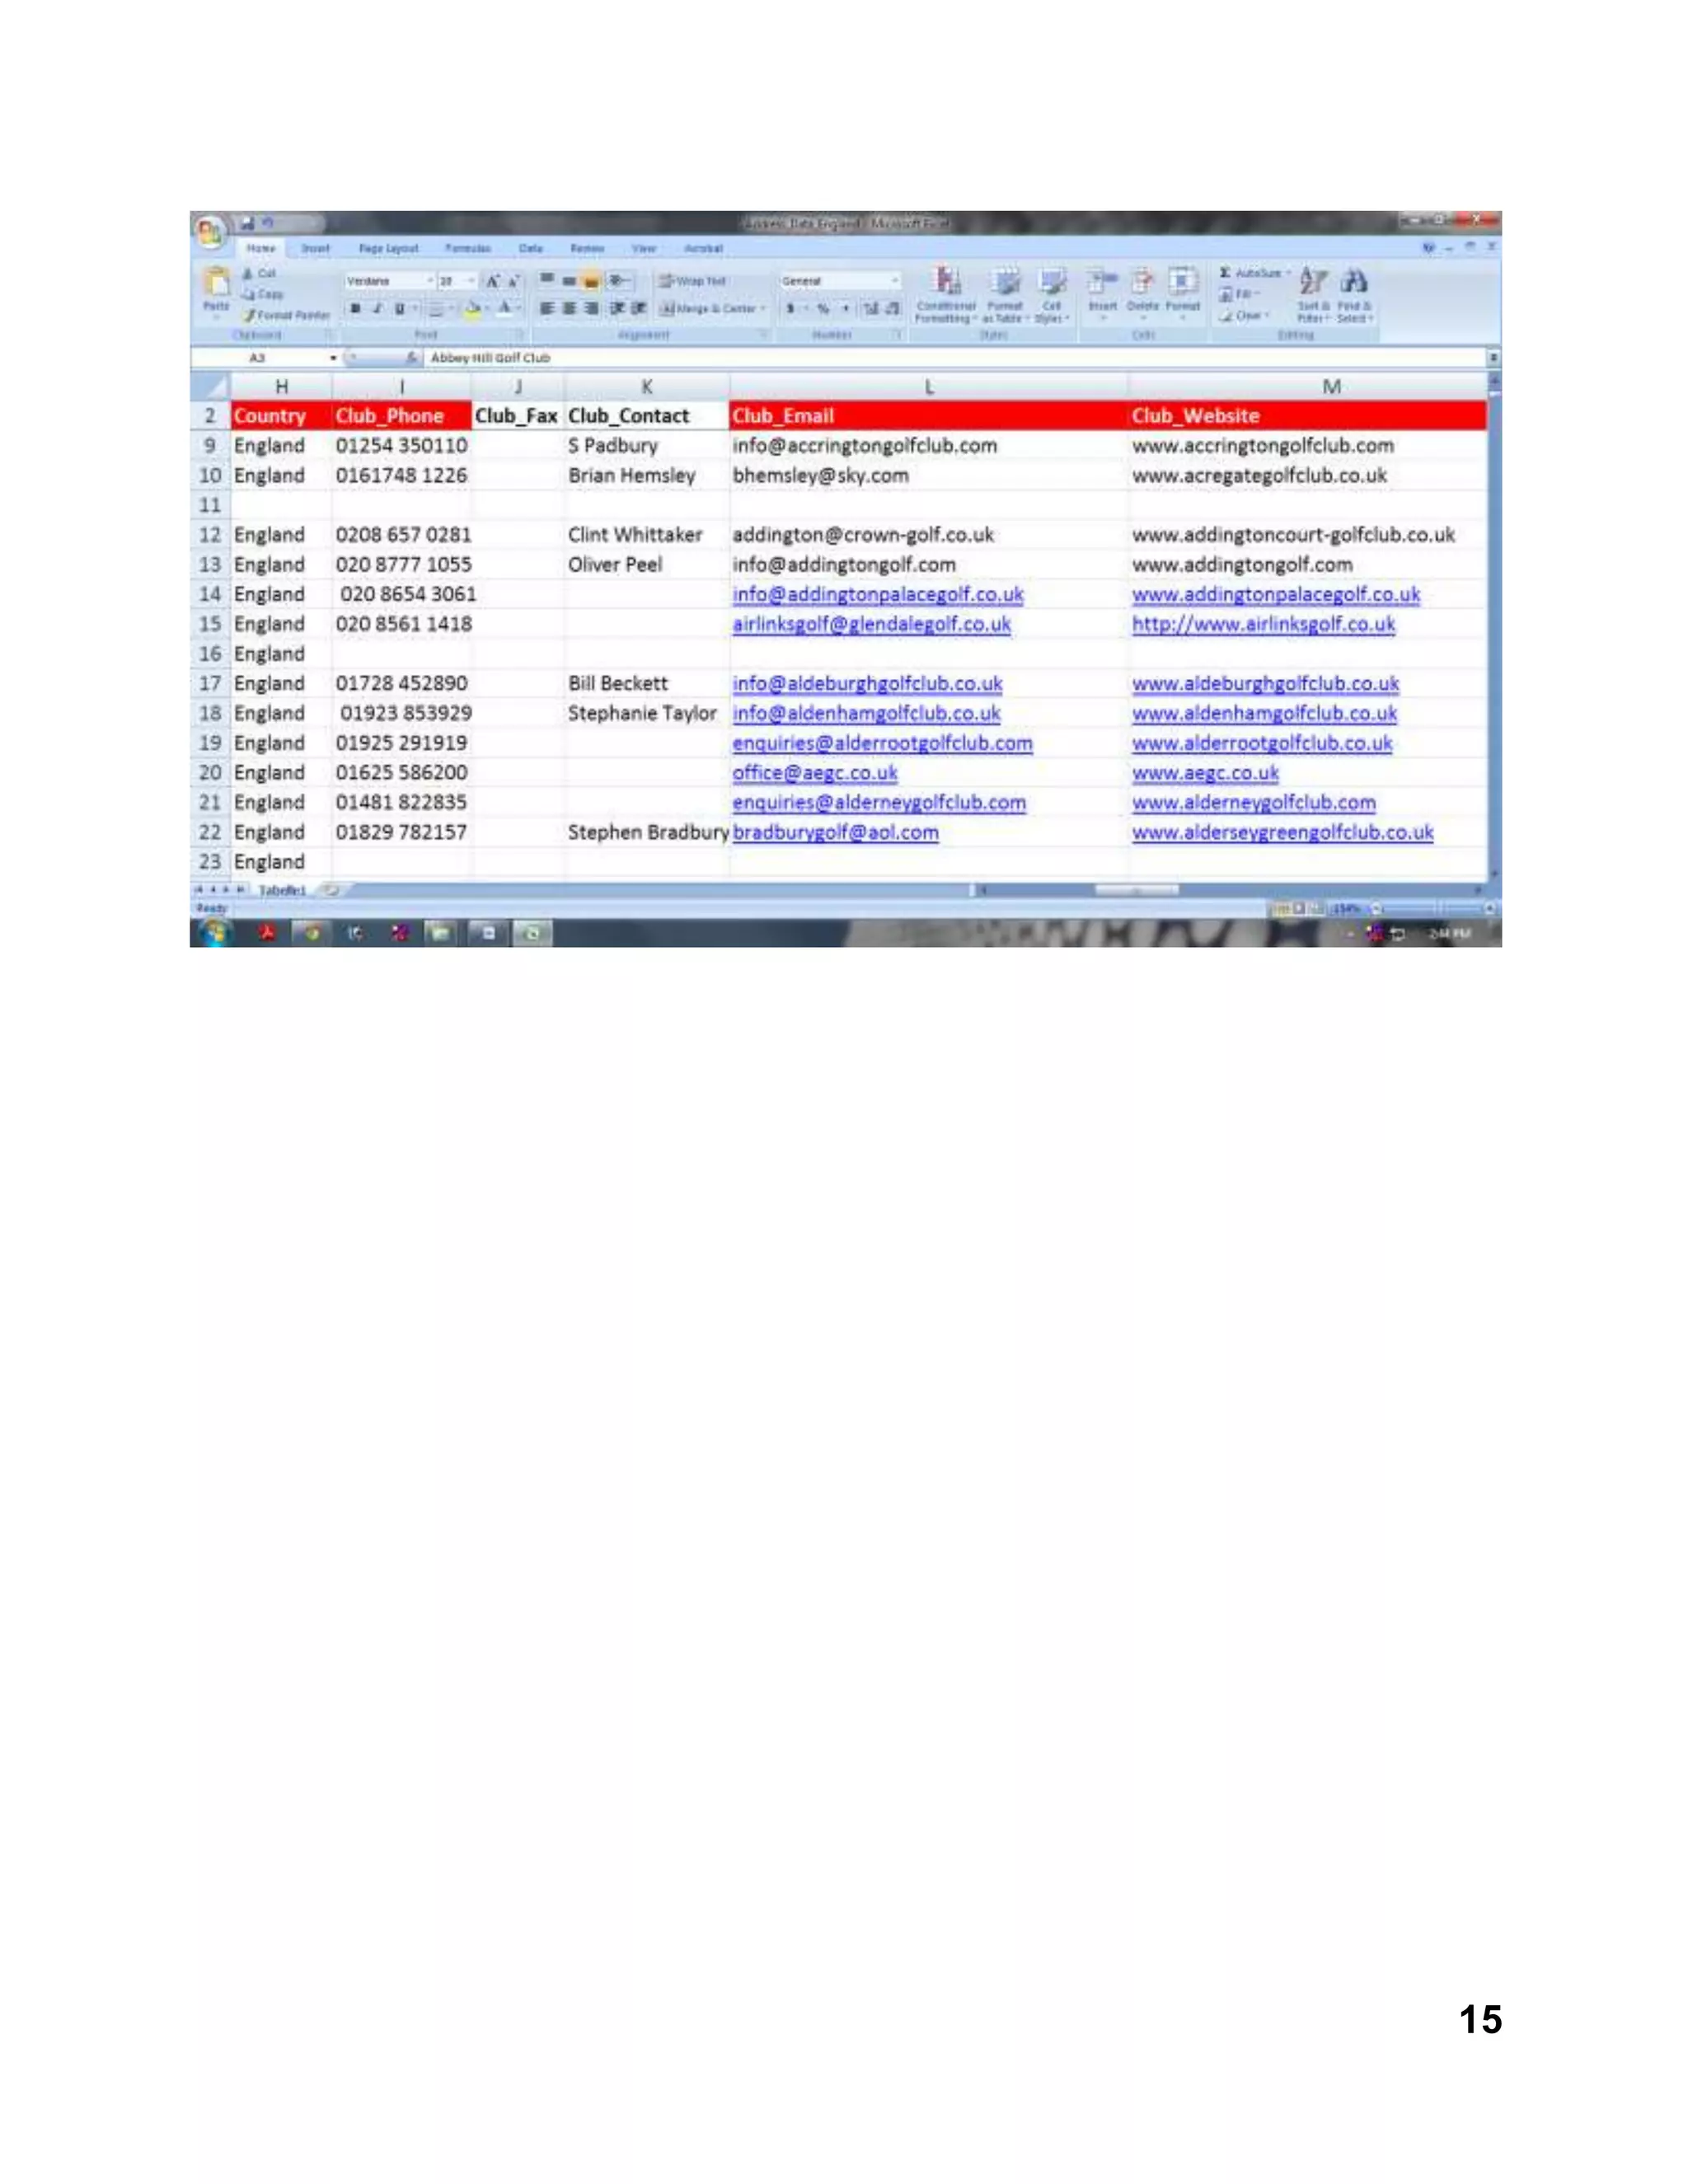
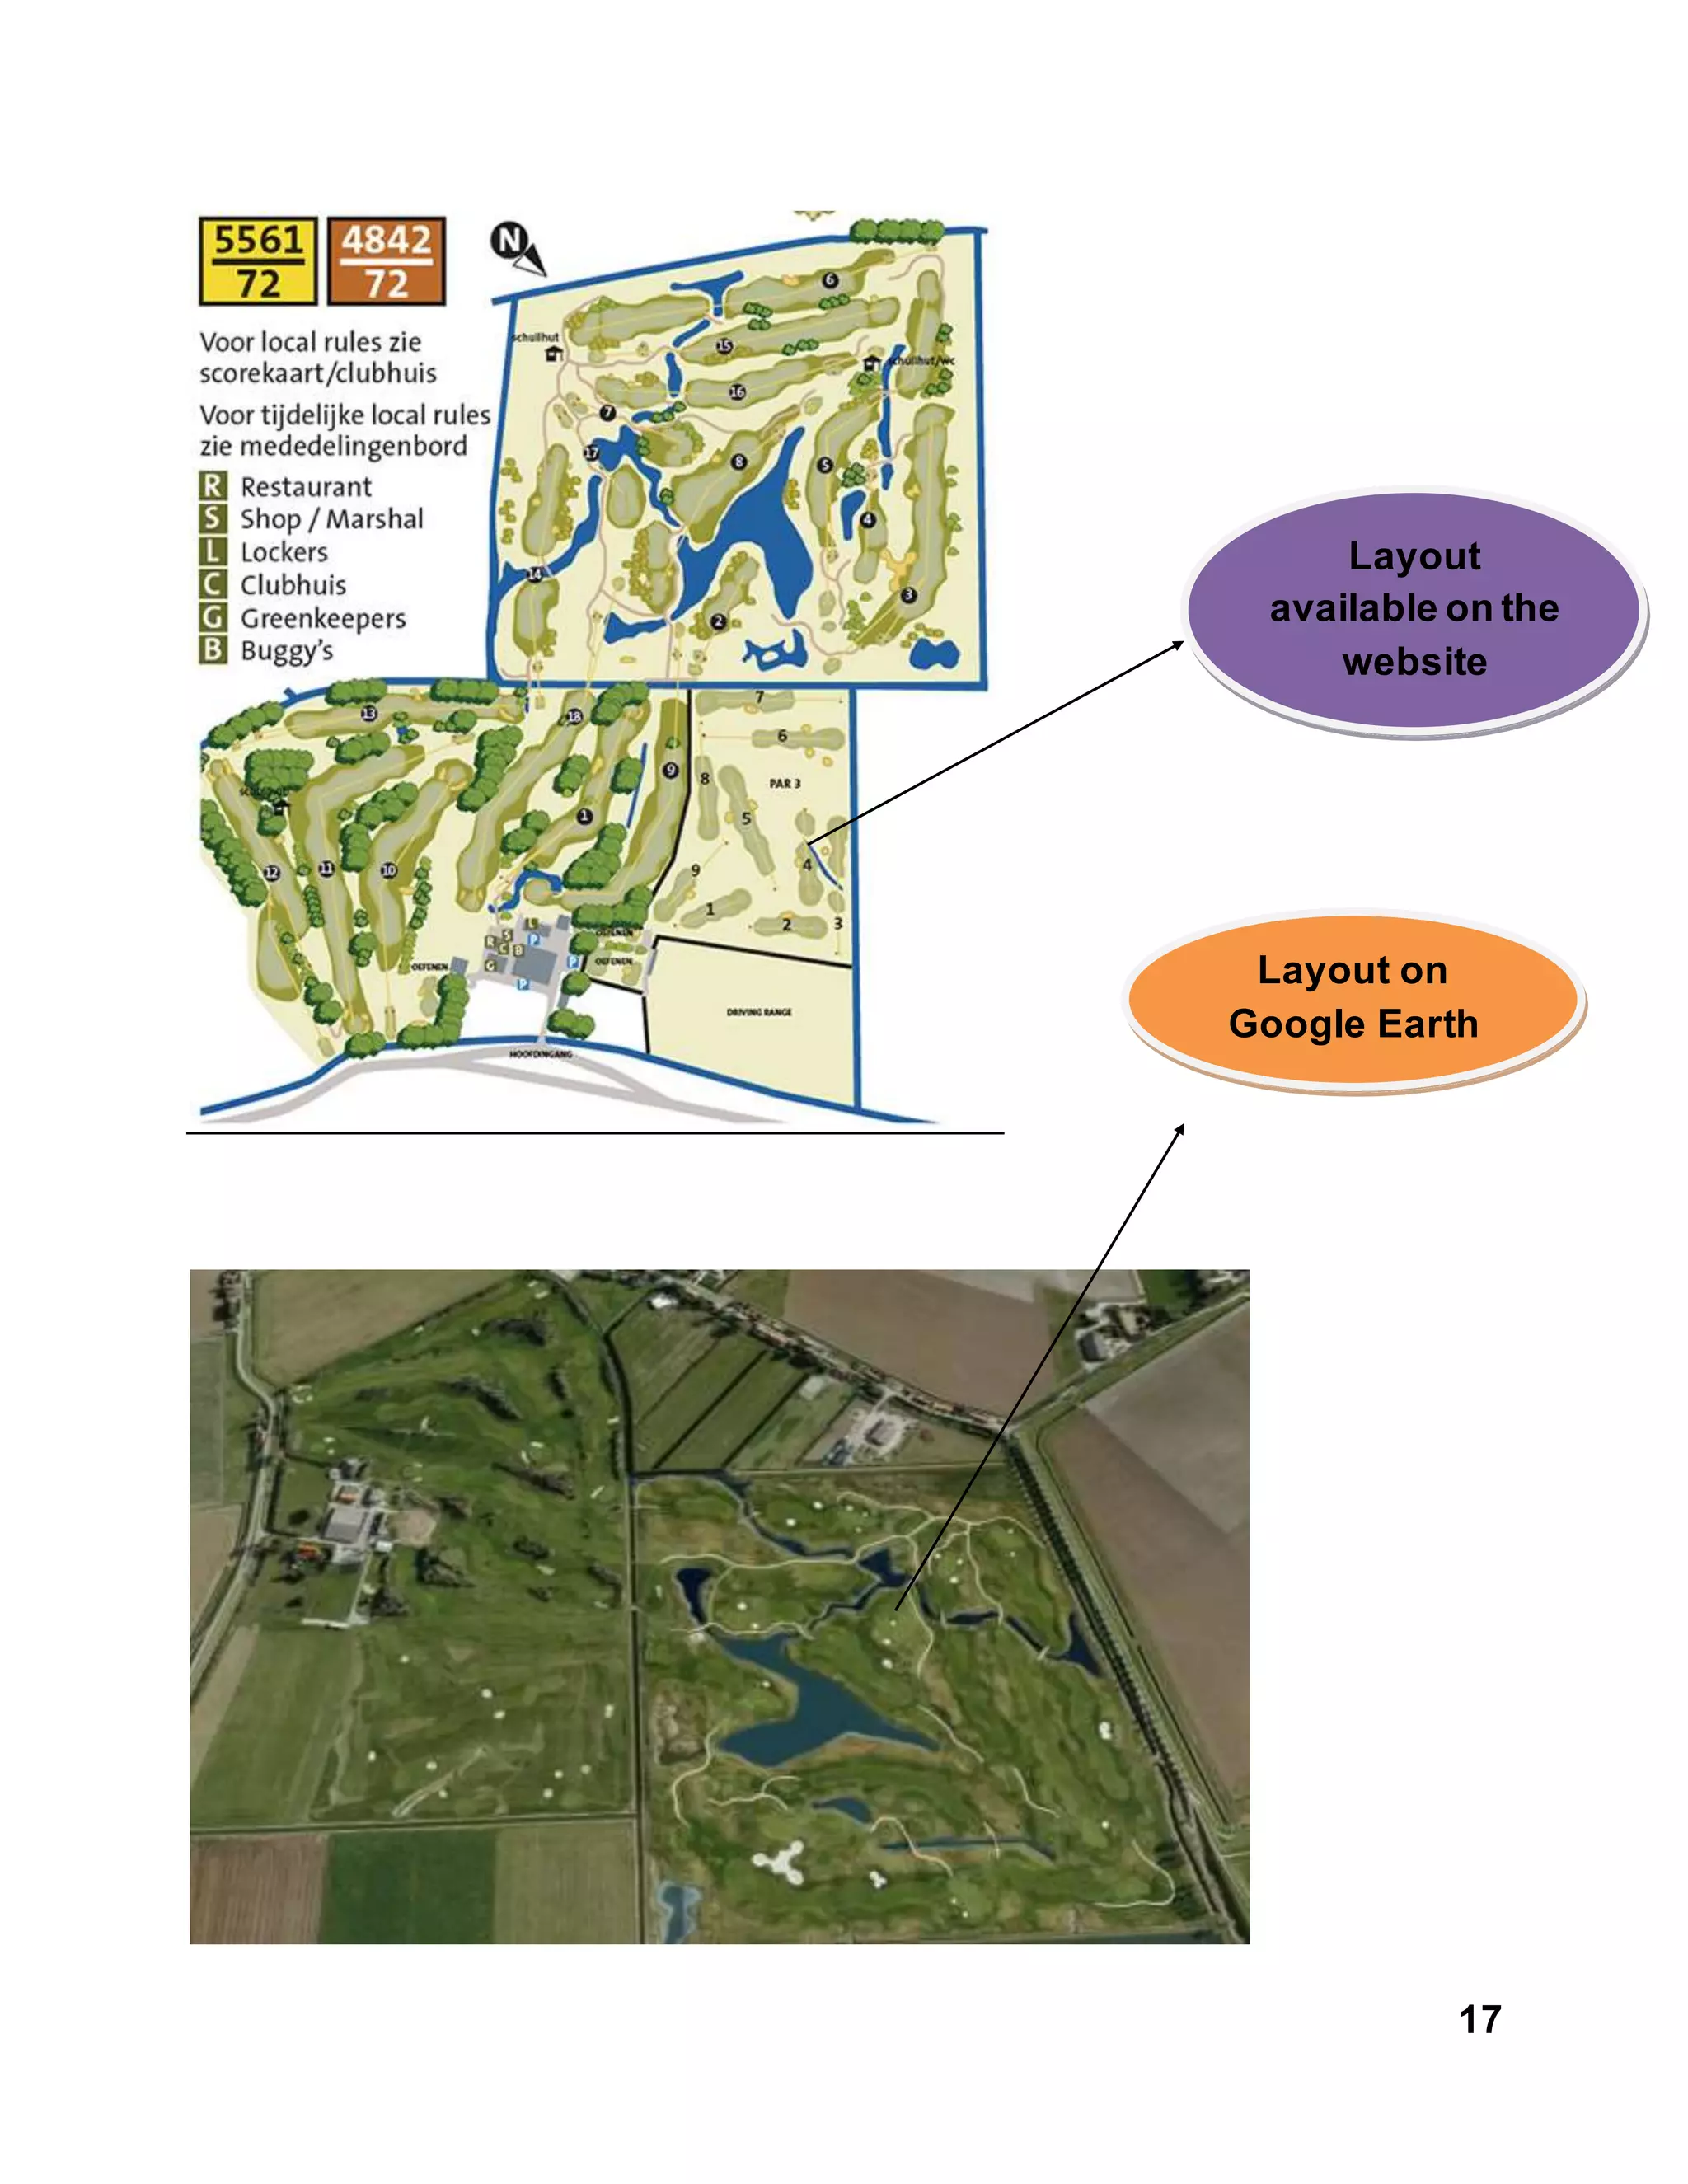
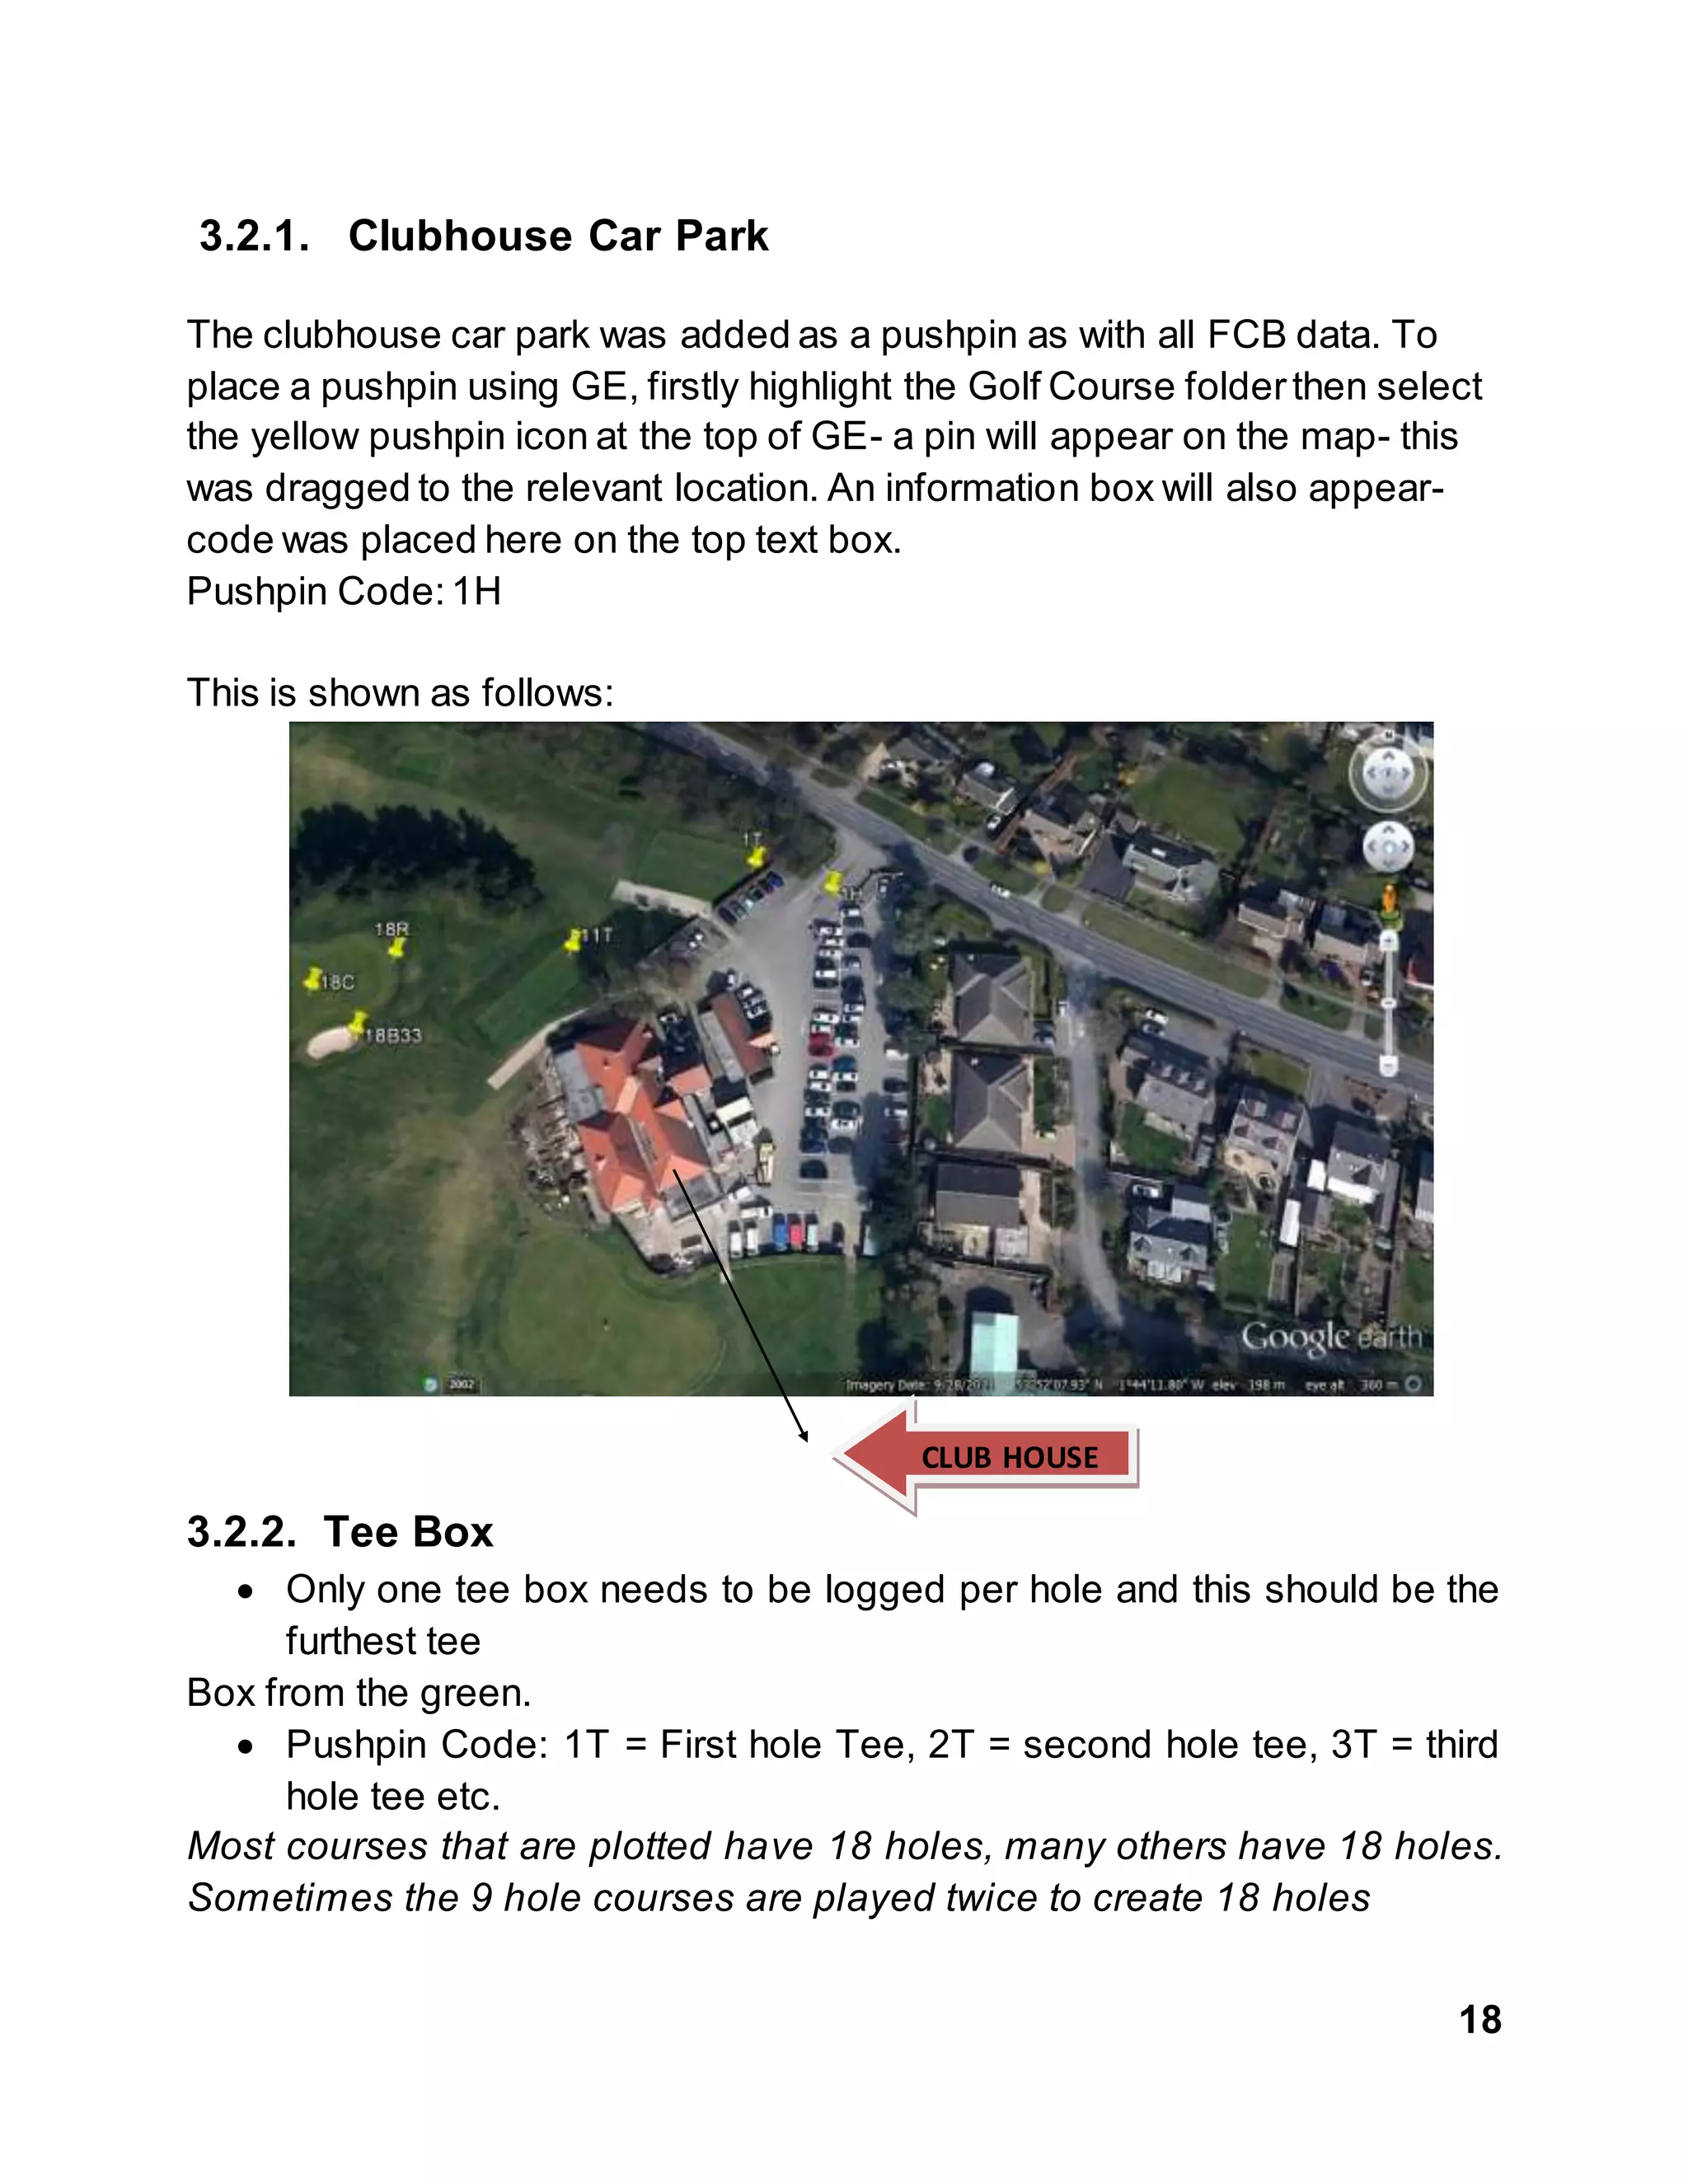
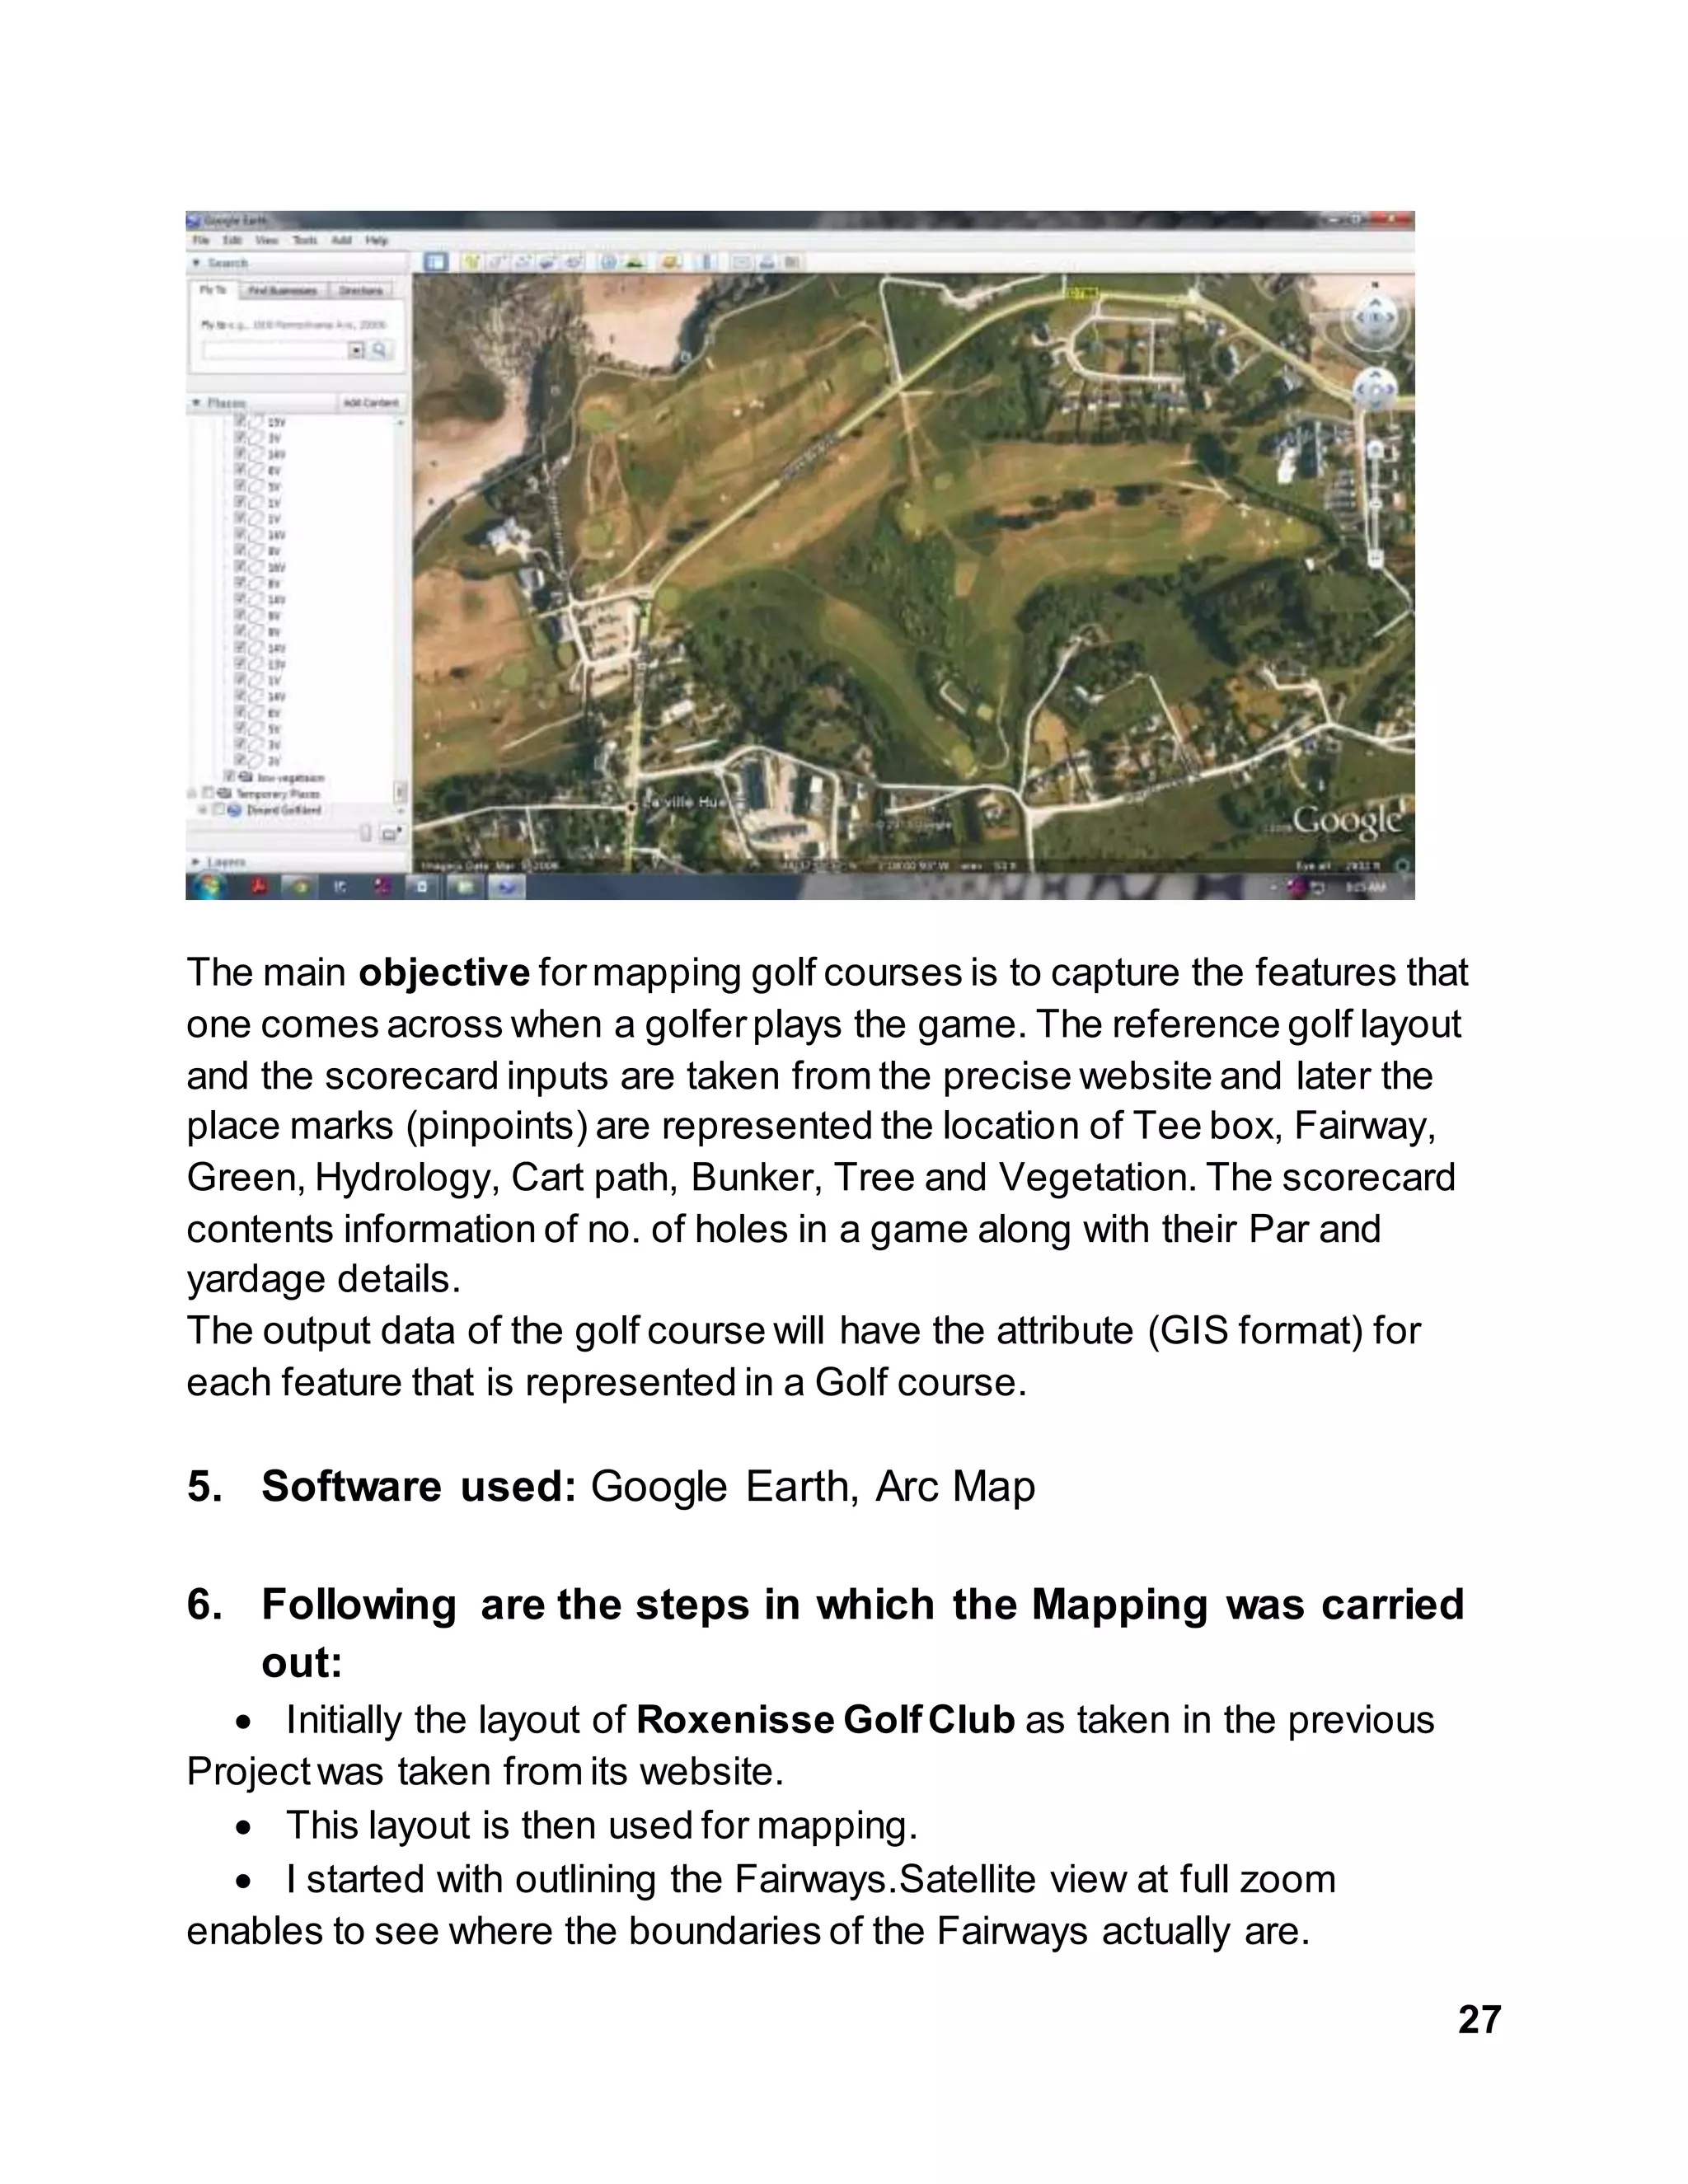
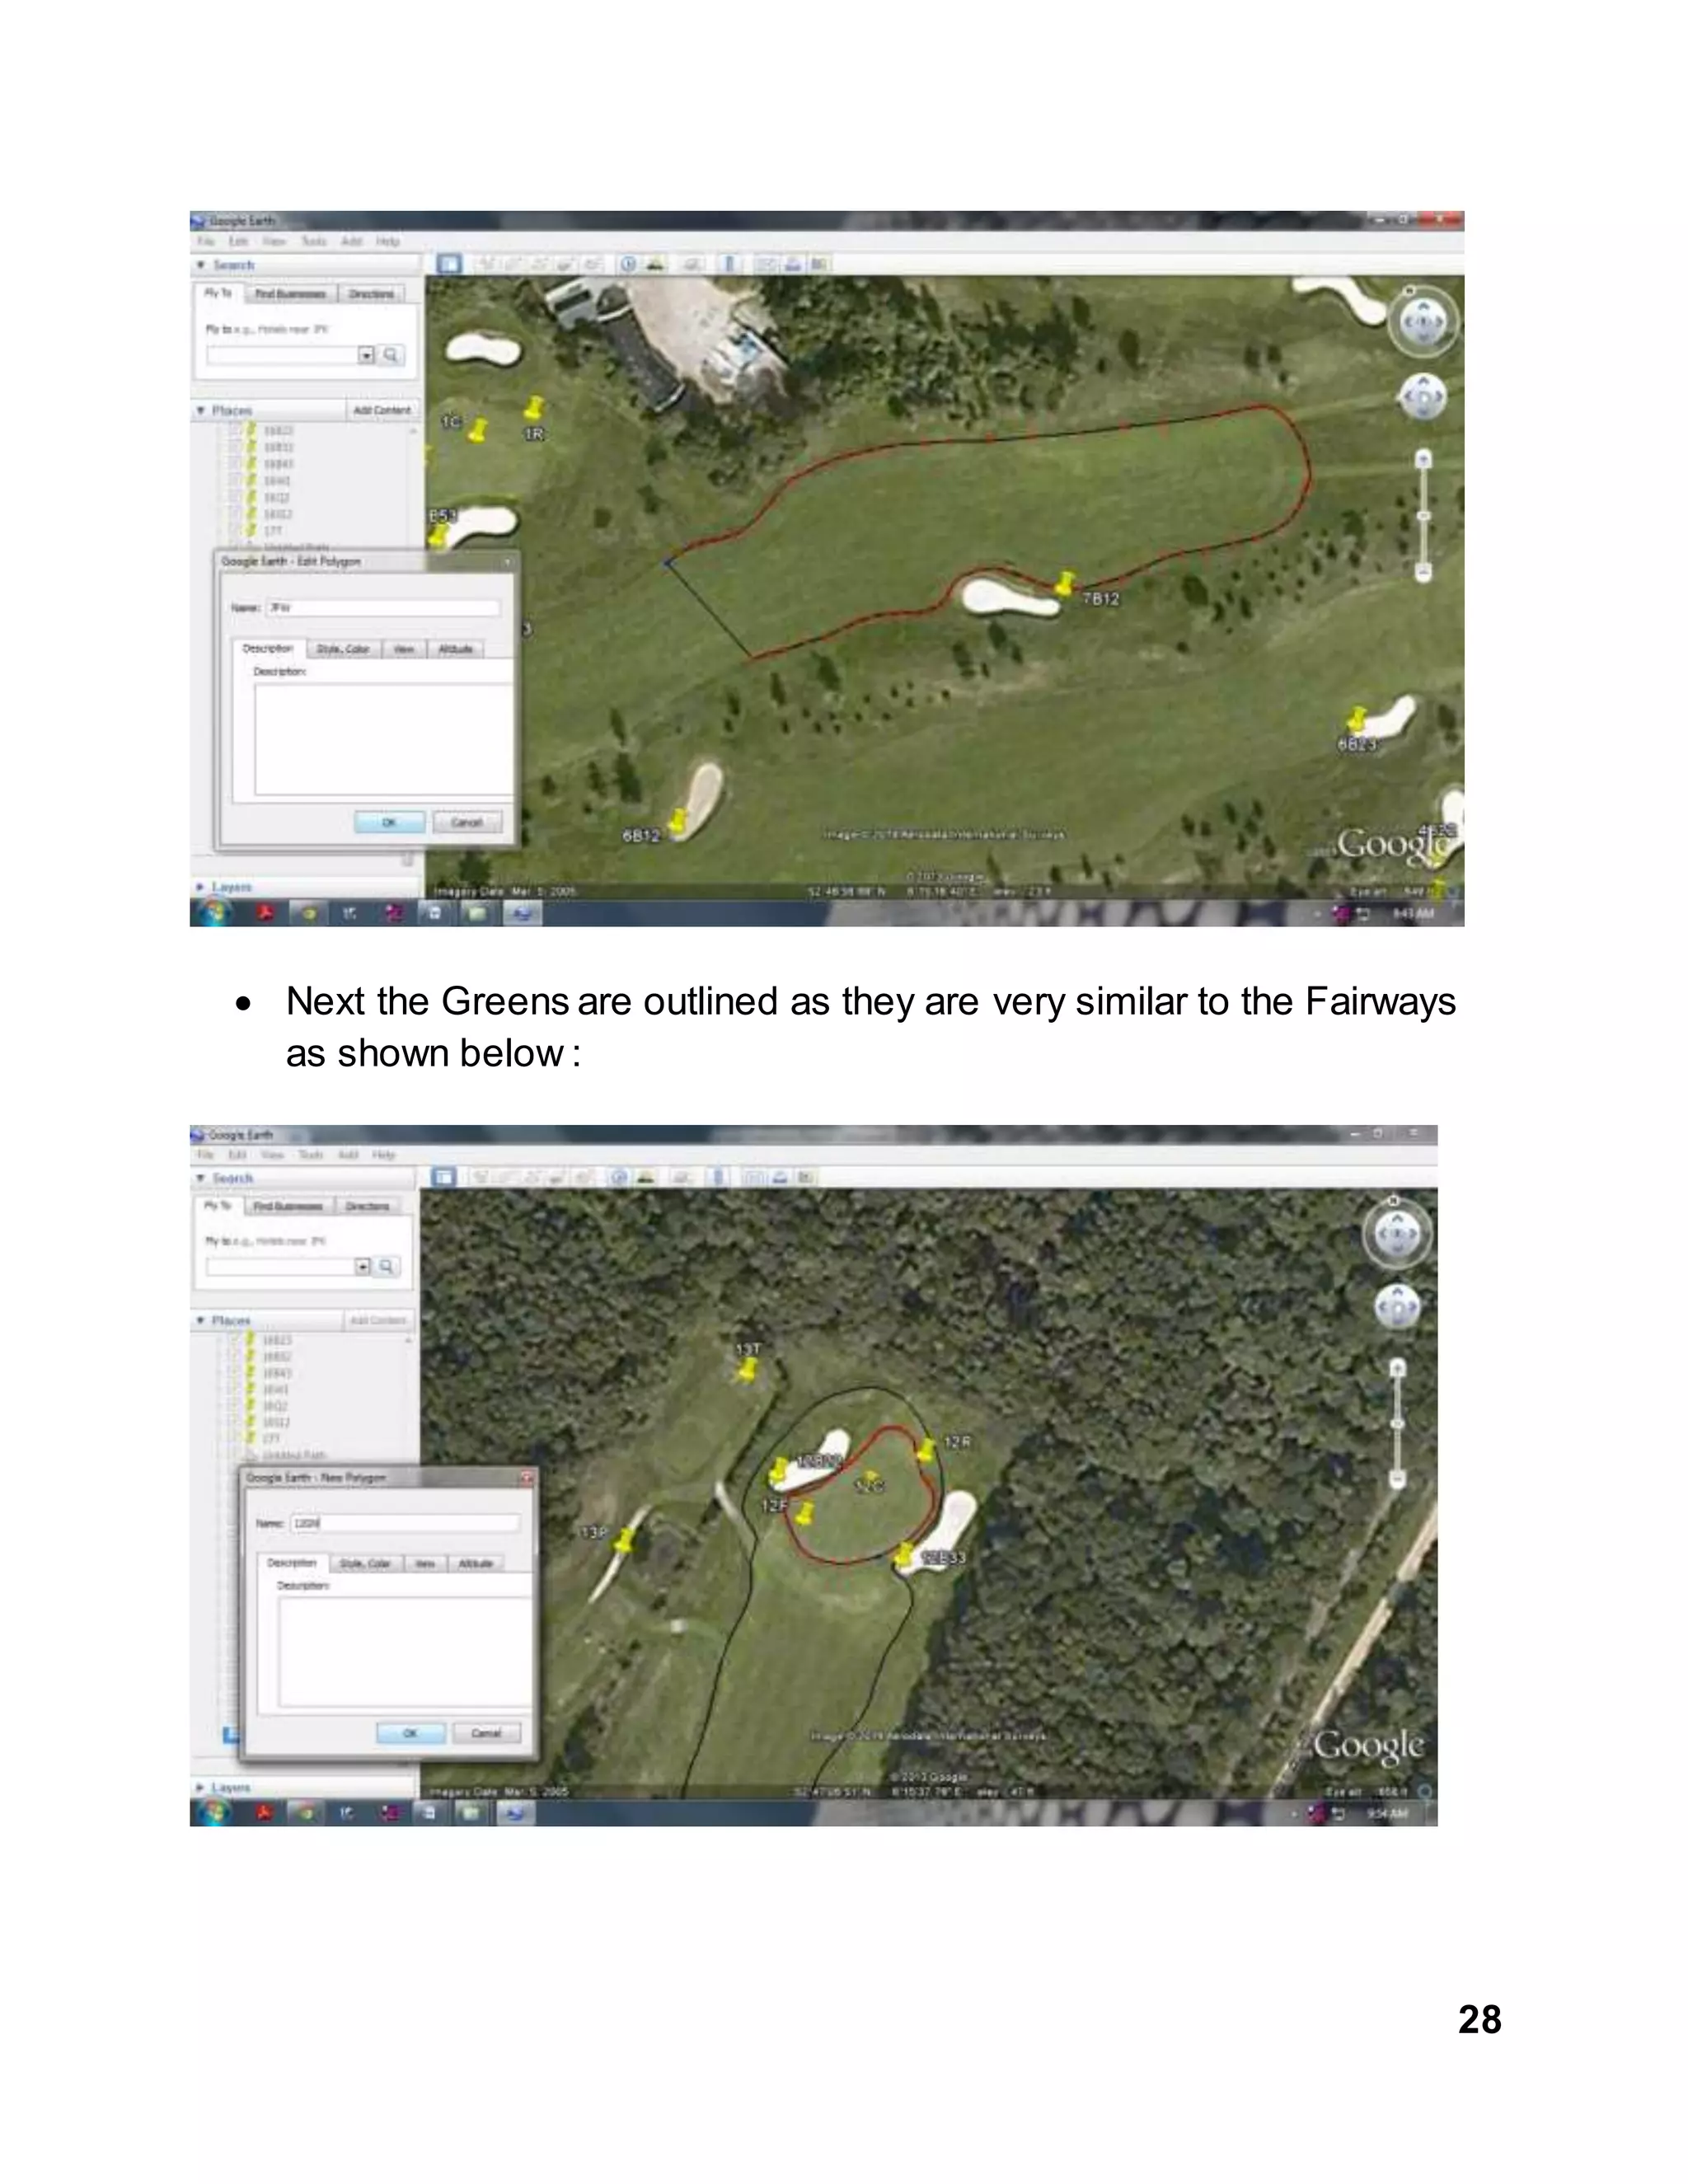
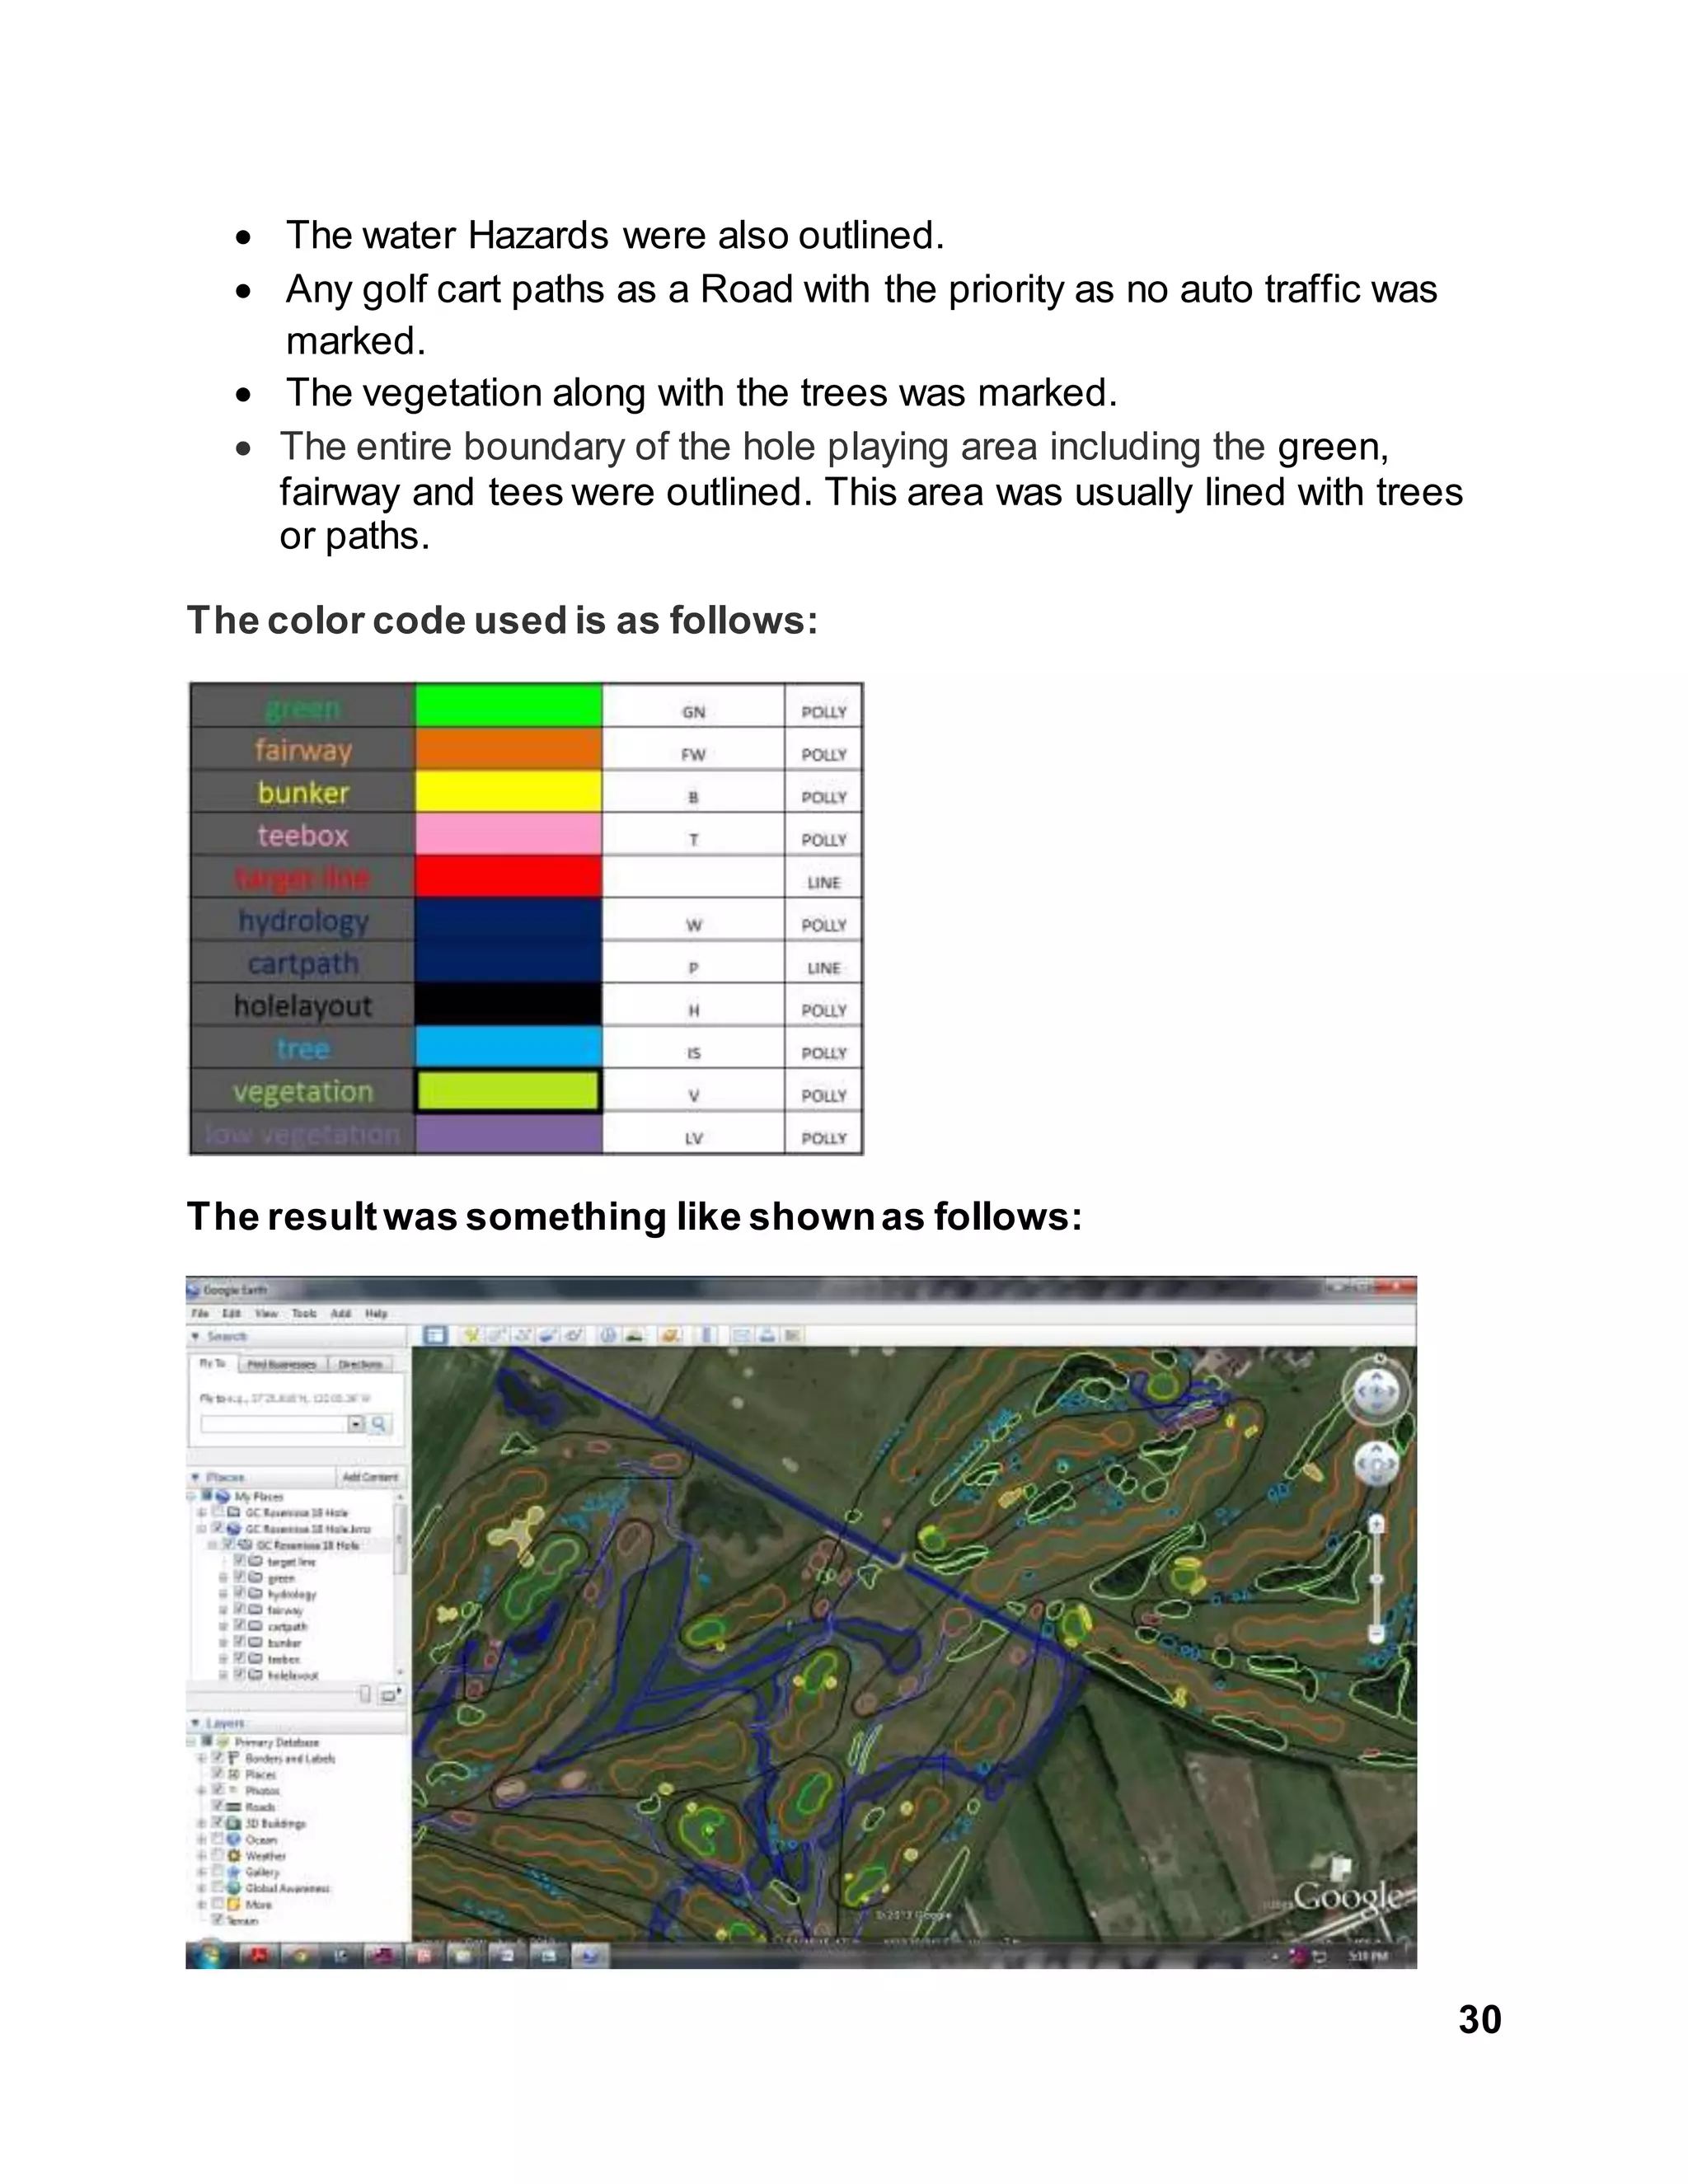
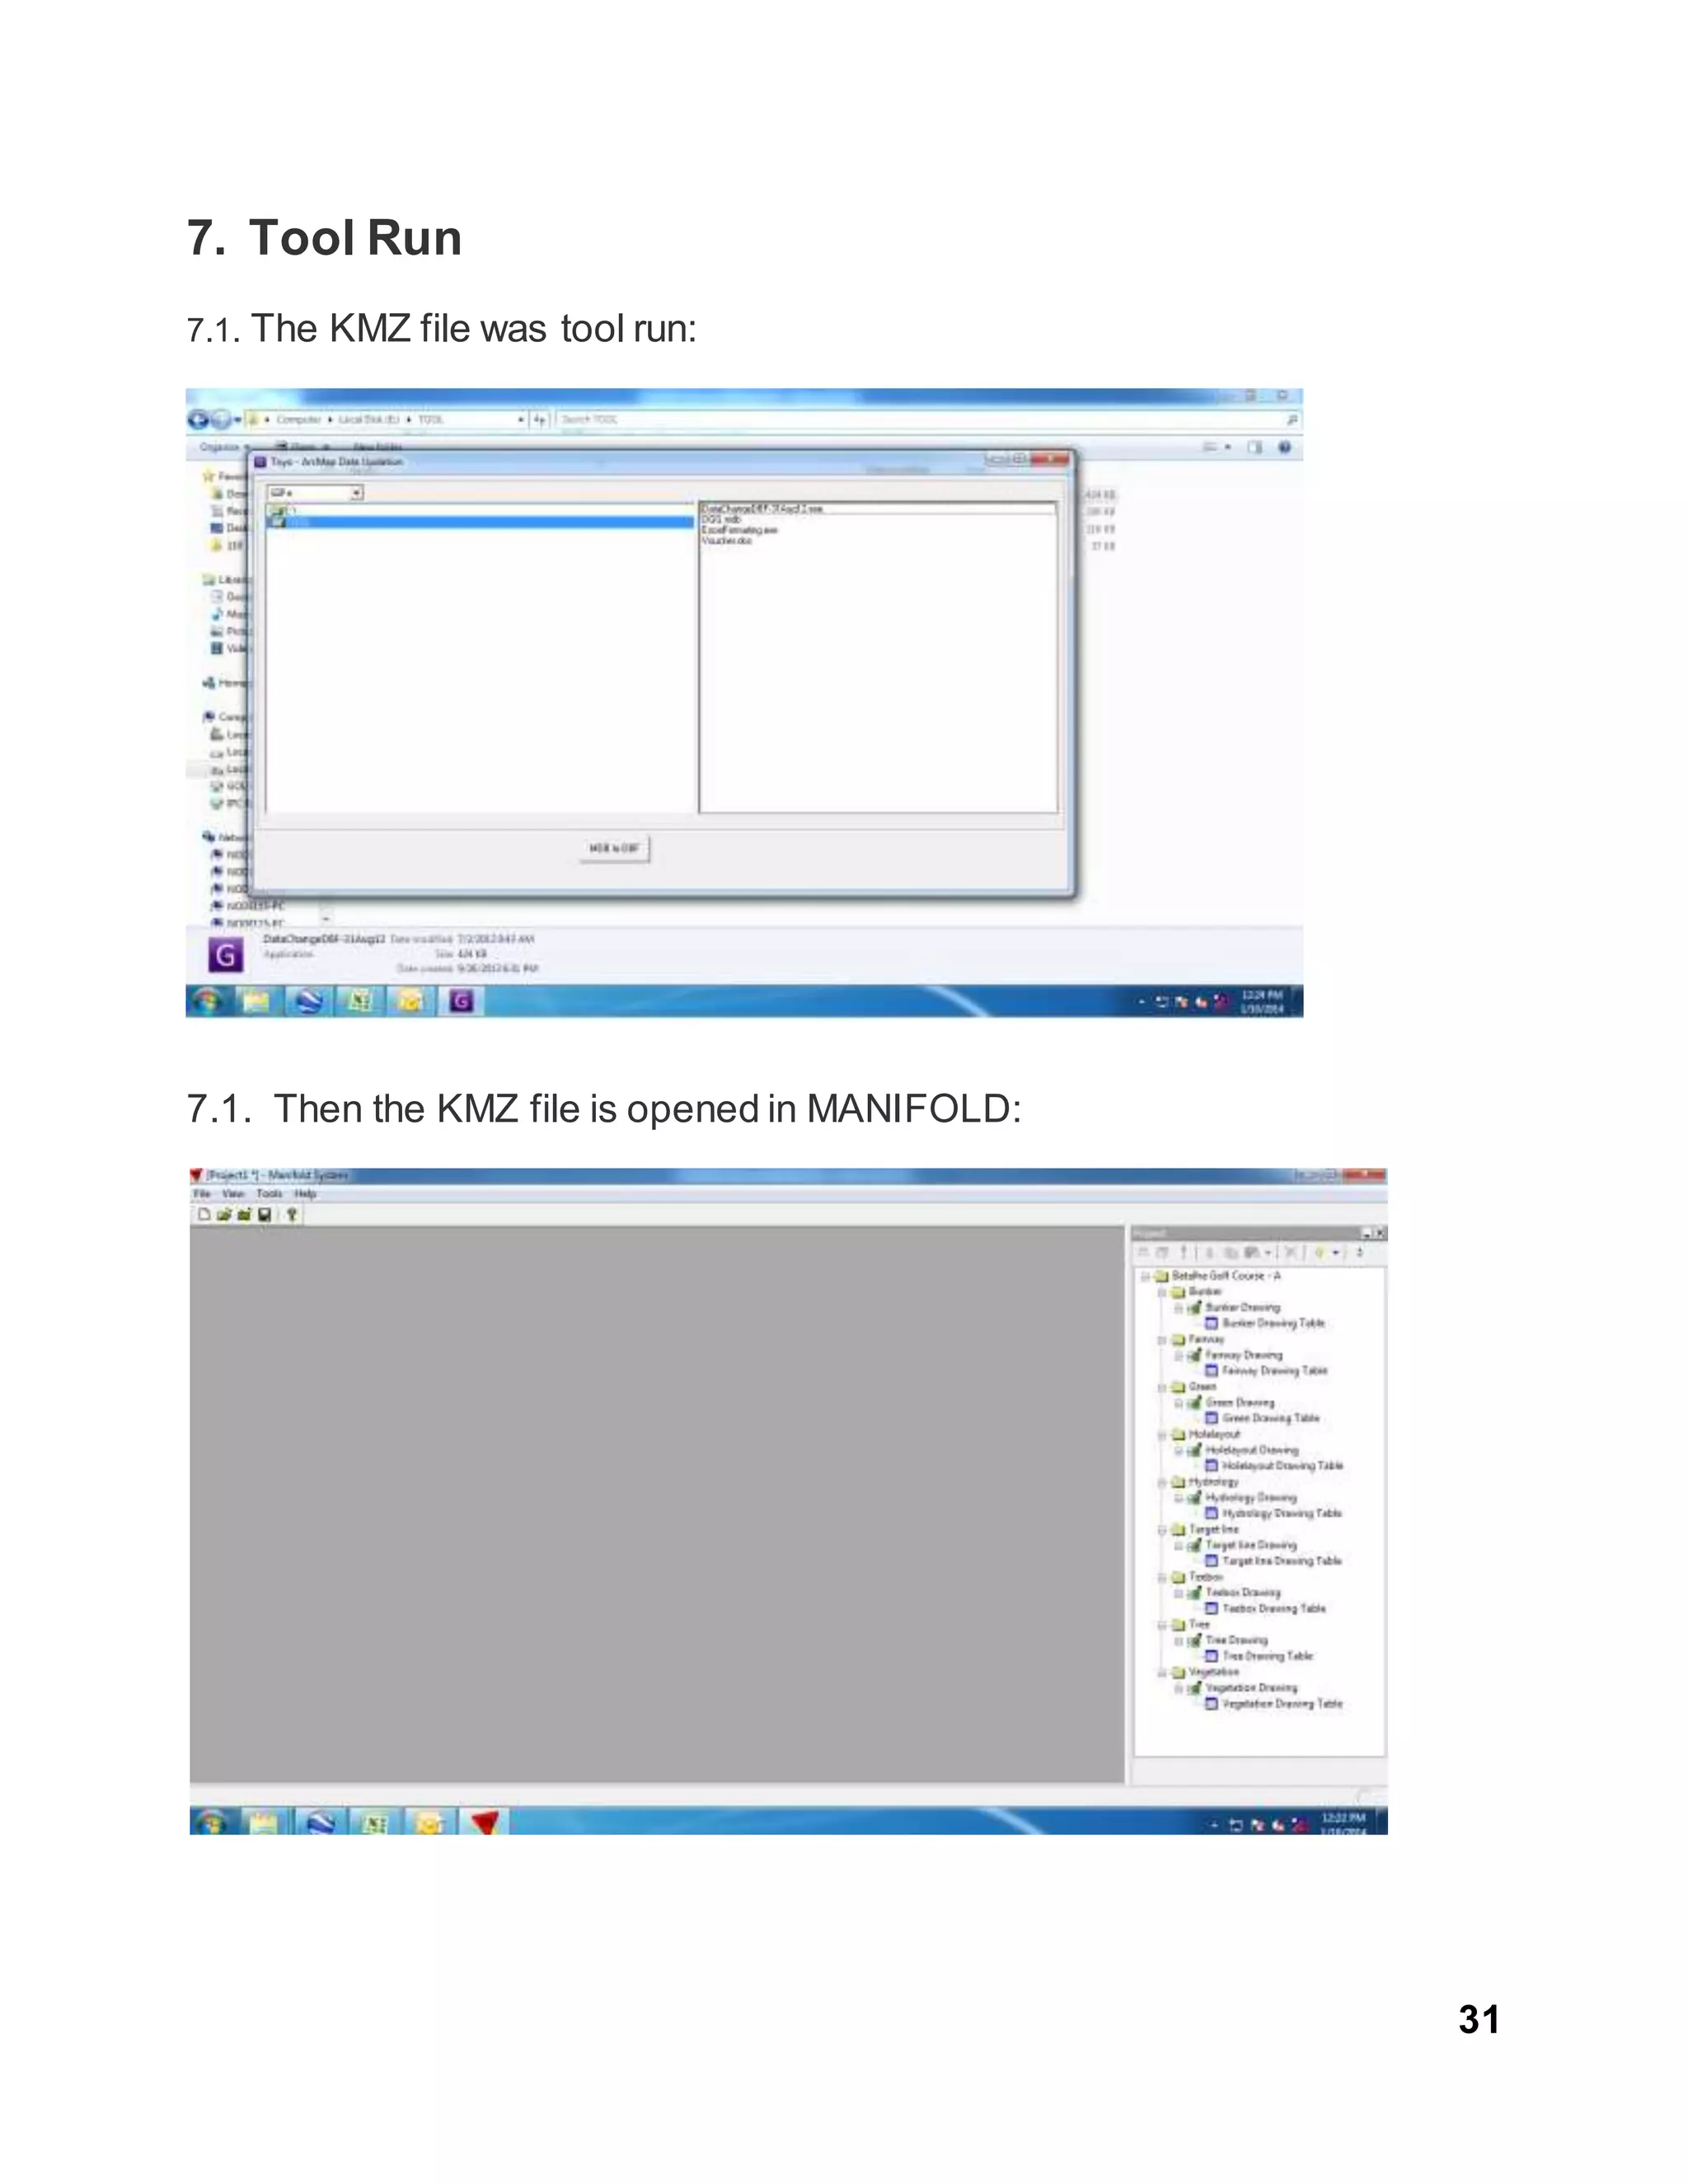
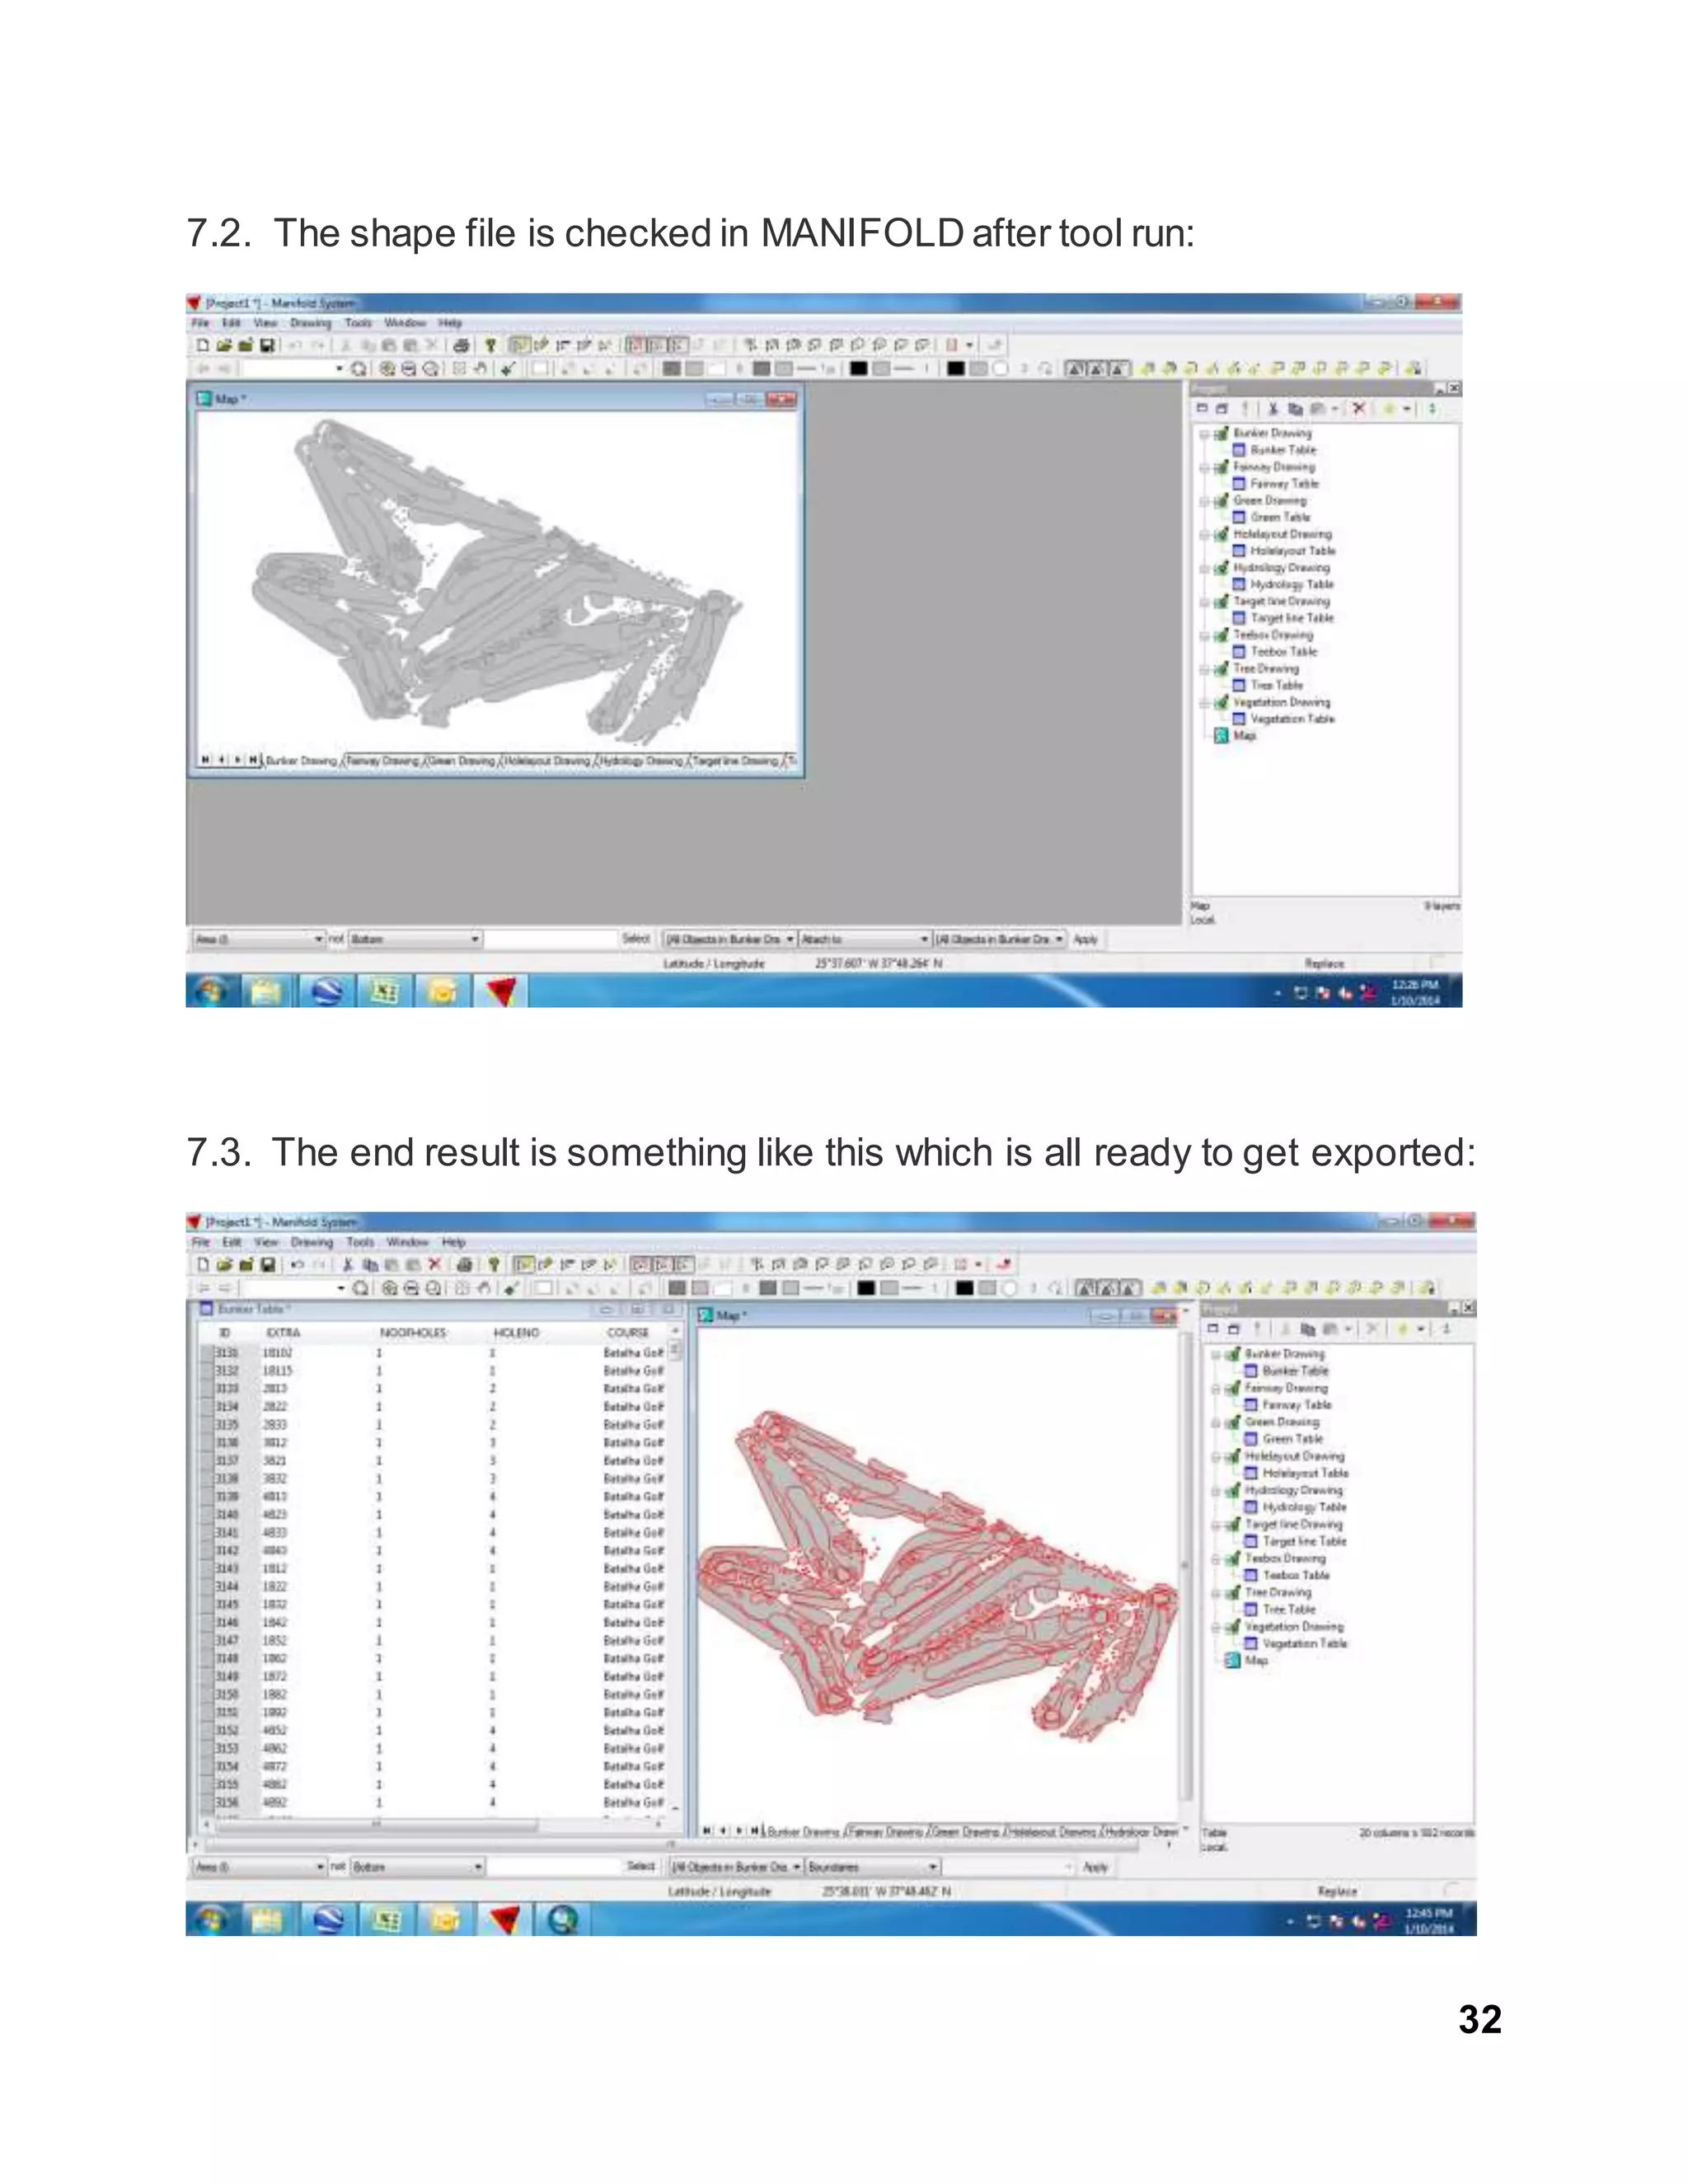
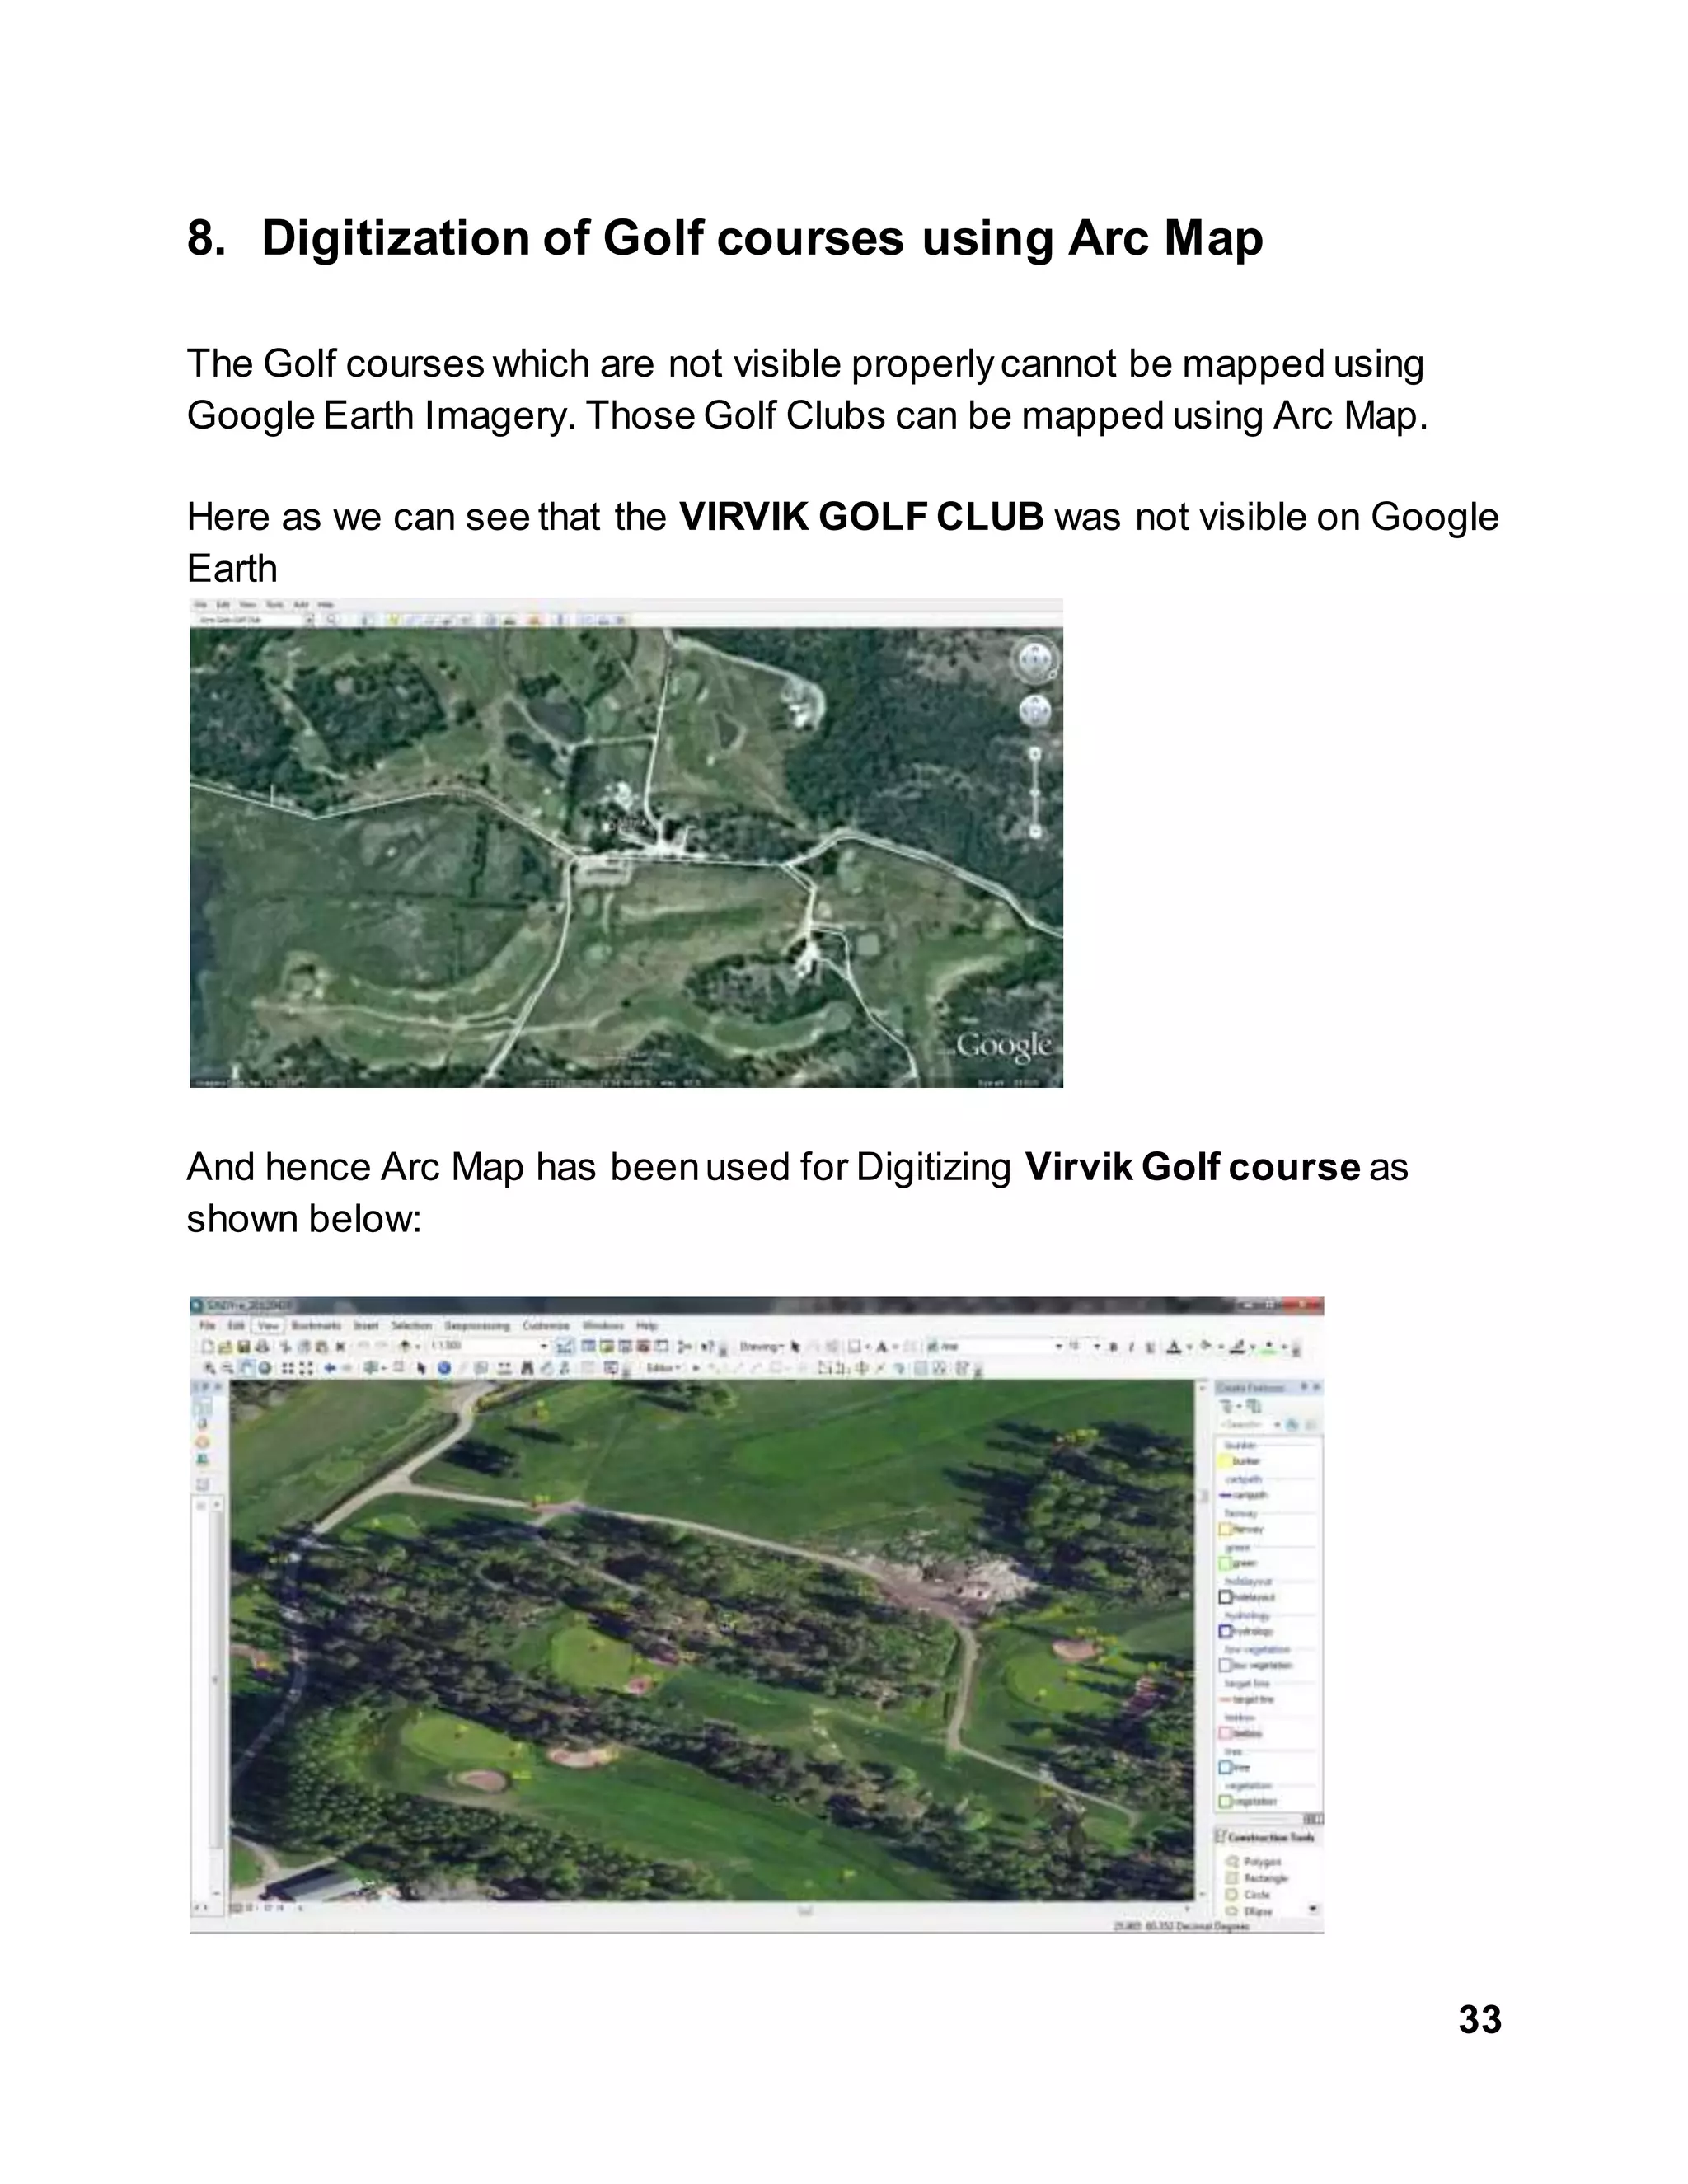
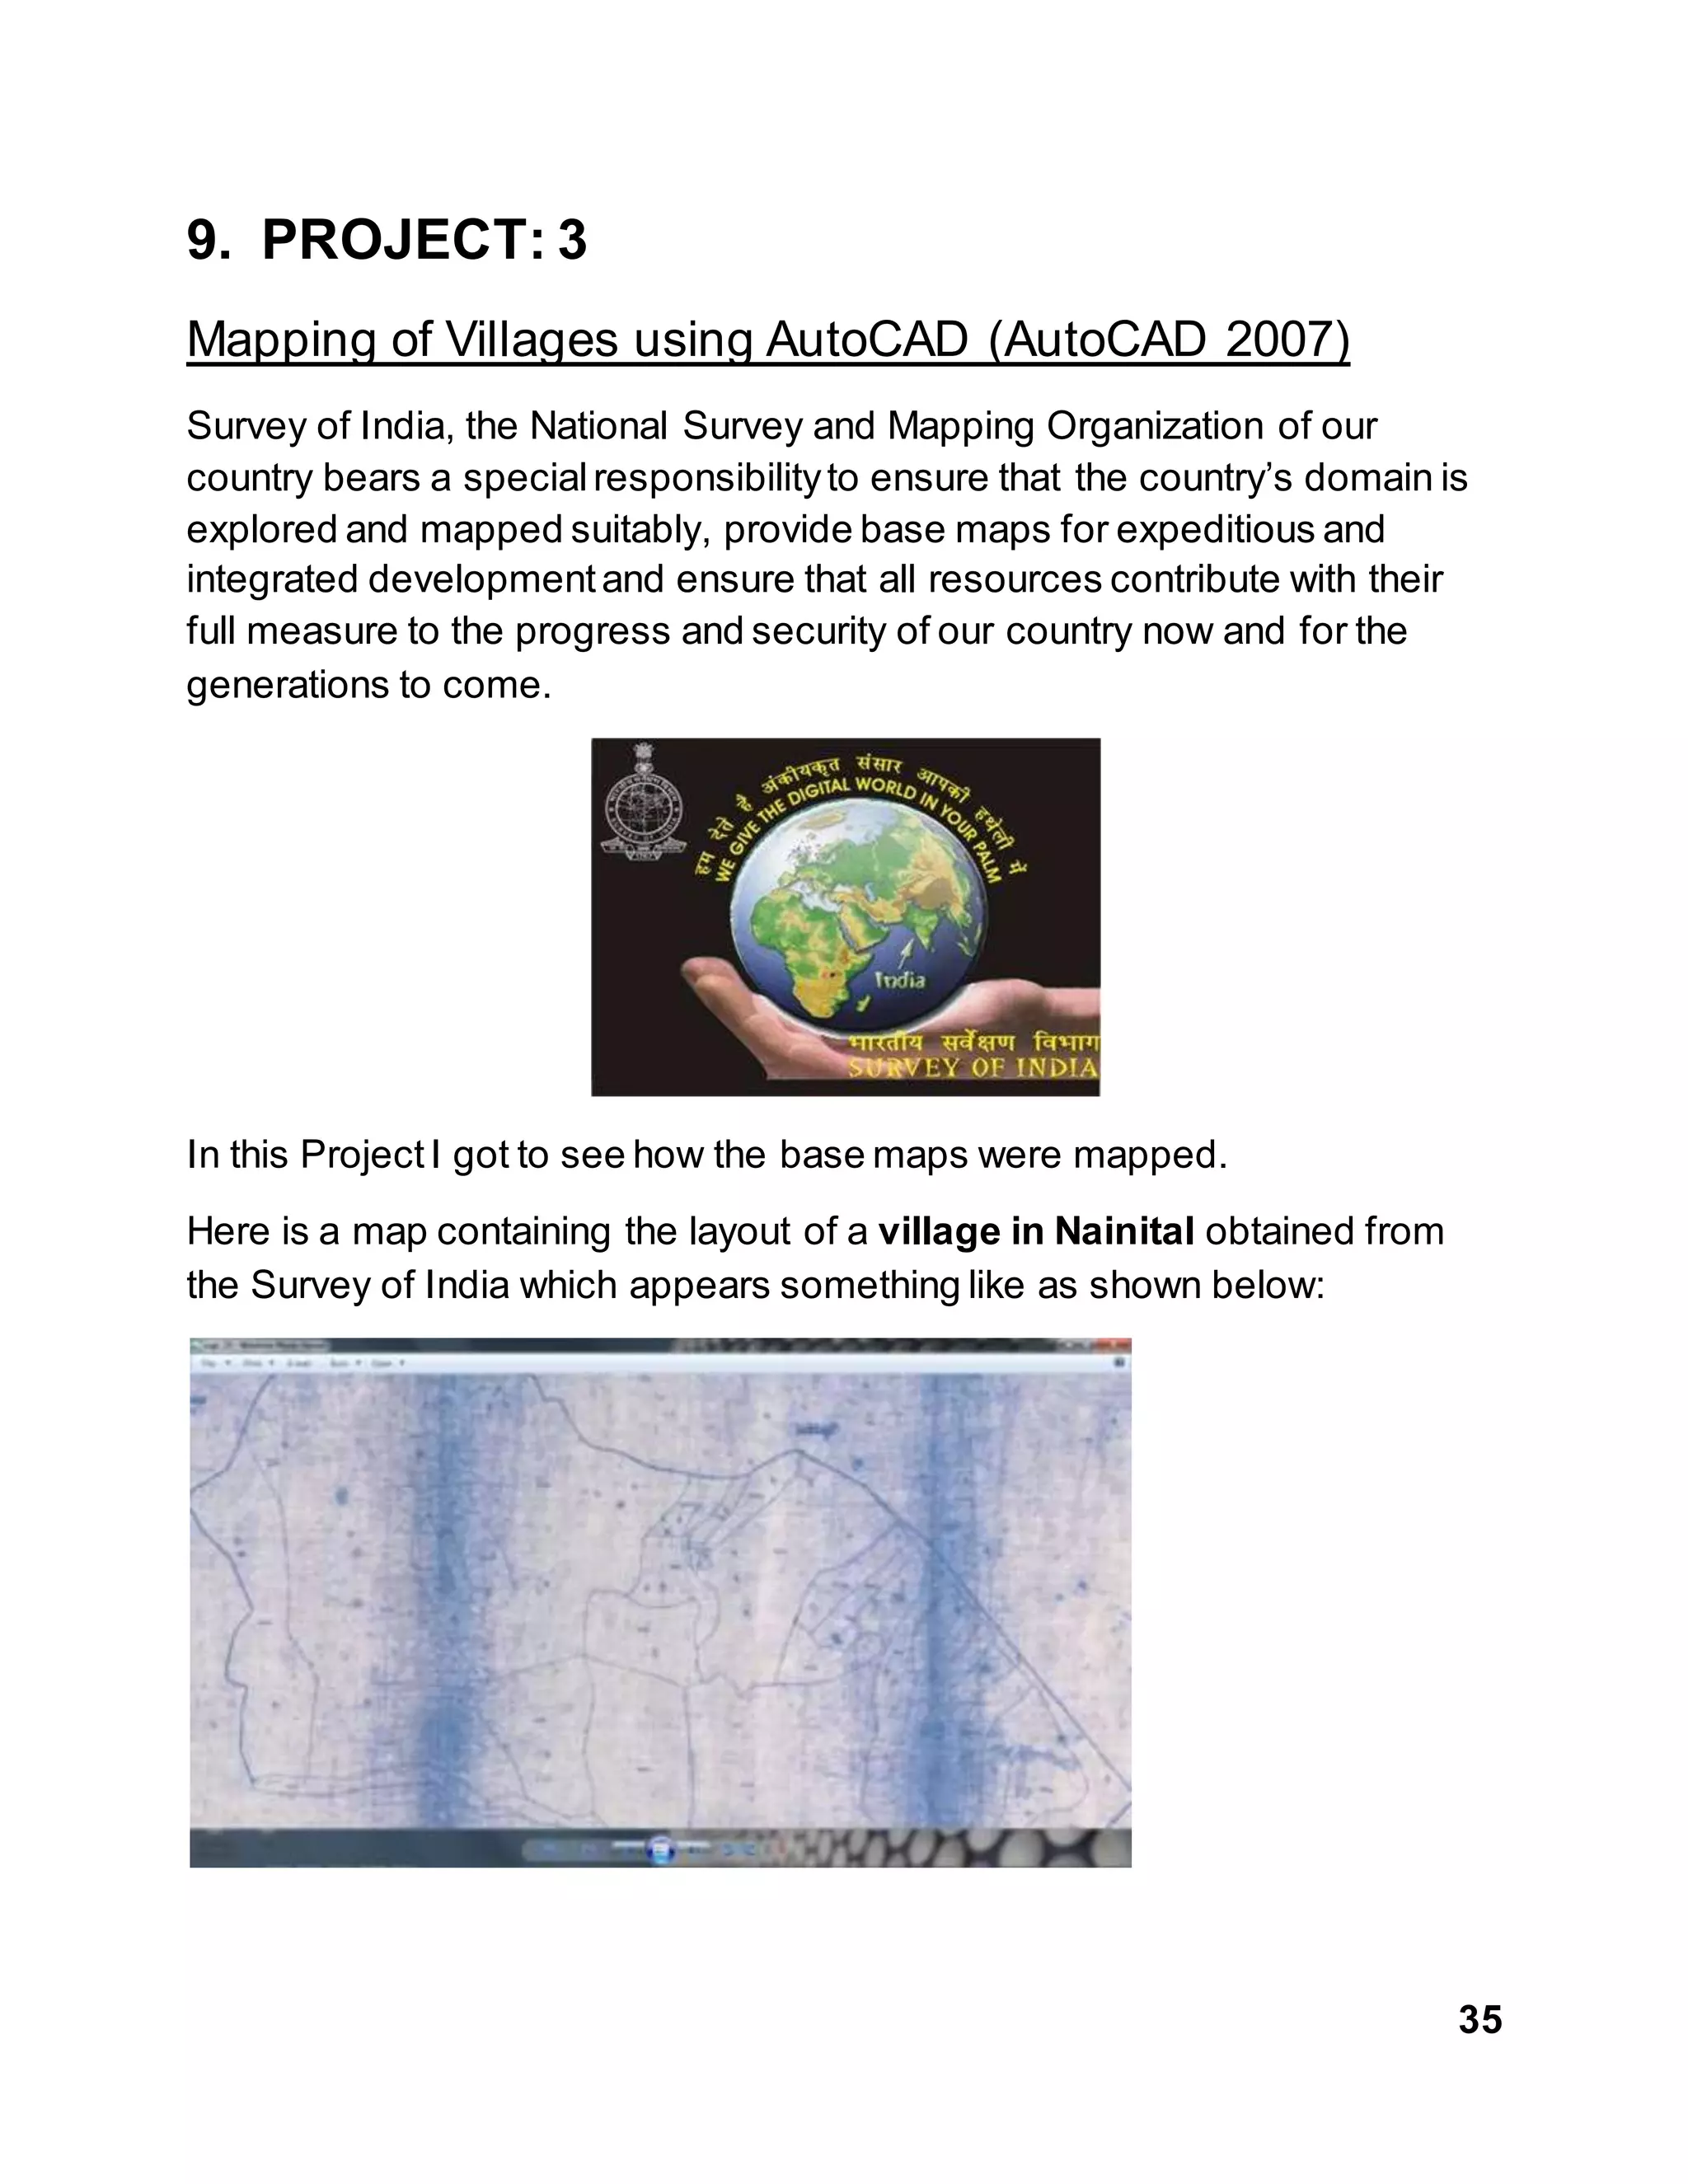
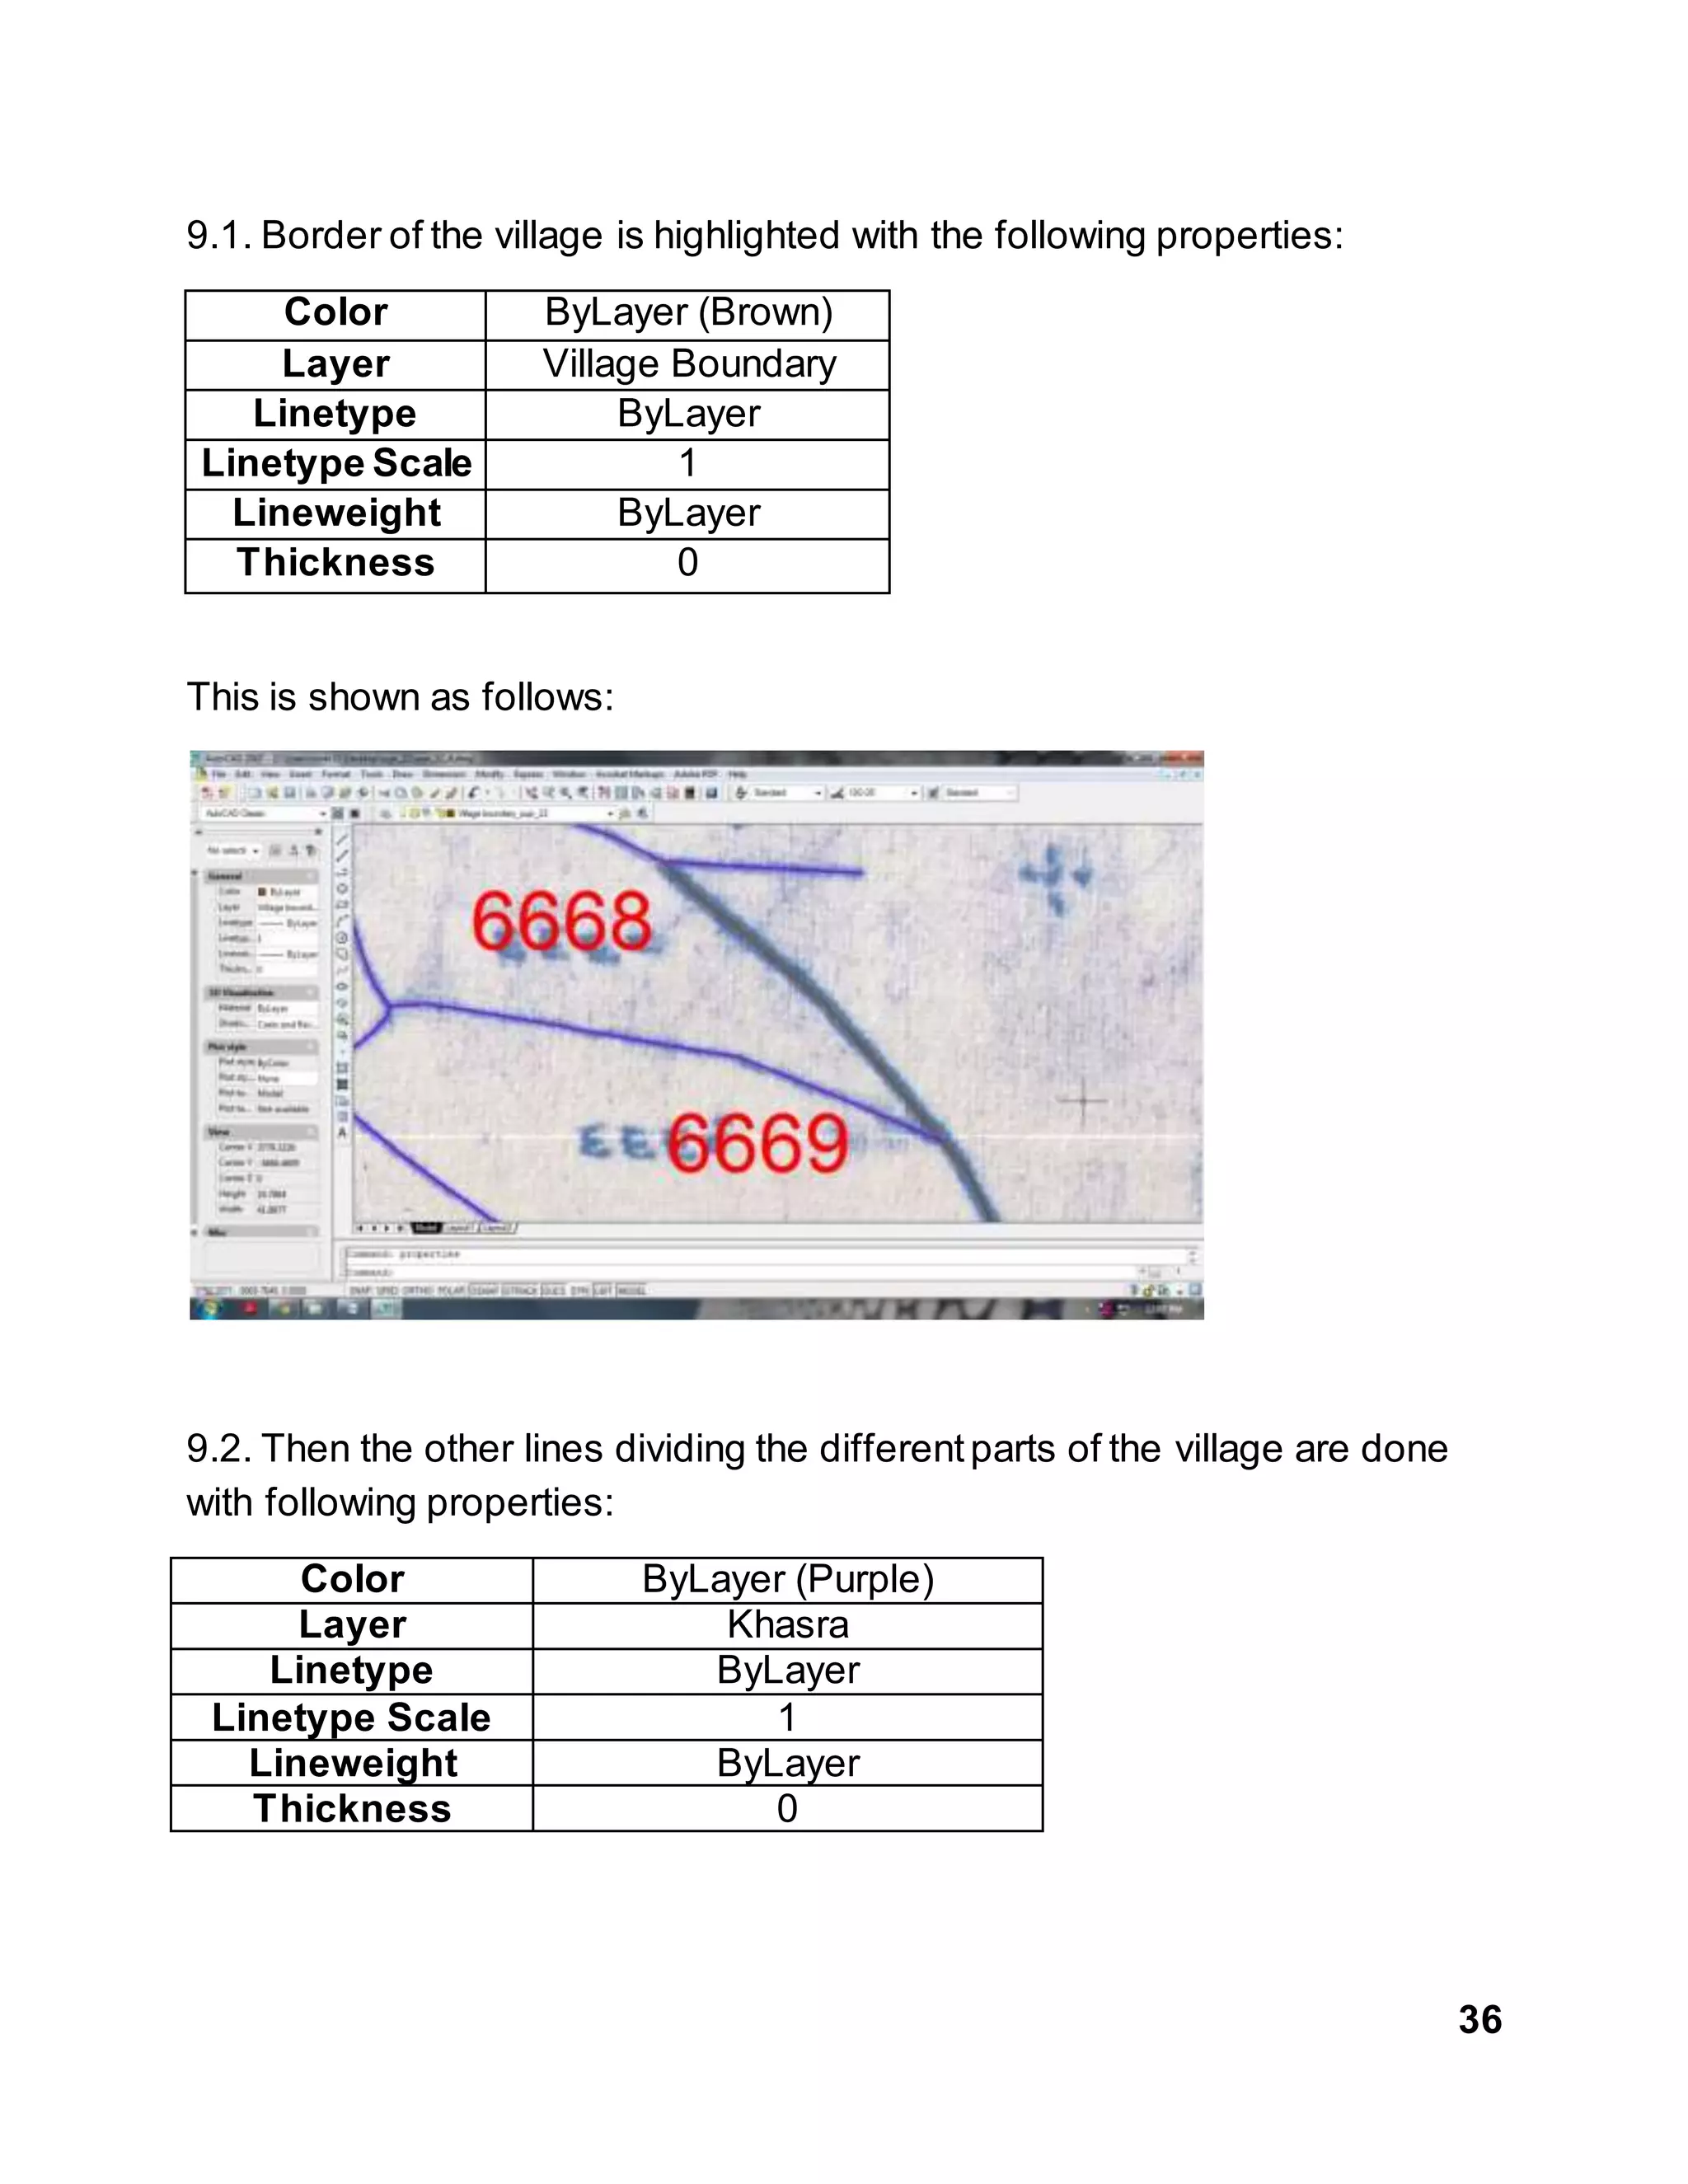
Alpana Sharan completed a 3-week internship at Toyo Computers Pvt. Ltd where she worked on various GIS projects under the supervision of Deven Lilani. She collected address and course information on golf clubs in the UK and Europe from online sources and organized it in an Excel spreadsheet. Alpana also used Google Earth to digitize golf courses by geotagging features such as tee boxes, hazards, and greens and exporting the data to KML format. Additionally, she mapped villages in AutoCAD.
1. 1
A
Project Report
On
GEOGRAPHIC INFORMATION SYSTEM (GIS)
Submitted in the fulfillment of a three week internship by
Alpana Sharan
Student of
Ramrao Adik Institute of Technology,
Nerul, Navi Mumbai
Project undertaken at:
Toyo Computers Pvt. Ltd.
Mahape, Navi Mumbai
Under the guidance of
Deven Lilani
(Managing Director)
Dec 2013 – Feb 2014
2. 2
PREFACE
Currently I am completing a Bachelor’s degree in Electronics at Ramrao Adik
Institute of Technology,Nerul, Navi Mumbai. I am in my third year. Doing a
three week internship in my winter break could serve me of great value. The
reason I choose to do this internship is because I wanted to experience the
real world work culture and also gain some new knowledge.
The reason I choose Toyo Computers for my internship is because of my
interest in information Technology.Another reason was that my uncle living
in the same building as I had recommended this.
This report documents the work done during the winter internship at Toyo
Computers Pvt.Ltd. under the supervisionof Mr.Deven Lilani.
The report first shall give an overview of the tasks and projects completed
during the period of internship with the required details. Then the results
obtained shall be discusses and analyzed.
I have tried my bestto keep report simple yet technically correct. I hope I
succeed in my attempt.
3. 3
ACKNOWLEDGEMENTS
Simply put, I could not have done this work without lots of help I received
cheerfully from the whole staff.The work culture in Toyo Computers really
motivates. Everybody is such a cheerfulcompanion here that work stress
never comes in way.
I would specially like to thank Mr.Deven Lilanifor providing me this
opportunity to work as an intern and share all his productive ideas to work
upon which has really helped me to enhance my knowledge. Not only did he
advise about my projects but listening to him has evoked a good interest in
work.
I am also highly indebted to my supervisors Mr.Bosco,Ms.Amruta , Ms.
Pallaviand Ms.Poonam who seemed to have a really great knowledge
about Geographic Information System (GIS) and solutions to all my
problems.
4. 4
ABSTRACT
This report presents the differenttasks completedduring the winter
internship which is listed below:
Detailed understanding about Geographic Information Technology
(GIS).
Data collectionof Different Golf courses in United Kingdom and
Europe using Internet and MicrosoftOffice Excel.
Data collectionby Google Earth imagery using Keyhole mark-up
Language (KML) Extractor.
Digitization (mapping) of Golf courses using Google Earth Imagery.
Digitizing of Golf courses using Arc Map.
Mapping of villages using AutoCAD.
5. 5
TABLE OF CONTENTS
1. Introduction ………………………………………………………………….7
2. Project: 1……………………………………………………………………10
2.1. Sources………………………………………………………………10
2.1.1. England Golf…………………………………………………10
2.1.2. Golf Club Website…………………………………………...10
2.2. Explanation on AddressData and course Information………....11
2.2.1. Golf Club Data……………………………………………....11
2.2.2. Golf Pro Data………………………………………………..12
2.2.3. Golf Course Data…………………………………………....13
2.2.4. Additional Files……………………………………………....13
3. Project: 2(a)……………………………………………………………......16
3.1. Delivery Format…………………………………………………......16
3.2. Golf Scorecards and maps………………………………..............16
3.2.1. Clubhouse Car Park………………………………………...18
3.2.2. Tee Box……………………………………………………....18
3.2.3. Carry………………………………………………………….20
3.2.4. Dog Legs……………………………………………………..20
3.2.5. Water………………………………………………………….20
3.2.6. General Hazards…………………………………………….21
3.2.7. Greens………………………………………………………..21
4. Project: 2(b)…………………………………………………………..........26
4.1. Digitization Process………………………………………………...26
5. Software Used……………………………………………………………..27
6. Steps for Mapping…………………………………………………………27
7. Tool Run……………………………………………………………………31
7.1. KMZ file………………………………………………………………31
7.2. KMZ file opened in Manifold……………………………………….31
8. Digitizing using Arc Map…………………………………………………..33
9. Project: 3 Mapping of Villages using AutoCAD…………………..........35
9.1. Borderof the Village……………………………………..................36
9.2. Other dividing Lines…………………………………………………..36
7. 7
1. INTRODUCTION
A Geographic InformationSystem (GIS) is a computersystem capable of
assembling,storing, manipulating and displaying geographically referenced
information, i.e. data identified according to their locations. Practitioners also
regard the total GIS as including operating personneland the data that go
into the system.
8. 8
In other words we can say that Geospatial information is data referencedto
a place - a set of geographic coordinates which can often be gathered,
manipulated, and displayed in real time. In recent years consumerdemand
has skyrocketed for geospatialinformation and for tools like GIS to
manipulate and display geospatial information.
Global Positioning System (GPS) data and their integration with digital maps
have led to the popular handheld or dashboard navigation devices used daily
by millions.
The federal governmentand policy makers increasingly use geospatial
information and tools like GIS for producing floodplainmaps, conducting the
Census, mapping and responding to natural hazards such as wildfires and
hurricanes. For policy makers, this type of analysis can greatly assist in
clarifying complexproblems that may involve local, state, and federal
government, and affectbusinesses and residential areas.
9. 9
Toyo Computers has enabled me to learn digital mapping and geospatial
services to Golf courses.The printed course map, though invaluable, has
become an outdated tool. It is used constantly for a variety of functions like
irrigation and landscape planning as well as for maintenance of greens, tees
and fairways. Geospatial mapping technologies enablesgolf course
superintendents,owners, committees,architects, etc. to view their sites from
two- and three-dimensionalperspectives.The visual representation allows
for better communication between course personnel,vendors, insurers and
governments agencies establishing accurate area and linear measurements.
10. 10
The various projects on which I worked upon have been describedbelow-
1. PROJECT: 1
Collection of Address data and course information of Different Golf
courses in United Kingdom and Europe using Internet and
Microsoft Office Excel.
A list was provided containing all the golf clubs for which the address
data was needed.Every row of this list had all the data of one club.
2.1. Sources
There are two reliable sources foraddress data of golf clubs in England
2.1.1.England Golf :
The major source foraddress data of English golf clubs is the England Golf
Federation’s website: http://www.englandgolf.org/golfcentral/
2.1.2.Golf club’s website:
Some of the information (i.e. ‘golf course name’ or ‘par’) is not published on
englandgolf.org.However, this information was easily found in the golf club’s
website.
11. 11
2.2. Detailed explanation on address data and course
information
The golf club listing is divided in 4 parts: Golf Club Data, Golf Pro Data, Golf
Course Information, and Additional Files.
Some explanations to the fields in this excelfile is given as follows :
Red column titles are mandatory fields.They must always be filled in. These
fields are marked red in the excel file as well as below in the explanations. If
some information concerning a mandatory field was not been able to collect,
then ‘N/A’ (not available) was written in the corresponding cellin the excel
file.
The other fields were optional. That means if the information on
englandgolf.org was found then it was added to the list. But in case there
should be no data available from englandgolf.org,these fields can be left
empty.
2.2.1. Golf Club data:
Some golf clubs do not have a golf course).In case a golf club in the list
does not have its own golf course, ‘NO COURSE’ in the first column was
written, and this field was marked red and the remaining fields were left
empty.
The structure of golf club entries on englandgolf.org is always the same.
12. 12
- Street_Address_01
Mandatory field, usually the first information in the address line on
englandgolf.org
- Address_02
Additional address information if applicable
- Address_03
Additional address information if applicable
- City_Town
Mandatory field, usually the third last information in the address line on
englandgolf.org
- State_Province
Mandatory field, usually the second last information in the address line
on englandgolf.org
- ZIP-Code
Mandatory field, usually the last information in the address line on
englandgolf.org
- Country
Mandatory field, already fulfilled by us as it is of course England for
every club.
- Club_Phone
Mandatory field
- Club_Contact
Optional field,not to be mixed up with the name of the golf professional
(see below)
- Club_Email
Mandatory field
- Club_Website
Mandatory field
2.2.2.Golf Pro Data:
These are all optional fields,i.e. the data only needs to be filled in if the data
is available from englandgolf.org
13. 13
- Pro_name
- Pro_Phone
- Pro_Email
- Pro_website
2.2.3.Golf Course Data:
Some golf clubs do have more than one golf course.The first three fields
concerning golf course data (Course_01_Name,Course_01_Holesand
Course_01_Par)must always be filled in. If a golf club has more than one
course,then the other fields starting with ‘Course_02_Name’,
‘Course_02_Holes’etc.was filled in.
2.2.4.Additional files:
Logo_Image:
This was a Mandatory field which was supposed to be collectedwith the
exact name of the golf club’s logo image.
16. 16
3. PROJECT: 2(a)
Data collection by Google Earth imagery using Keyhole
mark-up Language (KML) Extractor.
For this I have taken Roxenisse Golf Club in Netherlands.
First the FCB data or Front, Centre, Back data was referred to the original
plotted data. Rather than a drawn image on the device I had taken
measurements to pin point locations. The data that was collected has been
describedas followed:
3.1. Delivery Format
The data was first delivered in KML Format and as an XLS file.
Initially to create a KML file of the data using Google Earth:-
In Google Earth (GE) right click on “places”on the left hand column, select
“add new place” and was labelled as the name of the golf course.
As long as the “place” was highlighted all new pushpins could be added to
the folder.
The data was then added to the folder,if not within the folder the pins
had to be dragged into it.
3.2. Golf Scorecards and Maps
The golf scorecardsand maps both were needed to complete a course. This
was easily available through the clubs website.Throughout I will be using
Roxenisse GolfClub in as an example. Below is a picture of the map of the
course available on their website.
18. 18
3.2.1. Clubhouse Car Park
The clubhouse car park was added as a pushpin as with all FCB data. To
place a pushpin using GE, firstly highlight the Golf Course folderthen select
the yellow pushpin icon at the top of GE- a pin will appear on the map- this
was dragged to the relevant location. An information box will also appear-
code was placed here on the top text box.
Pushpin Code:1H
This is shown as follows:
3.2.2. Tee Box
Only one tee box needs to be logged per hole and this should be the
furthest tee
Box from the green.
Pushpin Code: 1T = First hole Tee, 2T = second hole tee, 3T = third
hole tee etc.
Most courses that are plotted have 18 holes, many others have 18 holes.
Sometimes the 9 hole courses are played twice to create 18 holes
CLUB HOUSE
19. 19
Tee Box can be shown as follows:
Golf Data Codes for Hazards
The quantity of the hazards per hole was referred to in the codes as “*”.
Bunker – Max. of 6
Tree – Max. of 3
Stream – Max. of 3
Carry – Max of 3
#B*@ - Bunker
#I*@ - Tree
#S*@ - Stream
#P@ - Path (Only 1 per hole)
#G@ - General Hazard (Only 1 per hole)
#A* - Carry (note this is not directional)
#W*- Water Front (Max three per hole, It is not directional)
#Q* - Water Back (Max three per hole, it is not directional)
#L - Dog Leg Left (one per hole)
#D - Dog Leg Right (one per hole)
Some of the Hazards require a code for direction in which they appear to the
golferstanding on the Tee facing the Green.
‘1’ - (FRONT OF GREEN)
‘2’ - (LEFT)
‘3’ - (RIGHT)
‘4’ - (CENTRE)
‘5’ - (REAR OF GREEN)
TEE BOX
20. 20
3.2.3. Carry
Carry was describedas unplayable ground- most commonly, but not solely,
found between the tee box and the start of the fairway. It should be noted
this doesn’t referto roughly cut grass but refers to hazards such as low
vegetation or a ravine or Lake Etc. The Pushpin for carry was placed at the
start of the next sectionof fairway or playable ground.
Pushpin Code:#A*
3.2.4. Dog Legs
A dog leg is a bend in the fairway that was describe as having more than a
20 degree turn from tee to green. Using the above codes I have placed a
pushpin referring to a dog leg in each directiononce per hole.
Pushpin Code: #L = Left Hand Dog Leg, #D = Right Hand Dog Leg
3.2.5. Water
Water appears on many golf courses but is not always in play. The front and
the back of the water were marked at the points they were mostin play for a
golfer.
Pushpin Code:Front#W*, Rear #Q*
This is shown as follows:
Water Hazard
21. 21
3.2.6. General Hazards
General Hazards are described as hazards not covered by any other form of
location on the database. These are unusual and generally uncommon on
the golf course but can include electricity pylons, monuments, wells,
buildings etc.
Pushpin Code:#G@
3.2.7. Greens
The Greens are the most important part of the plotting as they are the item
all golfers will be measuring to. For FCB data we mark the Front, The Centre
and the Back of the green. Using a pushpin, mark the Front (#F), the Centre
(#C) and the Rear (#R) of the green.
Pushpin Codes:Front#F,Centre #C, Rear #R
This can be shown as follows:
Once I was done with the whole layout I got to see something like as shown
below. For example - all the pushpins inside one folder.
From here, right click on the foldername, in this instance “RoxenisseGolf
Club” select “save place as” the saved location was chosenand name of the
file is same the name of the club.
GREEN
22. 22
At this point there is an option to save the file as a .KML or a .KMZ- the latter
is the default setting. A .KML file in this instance was selected from the drop
down box.
Now there was a need to use our proprietary software to convert this .KML
file into a workable spread sheet.
First the KML Coordinate Extractor was loaded.
As you can see at the bottom there are 3 options 18 hole, 18(2x9)
and 9 Hole.
You would selectthe type of course you are about to convert.
The 18 and 9 hole options are the ones you will use most oftenbut
occasionally you will need the 18(2x9) hole option- as mentioned earlier if a
nine hole course has alternative tees for the second 9 this is the option you
would select.
23. 23
Using the “SelectSource File” button I searched for the .KML of the course I
had been working on and wish to convert. Then I selected the file and the
course type then simply press Extract Coordinates.
At this point the software will search through the .KML and ensure there are
no errors. If the course is all correctthen a new box stating that a CSV File
has been created and saved successfully – an example of this is here.
24. 24
If there are any errors in the data recorded,it could be seen in the box at the
top of the page- sometimesyou will need to scroll down to view it within the
list of locations.
I have now created a CSV file, almost there. Using MicrosoftExcel or similar
I opened the CSV file and was presented with this spread sheet:-
Scrolling across to the right of the screen you various columns and cells with
numbers can be seen
.
The only thing left was to fill in the clubs details and the scorecard
information. This was usually found on the golf clubs website.
It appears something like this:
26. 26
4. PROJECT: 2(b)
Digitization (mapping) of Golf courses
Digitizing is the process bywhich coordinates from a map, image, or other
sources of data are converted into a digital format in a GIS.This process
becomes necessarywhen available data is gathered in formats that cannot
be immediately integrated with other GIS data.
4.1. The Digitizing process
This method involves scanning a map or image into a computer. The
digitizer then traces the points, lines and polygons using digitizing software.
This method of digitizing has been named "heads-up" digitizing because the
focus of the user is up on the screen,rather than down on a digitizing tablet.
It has largely replaced manual digitizing because of its speed and accuracy.
It is, however, limited to using scans of high quality maps and images.Since
the tracing is done on a computer, lines can be set to snap together and
polygons can be programmed to share an edge thus removing accidental
sliver polygons.
I started this projectduring the second week of my internship. In this Project,
digitization (mapping) of Golf courses was done using Google Earth.
27. 27
The main objective formapping golf courses is to capture the features that
one comes across when a golferplays the game. The reference golf layout
and the scorecard inputs are taken from the precise website and later the
place marks (pinpoints) are represented the location of Tee box, Fairway,
Green, Hydrology, Cart path, Bunker, Tree and Vegetation. The scorecard
contents information of no. of holes in a game along with their Par and
yardage details.
The output data of the golf course will have the attribute (GIS format) for
each feature that is represented in a Golf course.
5. Software used: Google Earth, Arc Map
6. Following are the steps in which the Mapping was carried
out:
Initially the layout of Roxenisse GolfClub as taken in the previous
Project was taken from its website.
This layout is then used for mapping.
I started with outlining the Fairways.Satellite view at full zoom
enables to see where the boundaries of the Fairways actually are.
28. 28
Next the Greens are outlined as they are very similar to the Fairways
as shown below :
29. 29
Then the boundary of Tee box or Tee locations was done.There may
be multiple tees per hole, each was outlined separately as shown :
Then the Sand bunkers were outlined in a similar manner.
30. 30
The water Hazards were also outlined.
Any golf cart paths as a Road with the priority as no auto traffic was
marked.
The vegetation along with the trees was marked.
The entire boundary of the hole playing area including the green,
fairway and tees were outlined. This area was usually lined with trees
or paths.
The color code used is as follows:
The resultwas something like shownas follows:
31. 31
7. Tool Run
7.1. The KMZ file was tool run:
7.1. Then the KMZ file is opened in MANIFOLD:
32. 32
7.2. The shape file is checked in MANIFOLD after tool run:
7.3. The end result is something like this which is all ready to get exported:
33. 33
8. Digitization of Golf courses using Arc Map
The Golf courses which are not visible properlycannot be mapped using
Google Earth Imagery. Those Golf Clubs can be mapped using Arc Map.
Here as we can see that the VIRVIK GOLF CLUB was not visible on Google
Earth
And hence Arc Map has beenused for Digitizing Virvik Golf course as
shown below:
35. 35
9. PROJECT: 3
Mapping of Villages using AutoCAD (AutoCAD 2007)
Survey of India, the National Survey and Mapping Organization of our
country bears a specialresponsibilityto ensure that the country’s domain is
explored and mapped suitably, provide base maps for expeditious and
integrated developmentand ensure that all resources contribute with their
full measure to the progress and security of our country now and for the
generations to come.
In this ProjectI got to see how the base maps were mapped.
Here is a map containing the layout of a village in Nainital obtained from
the Survey of India which appears something like as shown below:
36. 36
9.1. Border of the village is highlighted with the following properties:
Color ByLayer (Brown)
Layer Village Boundary
Linetype ByLayer
Linetype Scale 1
Lineweight ByLayer
Thickness 0
This is shown as follows:
9.2. Then the other lines dividing the differentparts of the village are done
with following properties:
Color ByLayer (Purple)
Layer Khasra
Linetype ByLayer
Linetype Scale 1
Lineweight ByLayer
Thickness 0
37. 37
This is displayed as:
9.3. The whole layout is completed in this manner as shown:
38. 38
10. CONCLUSION
Overall, I had a fantastic experience of learning. I feelextremely fortunate
that I had the opportunity to experience the work culture in Toyo Computers.
I have gained a lot of knowledge,skills and also met many new people.
I got insight into professionalpractice. Initially I started with the
understanding about what exactly Geographic Information System (GIS)
was. Then I learnt the collectionof data mainly Address data and course
information of differentGolf clubs in UK and Europe. I learnt how the layouts
of golf courses were exported overseas.This was done first by collecting
data (layouts of Golf courses)using Google Earth followed by extracting this
data file in KML.I have also seen how maps got digitized(Mapped).
Digitization was done by converting the file into KMZ format and checking it
in Manifold. I saw the golf clubs which were not visible properlyon Google
Earth could be mapped in Arc Map. I also learnt the mapping of the base
maps obtained from the Survey of India using AutoCAD.
This internship has also taught me what my strengths and weaknesses are.
This helped me to define what skills and knowledge I have to improve in the
coming time.
At last this internship has brought in me the interest and motivation to learn
more in this field.