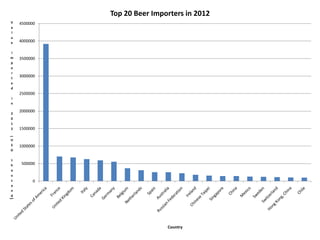
SlideShare a Scribd company logo
1 of 21
A Preliminary Analysis
of
International Expansion
Opportunities
Top 10 Markets Cross Border Consultants
Identified for Beer Exports
US Beer Exports
2012 ($)
US Export Growth
from
2008 - 2012 (%)
Total Beer Imports
2012 ($)
US Market
Share
GDP
(trillion)
GDP Per
Capita ($)
Population
Beer
Consumption
Per Capita 2010
(liters)
Australia 15,299,920.00 39 254,540,000.00 6% 1.542 43,300.00 22,262,501 81
Canada 144,508,026.00 40 594,121,000.00 24% 1.819 43,400.00 34,568,211 68
China 2,923,635.00 1,479 144,173,000.00 2% 8.227 9,300.00 1,349,585,838 32
Colombia 4,188,835.00 333 16,594,000.00 25% 0.366 11,000.00 45,745,783 37
France 153,035.00 3,533 703,990,000.00 0.02% 2.609 36,100.00 65,951,611 35.5
Germany 1,089,908.00 358 553,992,000.00 0.10% 3.401 39,700.00 81,147,265 107
Mexico 102,010,139.00 19 129,947,000.00 78% 1.177 15,600.00 116,220,947 57
Spain 455,415.00 704 255,874,000.00 0.10% 1.352 15,600.00 47,370,542 70
UK 6,372,011.00 -15 676,348,000.00 0.90% 2.441 37,500.00 63,395,574 74
Turkey 3,992,224.00 29,472 3,651,000.00 109% 0.794 15,200.00 80,694,485 13
0
5,000
10,000
15,000
20,000
25,000
30,000
35,000
40,000
45,000
50,000
VolumeofConsumption(thousandkiloliters)
Red = 2010 Blue = 2009
Top 20 Countries in Beer Consumption
0
20
40
60
80
100
120
140
Per-CapitaVolumeofConsumption(liters)
Country
Per-Capita Beer Consumption by Country in 2010
0
500000
1000000
1500000
2000000
2500000
3000000
3500000
4000000
4500000V
a
l
u
e
i
m
p
o
r
t
e
d
i
n
2
0
1
2
(
U
S
D
t
h
o
u
s
a
n
d
)
Country
Top 20 Beer Importers in 2012
Sales Volume in American Dollars ($) from 2008 - 2012
Top 20 Importers of American Brewed Beer
Country 2008 2009 2010 2011 2012
Canada $103,575,431.00 $177,515,501.00 $188,386,611.00 $132,514,399.00 $144,432,007.00
Mexico $85,973,894.00 $84,809,727.00 $84,566,930.00 $95,585,638.00 $101,973,639.00
Paraguay $7,744,703.00 $6,215,744.00 $15,629,851.00 $26,788,415.00 $38,619,858.00
Chile $2,489,218.00 $3,489,566.00 $8,966,939.00 $14,381,455.00 $31,800,116.00
Panama $6,966,764.00 $9,228,348.00 $11,412,217.00 $11,937,601.00 $16,134,426.00
Australia $10,962,986.00 $14,602,100.00 $5,899,784.00 $6,603,786.00 $15,299,920.00
Sweden $2,704,562.00 $3,037,015.00 $3,619,651.00 $5,525,515.00 $8,359,367.00
Taiwan $10,876,939.00 $9,584,705.00 $8,312,904.00 $8,217,569.00 $8,052,005.00
United Kingdom $7,478,150.00 $3,755,665.00 $5,087,142.00 $4,770,087.00 $6,405,923.00
Korea $9,128,615.00 $5,013,181.00 $5,304,875.00 $5,170,384.00 $5,714,585.00
Honduras $1,701,531.00 $2,942,796.00 $2,405,043.00 $3,380,291.00 $5,340,423.00
Colombia $967,763.00 $1,515,665.00 $2,050,875.00 $2,776,919.00 $4,188,835.00
Turkey $13,500.00 $15,120.00 $38,296.00 $275,528.00 $3,992,224.00
UEA $3,944,184.00 $3,272,454.00 $3,752,878.00 $4,025,083.00 $3,619,354.00
Japan $1,524,212.00 $1,795,359.00 $2,161,214.00 $2,868,938.00 $3,330,751.00
Guatemala N/A N/A N/A $728,553.00 $3,012,753.00
China $185,122.00 $168,136.00 $546,417.00 $4,033,338.00 $2,923,635.00
Bahamas $3,125,855.00 $3,086,930.00 $2,475,883.00 $2,666,051.00 $2,853,801.00
Singapore $1,473,983.00 $679,604.00 $759,015.00 $1,080,148.00 $2,633,976.00
Hong Kong $2,890,149.00 $2,357,984.00 $2,558,468.00 $2,646,272.00 $2,489,753.00
Sales Volume ($) of US Brewed Beer in Top Growth Markets
Top 20 Growth Markets from 2005 - 2012
Country 2005 2006 2007 2008 2009 2010 2011 2012
Turkey $0.00 $101,554.00 $59,223.00 $13,500.00 $15,120.00 $38,296.00 $275,528.00 $3,992,224.00
Brazil $12,759.00 $51,596.00 $46,282.00 $24,858.00 $84,604.00 $377,326.00 $3,172,353.00 $1,654,882.00
France $0.00 $0.00 $2,617.00 $4,212.00 $11,186.00 $61,478.00 $14,494.00 $153,035.00
Thailand $40,546.00 $36,325.00 $14,208.00 $6,521.00 $51,194.00 $106,293.00 $158,253.00 $211,890.00
China $91,168.00 $221,426.00 $430,666.00 $185,122.00 $168,136.00 $546,417.00 $4,033,338.00 $2,923,635.00
El Salvador $177,724.00 $231,076.00 $128,157.00 $53,193.00 $44,141.00 $4,756.00 $136,330.00 $762,076.00
Uruguay $0.00 $0.00 $2,606.00 $25,123.00 $92,193.00 $153,507.00 $292,827.00 $356,026.00
Chile $0.00 $0.00 $186,648.00 $2,489,218.00 $3,489,566.00 $8,966,939.00 $14,381,455.00 $31,800,116.00
Costa Rica $42,636.00 $64,694.00 $66,992.00 $197,346.00 $365,179.00 $659,789.00 $1,404,205.00 $1,952,158.00
Malta $0.00 $0.00 $37,542.00 $18,891.00 $75,176.00 $61,771.00 $69,816.00 $163,894.00
Spain $0.00 $107,530.00 $3,300.00 $56,634.00 $112,696.00 $41,559.00 $248,133.00 $455,415.00
Italy $56,813.00 $29,045.00 $112,642.00 $152,586.00 $281,670.00 $258,111.00 $423,236.00 $1,009,768.00
Philippines $0.00 $4,200.00 $26,091.00 $41,109.00 $129,978.00 $169,993.00 $312,126.00 $250,423.00
New Zealand $205,492.00 $61,467.00 $62,889.00 $216,821.00 $418,683.00 $676,902.00 $941,871.00 $1,255,793.00
Paraguay $246,211.00 $508,491.00 $2,127,738.00 $7,744,703.00 $6,215,744.00 $15,629,851.00 $26,787,115.00 $38,537,818.00
Israel $98,031.00 $72,364.00 $47,065.00 $40,304.00 $68,296.00 $1,029,216.00 $169,707.00 $194,200.00
Germany $422,860.00 $470,515.00 $1,114,378.00 $238,081.00 $362,194.00 $1,881,009.00 $990,065.00 $1,089,908.00
Colombia $261,214.00 $1,021,911.00 $1,531,235.00 $967,763.00 $1,515,665.00 $2,050,875.00 $2,776,919.00 $4,188,835.00
Anguilla $10,600.00 $10,080.00 $10,800.00 $23,936.00 $25,133.00 $32,632.00 $82,747.00 $88,741.00
Target Market Demographics
Population
Population growth
rate (%)
Literacy (%)
Unemployment
(%)
GDP (trillion)
GDP growth rate
(%)
GDP per
capita
Inflation rate
(%)
Country Risk*
Australia 22,262,501 1.11 99 5.2 1.542 3.6 $43,300.00 1.8 A2
Canada 34,568,211 0.77 99 7.3 1.819 1.8 $43,400.00 1.5 A1
China 1,349,585,838 0.46 95.1 6.5 8.227 7.8 $9,300.00 2.6 A3
Colombia 45,745,783 1.1 93.6 10.4 0.366 4 $11,000.00 3.2 A4
France 65,951,611 0.47 99 10.3 2.609 0 $36,100.00 2.2 A3
Germany 81,147,265 -0.19 99 5.5 3.401 0.7 $39,700.00 2.1 A2
Mexico 116,220,947 1.07 93.5 5 1.177 3.9 $15,600.00 4.1 A4
Spain 47,370,542 0.73 97.7 25.1 1.352 -1.4 $31,100.00 2.4 B
UK 63,395,574 0.55 99 8 2.441 0.2 $37,500.00 2.8 A3
Turkey 80,694,485 1.16 94.1 9.2 0.794 2.6 $15,200.00 8.9 A4
* Based on a scale of A1, A2, A3, A4, B, C and D. Coface's
estimate of the average credit risk on a country’s businesses.
This is giving an indication of a country’s potential influence
on businesses’ financial commitments. Of course, there may
be some very solid businesses in high-risk countries, just as
there may be some risky ones in reliable countries. The
overall risk is thus a combination of business-specific factors
and factors relating to the country in which the business
operates.
Target Market Business Climate
Business climate Coface*
Index of
Economic Freedom**
Economic Freedom
of the World^
World Bank
Doing Business~
Australia A1 3 10 10
Canada A1 6 8 17
China B 136 123 91
Colombia A4 37 96 45
France A1 62 40 34
Germany A1 19 19 20
Mexico A4 50 94 48
Spain A1 46 32 44
UK A1 14 12 7
Turkey A4 69 68 71
*Evaluating the business environment involves measuring the quality of a country’s private sector governance
– in other words businesses’ financial transparency and the effectiveness of the courts in settling debts. This
assessment relies on Coface’s worldwide network and the expertise deriving from its experience in
underwriting risks, investigating companies and managing receivables. Coface's business environment
evaluations use a seven-level ranking. In ascending order of risk these are: A1, A2, A3, A4, B, C and D.
**The Index of Economic Freedom, an annual guide published by The Wall Street Journal and The Heritage
Foundation, measures liberty, prosperity and economic freedom by creating 10 benchmarks that gauge the
economic success of 185 countries around the world. The rankings are on a scale of 1 - 185.
^The index published by the Fraser Institute's Economic Freedom of the World measures the degree to which
the policies and institutions of countries are supportive of economic freedom. The cornerstones of economic
freedom are personal choice, voluntary exchange, freedom to compete, and security of privately owned
property. Forty-two data points are used to construct a summary index and to measure the degree of
economic freedom in five broad areas: (1) size of government: expenditures, taxes, and enterprises; (2) legal
structure and security of property rights; (3) access to sound money; (4) freedom to trade internationally; and
(5) regulation of credit, labor and business. The rankings are on a scale of 1 - 152.
~The World Bank's annual Doing Business Project. Economies are ranked on their ease of doing business, from
1 – 185. A high ranking on the ease of doing business index means the regulatory environment is more
conducive to the starting and operation of a local firm. This index averages the country's percentile rankings on
10 topics, made up of a variety of indicators, giving equal weight to each topic. The rankings for all economies
are benchmarked to June 2012.
Why Use Economic
“Freedom” indexes?
The relationship between economic
freedom and prosperity is
strong. Using the Index of Economic
Freedom where economies are scaled
on a range from 80 – 100 which are
“most free,” 70 - 79.9 , which are
“mostly free,” 60 – 69.9, which are
“moderately free,” 50 – 59.9, which
are “mostly unfree,” and 0 – 49.9,
which are “repressed.” Looking at the
bar chart we can determine countries
that tilt toward market economics
have healthy GDP per capita figures.
For example, US consumer spending
accounts for 70 percent of GDP and
has a ranking of 76. We can assume
similar markets’ consumers’
purchasing power are in a better
position than their lower ranked,
international peers to buy foreign
goods.
$0.00
$5,000.00
$10,000.00
$15,000.00
$20,000.00
$25,000.00
$30,000.00
$35,000.00
$40,000.00
Least
Free
Third Second Most
Free
GDPpercapitaPPP(US$2011)
Economic Freedom Quartile
Australia Opportunities and Challenges
• Favorable tariff schedule under U.S.-Australia Free Trade Agreement (AUSFTA)
• Australia was ranked fourth internationally in per capita beer consumption, at
around 110 litres per year
• The overwhelming proportion of beer produced is lager (approximately
95%), the most popular among Australian beer drinkers.
Opportunities
• Strong Australian dollar will translate into cheaper imported goods
Challenges
• Company bankruptcies accelerated in the first eight months of 2012 and
payments could continue to be delayed
• Household consumption will continue to drive growth in 2013, but the rise in
spending will be less sustained
• In World Bank’s Doing Business report Australia ranked 44 out of 185 in terms
of trading across borders
• Discretionary spending will remain tight with households preferring to
build up their precautionary savings
Canada Opportunities and Challenges
Opportunities
• The top selling style of beer in Canada, by far, is the pale lager
• Regarding spending, Canadians in 2013 and 2014 will reduce their savings to
compensate for modest increase in real wages.
• Many factors will help sustain business spending: U.S. QE3, lower taxes, and
competitive prices for imported products thanks to strong Canadian dollar
• By volume, imported beer more than doubled its market share in past decade.
In 2009, imported beer captured 13% of market, up from six per cent in 1999
Challenges
• Per-capita beer sales have dropped 28 per cent from their peak of 115.2 litres
in 1976 to 83.5 litres in 2009
• High household debt level
• Canadian customs documentation, bilingual labeling, packaging requirements, and
Canadian federal and provincial sales tax accounting can be surprisingly challenging
• Increasing competition in a number of sectors translates into a need for
competitive pricing, aggressive, flashy marketing, and deep discounts for agents
and distributors
China Opportunities and Challenges
Opportunities
• In 2010 China eased trade finance by relaxing its trade credit rules
• Gradual move up-market
• Household consumption continues to grow moderately
• By 2020, China‘s middle class is expected to account for around 45 percent of
the population, or approximately 700 million people.
Challenges
• Share of consumption in GDP remains weak: rebalancing China’s growth
model remains a medium term challenge
• Overcapacity in industry and trade
• China often lacks predictability in its business environment. China‘s current legal
and regulatory system can be opaque, inconsistent, often arbitrary, and corrupt
• While the outright prohibition of foreign invested firms to import, export and
distribute goods in China has improved, the licensing and approval process
remains difficult, time consuming and highly opaque
Colombia Opportunities and Challenges
Opportunities
• The growing popularity of beer among Colombia's middle classes is predicted
to increase volume sales by about 14% between 2012 and 2017. The growing
appreciation of international premium varieties means that sales are expected
to grow at a slightly faster rate
• Leading international brands are gradually finding markets in wealthy
metropolitan areas, which will lead to an increase in consumption
• Beer receives immediate duty-free treatment since May 2012
• A strong Colombian peso against the U.S. dollar is favoring U.S. exports
Challenges
• Many other trade agreements has increased competition for U.S. products
• Internal transportation costs from ports of entry are costly due extremely
poor infrastructure
• Colombia’s bureaucracy still constitutes a barrier to trade for both local and
foreign companies
• U.S. suppliers should be aware that their ability to compete in Colombia could be
hampered by unfair business practices such as
contraband, counterfeiting, intellectual property rights violations, under-
invoicing, money laundering, and dumping.
France Opportunities and Challenges
Opportunities
• High savings level, low household debt
• Most beer sold in France is mass-produced, with major breweries having
control of over 90% of the market and pilsner lagers predominating
• An increasing interest in American culture, younger consumers, and
changing lifestyles contribute to France’s import demand for American food
and beverage products
• In 2009 France speeded up and simplified its customs clearance procedures
by introducing an electronic customs declaration and eliminating certain
documents
Challenges
• The rise in unemployment, low business profitability, loss of confidence, and
the significant fiscal shock suggest that there will be a fall in domestic demand
• Household consumption will continue to slow in response both to more
job losses and lower purchasing power
• Business profit margins are at their lowest levels since 1985
• Overall beer consumption was down 14% between 1991 and 2010
German Opportunities and Challenges
Opportunities
• A 2010 report showed that Germany ranked second in terms of per-capita
beer consumption, behind the Czech Republic and ahead of Austria (third)
and Ireland (fourth)
• Germany is the 5th largest U.S. trading partner globally and the top importer
of U.S. goods in the EU (in 2011)
• Price is not necessarily the determining factor for the German buyer, given
the German market’s demand for quality
• The strong growth of sales to non-European countries will only partially offset
declining or weak growth in European countries. At the same time, imports
could accelerate slightly in line with household demand.
Challenges
• While not directly discriminatory, government regulation by virtue of its
complexity may offer a degree of protection to established local suppliers
• GDP grew by 0.7% in 2012. Forecasts show annual growth of 0.4 percent in 2013
• Demographic decline
• Some German entrepreneurs with selective experience with U.S. companies are
skeptical about their long-term commitment and after-sales support
Mexico Opportunities and Challenges
Opportunities
• Mexican beer is distinctive for its lager-like properties, being generally light-
bodied with a mild taste and is meant to be drunk cold. Most beer is sold in
325ml bottles and certain brands often sold in cans
• Consumption will benefit from a healthy labor market, credit growth
and the moderation of food and energy prices
• Vast market (112 million inhabitants)
• World players in cement, beer, telephony
Challenges
• Most Mexican microbrews are exported to the U.S., as it is difficult for small
breweries to compete in the Mexican market
• Competition will be tough. Mexico displaced Holland in 2003 as the
worldwide leader in beer sales. Grupo Modelo and FEMSA send more than
80% of their exports to the U.S. Mexican beer's growth is coming largely at
the expense of U.S. brands.
• High crime level linked to drug trafficking
• Strong domestic demand has led to high import flows, but the peso’s
exchange rate, which floats fairly freely though on a long-term slight
devaluation trend against the dollar, is favorable to exports
Spain Opportunities and Challenges
Opportunities
• Spain’s trade policy is the same as that of other members of the European Union, with
the common EU weighted average tariff rate standing at 1.6 percent
• Spain has improved the procedural requirements for exporting and importing
goods
• More and more Spaniards are beginning to drink beer instead. Most attribute it
to the country experiencing a large number of microbreweries
opening, particularly in areas like Catalonia. These microbreweries are helping the
industry to grow and transform
Challenges
• Very high unemployment, especially among the young
• Consumption is expected to be badly affected by the fall in household disposable
income
• Momentum for deeper economic and structural reforms appears to largely
stalled.
• Businesses are confronted not only with a fall in domestic sales but also with a shortage
of finance, higher taxes and the ending of subsidies
United Kingdom Opportunities and Challenges
Opportunities
• The financial situation of businesses has improved
• English beer styles include bitter, mild, brown ale and old ale. Stout was also
originally brewed in London. Other developments include consolidation growth of
beer consumerism; expansion of microbreweries and increased interest in bottle
conditioned beers
• Imported beers are increasingly popular, especially brewers from Eastern Europe
• With few trade barriers, the United Kingdom is the entry market into the EU for
over 41,000 U.S. exporters
Challenges
• Household consumption should remain weak especially as the level of debt remains
high
•Imports will grow only slightly due to household and business caution
• Weak consumer confidence and broadly static wages continue to dampen retail sales
• As UK and third-country suppliers represent strong competition, U.S. exporters need to
offer differentiated products at competitive prices
Turkey Opportunities and Challenges
Opportunities
• Beer is a very popular alcoholic beverage in Turkey. Commonly lager type beers are
popular
• The Turkish beer market experienced 20% growth from 2001 to 2005 with many
international brands gaining popularity.
• The food and beverages industry will perform well in 2013 and beyond
• In 2008 Turkey eased trade by introducing an Electronic Data Interchange, improving
IT infrastructure and training of some 2500 customs officers and 14,000 traders
Challenges
• The lira continues to depreciate against the dollar and euro, it even reached a historical low
point in August 2013, making imports more expensive
• The government intends to boost its revenues by increasing taxes paid by
motorists, and by raising alcohol and tobacco prices
• The country is now in open crisis with Syria while tensions with the Kurd minority
remain high
• U.S. exporters face many challenges, such as contradictory policies, regulations and
documentation requirements, lack of transparency etc.

More Related Content

What's hot

Professor the Honourable Stephen Martin - IFAC Sovereign Debt Seminar Present...
Professor the Honourable Stephen Martin - IFAC Sovereign Debt Seminar Present...Professor the Honourable Stephen Martin - IFAC Sovereign Debt Seminar Present...
Professor the Honourable Stephen Martin - IFAC Sovereign Debt Seminar Present...International Federation of Accountants
 
QNBFS Daily Market Report June 28, 2020
QNBFS Daily Market Report June 28, 2020QNBFS Daily Market Report June 28, 2020
QNBFS Daily Market Report June 28, 2020QNB Group
 
Financial Analysis - Barrick Gold Corporation is an international gold compan...
Financial Analysis - Barrick Gold Corporation is an international gold compan...Financial Analysis - Barrick Gold Corporation is an international gold compan...
Financial Analysis - Barrick Gold Corporation is an international gold compan...BCV
 
Q1 ’04 Venture Capital Fundraising
 	Q1 ’04 Venture Capital Fundraising 	Q1 ’04 Venture Capital Fundraising
Q1 ’04 Venture Capital Fundraisingmensa25
 
Internal cashflow and investment decisions: Case of Pakistani sugar sector.
Internal cashflow and investment decisions: Case of Pakistani sugar sector.Internal cashflow and investment decisions: Case of Pakistani sugar sector.
Internal cashflow and investment decisions: Case of Pakistani sugar sector.Mitsui & Co., Ltd.
 
Q2 ’04 IPO Activity
 	Q2 ’04 IPO Activity 	Q2 ’04 IPO Activity
Q2 ’04 IPO Activitymensa25
 
BoyarMiller Breakfast Forum: The Current State of the Capital Markets 2011
BoyarMiller Breakfast Forum: The Current State of the Capital Markets 2011BoyarMiller Breakfast Forum: The Current State of the Capital Markets 2011
BoyarMiller Breakfast Forum: The Current State of the Capital Markets 2011BoyarMiller
 
LinkedIn Q2 2015 Earnings Call
LinkedIn Q2 2015 Earnings CallLinkedIn Q2 2015 Earnings Call
LinkedIn Q2 2015 Earnings CallLinkedIn
 
Etude PwC "Mine 2014"
Etude PwC "Mine 2014"Etude PwC "Mine 2014"
Etude PwC "Mine 2014"PwC France
 

What's hot (10)

Professor the Honourable Stephen Martin - IFAC Sovereign Debt Seminar Present...
Professor the Honourable Stephen Martin - IFAC Sovereign Debt Seminar Present...Professor the Honourable Stephen Martin - IFAC Sovereign Debt Seminar Present...
Professor the Honourable Stephen Martin - IFAC Sovereign Debt Seminar Present...
 
QNBFS Daily Market Report June 28, 2020
QNBFS Daily Market Report June 28, 2020QNBFS Daily Market Report June 28, 2020
QNBFS Daily Market Report June 28, 2020
 
Financial Analysis - Barrick Gold Corporation is an international gold compan...
Financial Analysis - Barrick Gold Corporation is an international gold compan...Financial Analysis - Barrick Gold Corporation is an international gold compan...
Financial Analysis - Barrick Gold Corporation is an international gold compan...
 
Q1 ’04 Venture Capital Fundraising
 	Q1 ’04 Venture Capital Fundraising 	Q1 ’04 Venture Capital Fundraising
Q1 ’04 Venture Capital Fundraising
 
Internal cashflow and investment decisions: Case of Pakistani sugar sector.
Internal cashflow and investment decisions: Case of Pakistani sugar sector.Internal cashflow and investment decisions: Case of Pakistani sugar sector.
Internal cashflow and investment decisions: Case of Pakistani sugar sector.
 
Q2 ’04 IPO Activity
 	Q2 ’04 IPO Activity 	Q2 ’04 IPO Activity
Q2 ’04 IPO Activity
 
2003_halfyear
2003_halfyear2003_halfyear
2003_halfyear
 
BoyarMiller Breakfast Forum: The Current State of the Capital Markets 2011
BoyarMiller Breakfast Forum: The Current State of the Capital Markets 2011BoyarMiller Breakfast Forum: The Current State of the Capital Markets 2011
BoyarMiller Breakfast Forum: The Current State of the Capital Markets 2011
 
LinkedIn Q2 2015 Earnings Call
LinkedIn Q2 2015 Earnings CallLinkedIn Q2 2015 Earnings Call
LinkedIn Q2 2015 Earnings Call
 
Etude PwC "Mine 2014"
Etude PwC "Mine 2014"Etude PwC "Mine 2014"
Etude PwC "Mine 2014"
 

Similar to Whyexportyourbeer.ppt [autosaved]

Ch 1 2 ppt introduction to international marketing
Ch 1 2 ppt introduction to international marketingCh 1 2 ppt introduction to international marketing
Ch 1 2 ppt introduction to international marketingAlain DELZONGLE
 
JFK University Presentation
JFK University PresentationJFK University Presentation
JFK University PresentationBarry Mendelson
 
Value based management of Union pacific corp and UPS
Value based management of Union pacific corp and UPSValue based management of Union pacific corp and UPS
Value based management of Union pacific corp and UPSSayedSadullahSadat
 
1 q12 investor presentation
1 q12 investor presentation1 q12 investor presentation
1 q12 investor presentationBancoABCRI
 
Why Strategies Fail, Advanced Competitive Strategies
Why Strategies Fail, Advanced Competitive Strategies Why Strategies Fail, Advanced Competitive Strategies
Why Strategies Fail, Advanced Competitive Strategies Innovation Enterprise
 
Champagne market in Korea, short consumer Survey
Champagne market in Korea, short consumer SurveyChampagne market in Korea, short consumer Survey
Champagne market in Korea, short consumer Survey휘웅 정
 
Financial Forecasting
Financial ForecastingFinancial Forecasting
Financial ForecastingAlayshaOrtiz1
 
Germany last 10 year economy report
Germany last 10 year economy reportGermany last 10 year economy report
Germany last 10 year economy reportAbhishek Kumar
 
Germany last 10 year economy report
Germany last 10 year economy reportGermany last 10 year economy report
Germany last 10 year economy reportAbhishek Kumar
 
2000 jetro white paper on international trade and foreign direct investment b...
2000 jetro white paper on international trade and foreign direct investment b...2000 jetro white paper on international trade and foreign direct investment b...
2000 jetro white paper on international trade and foreign direct investment b...Pim Piepers
 
Etude PwC sur le Top 100 des entreprises les mieux valorisées au monde en 201...
Etude PwC sur le Top 100 des entreprises les mieux valorisées au monde en 201...Etude PwC sur le Top 100 des entreprises les mieux valorisées au monde en 201...
Etude PwC sur le Top 100 des entreprises les mieux valorisées au monde en 201...PwC France
 
Global top-100-march-2015
Global top-100-march-2015Global top-100-march-2015
Global top-100-march-2015PwC España
 
2 q 20_forbes market update_final
2 q 20_forbes market update_final2 q 20_forbes market update_final
2 q 20_forbes market update_finalSara Cody
 
DataIllinois Tool WorksConsolidated Statement of Income($ in milli.docx
DataIllinois Tool WorksConsolidated Statement of Income($ in milli.docxDataIllinois Tool WorksConsolidated Statement of Income($ in milli.docx
DataIllinois Tool WorksConsolidated Statement of Income($ in milli.docxwhittemorelucilla
 
BoyarMiller Breakfast Forum: The Current State of the Capital Markets 2010
BoyarMiller Breakfast Forum: The Current State of the Capital Markets 2010BoyarMiller Breakfast Forum: The Current State of the Capital Markets 2010
BoyarMiller Breakfast Forum: The Current State of the Capital Markets 2010BoyarMiller
 
Perspectives on VC - Stanford/Warburg Pincus 2010
Perspectives on VC - Stanford/Warburg Pincus 2010Perspectives on VC - Stanford/Warburg Pincus 2010
Perspectives on VC - Stanford/Warburg Pincus 2010adrianionel
 
3 q 20_forbes market update_v3
3 q 20_forbes market update_v33 q 20_forbes market update_v3
3 q 20_forbes market update_v3Bob Forbes
 
Investing Concept Of Risk And Return PowerPoint Presentation Slides
Investing Concept Of Risk And Return PowerPoint Presentation Slides Investing Concept Of Risk And Return PowerPoint Presentation Slides
Investing Concept Of Risk And Return PowerPoint Presentation Slides SlideTeam
 
Cia Hering 3Q14 earnings presentation
Cia Hering 3Q14 earnings presentationCia Hering 3Q14 earnings presentation
Cia Hering 3Q14 earnings presentationCia Hering RI
 

Similar to Whyexportyourbeer.ppt [autosaved] (20)

International marketing 1
International marketing 1International marketing 1
International marketing 1
 
Ch 1 2 ppt introduction to international marketing
Ch 1 2 ppt introduction to international marketingCh 1 2 ppt introduction to international marketing
Ch 1 2 ppt introduction to international marketing
 
JFK University Presentation
JFK University PresentationJFK University Presentation
JFK University Presentation
 
Value based management of Union pacific corp and UPS
Value based management of Union pacific corp and UPSValue based management of Union pacific corp and UPS
Value based management of Union pacific corp and UPS
 
1 q12 investor presentation
1 q12 investor presentation1 q12 investor presentation
1 q12 investor presentation
 
Why Strategies Fail, Advanced Competitive Strategies
Why Strategies Fail, Advanced Competitive Strategies Why Strategies Fail, Advanced Competitive Strategies
Why Strategies Fail, Advanced Competitive Strategies
 
Champagne market in Korea, short consumer Survey
Champagne market in Korea, short consumer SurveyChampagne market in Korea, short consumer Survey
Champagne market in Korea, short consumer Survey
 
Financial Forecasting
Financial ForecastingFinancial Forecasting
Financial Forecasting
 
Germany last 10 year economy report
Germany last 10 year economy reportGermany last 10 year economy report
Germany last 10 year economy report
 
Germany last 10 year economy report
Germany last 10 year economy reportGermany last 10 year economy report
Germany last 10 year economy report
 
2000 jetro white paper on international trade and foreign direct investment b...
2000 jetro white paper on international trade and foreign direct investment b...2000 jetro white paper on international trade and foreign direct investment b...
2000 jetro white paper on international trade and foreign direct investment b...
 
Etude PwC sur le Top 100 des entreprises les mieux valorisées au monde en 201...
Etude PwC sur le Top 100 des entreprises les mieux valorisées au monde en 201...Etude PwC sur le Top 100 des entreprises les mieux valorisées au monde en 201...
Etude PwC sur le Top 100 des entreprises les mieux valorisées au monde en 201...
 
Global top-100-march-2015
Global top-100-march-2015Global top-100-march-2015
Global top-100-march-2015
 
2 q 20_forbes market update_final
2 q 20_forbes market update_final2 q 20_forbes market update_final
2 q 20_forbes market update_final
 
DataIllinois Tool WorksConsolidated Statement of Income($ in milli.docx
DataIllinois Tool WorksConsolidated Statement of Income($ in milli.docxDataIllinois Tool WorksConsolidated Statement of Income($ in milli.docx
DataIllinois Tool WorksConsolidated Statement of Income($ in milli.docx
 
BoyarMiller Breakfast Forum: The Current State of the Capital Markets 2010
BoyarMiller Breakfast Forum: The Current State of the Capital Markets 2010BoyarMiller Breakfast Forum: The Current State of the Capital Markets 2010
BoyarMiller Breakfast Forum: The Current State of the Capital Markets 2010
 
Perspectives on VC - Stanford/Warburg Pincus 2010
Perspectives on VC - Stanford/Warburg Pincus 2010Perspectives on VC - Stanford/Warburg Pincus 2010
Perspectives on VC - Stanford/Warburg Pincus 2010
 
3 q 20_forbes market update_v3
3 q 20_forbes market update_v33 q 20_forbes market update_v3
3 q 20_forbes market update_v3
 
Investing Concept Of Risk And Return PowerPoint Presentation Slides
Investing Concept Of Risk And Return PowerPoint Presentation Slides Investing Concept Of Risk And Return PowerPoint Presentation Slides
Investing Concept Of Risk And Return PowerPoint Presentation Slides
 
Cia Hering 3Q14 earnings presentation
Cia Hering 3Q14 earnings presentationCia Hering 3Q14 earnings presentation
Cia Hering 3Q14 earnings presentation
 

Recently uploaded

Independent Call Girls Andheri Nightlaila 9967584737
Independent Call Girls Andheri Nightlaila 9967584737Independent Call Girls Andheri Nightlaila 9967584737
Independent Call Girls Andheri Nightlaila 9967584737Riya Pathan
 
Call Girls In Sikandarpur Gurgaon ❤️8860477959_Russian 100% Genuine Escorts I...
Call Girls In Sikandarpur Gurgaon ❤️8860477959_Russian 100% Genuine Escorts I...Call Girls In Sikandarpur Gurgaon ❤️8860477959_Russian 100% Genuine Escorts I...
Call Girls In Sikandarpur Gurgaon ❤️8860477959_Russian 100% Genuine Escorts I...lizamodels9
 
Call Us 📲8800102216📞 Call Girls In DLF City Gurgaon
Call Us 📲8800102216📞 Call Girls In DLF City GurgaonCall Us 📲8800102216📞 Call Girls In DLF City Gurgaon
Call Us 📲8800102216📞 Call Girls In DLF City Gurgaoncallgirls2057
 
Call Girls Miyapur 7001305949 all area service COD available Any Time
Call Girls Miyapur 7001305949 all area service COD available Any TimeCall Girls Miyapur 7001305949 all area service COD available Any Time
Call Girls Miyapur 7001305949 all area service COD available Any Timedelhimodelshub1
 
/:Call Girls In Indirapuram Ghaziabad ➥9990211544 Independent Best Escorts In...
/:Call Girls In Indirapuram Ghaziabad ➥9990211544 Independent Best Escorts In.../:Call Girls In Indirapuram Ghaziabad ➥9990211544 Independent Best Escorts In...
/:Call Girls In Indirapuram Ghaziabad ➥9990211544 Independent Best Escorts In...lizamodels9
 
Case study on tata clothing brand zudio in detail
Case study on tata clothing brand zudio in detailCase study on tata clothing brand zudio in detail
Case study on tata clothing brand zudio in detailAriel592675
 
Youth Involvement in an Innovative Coconut Value Chain by Mwalimu Menza
Youth Involvement in an Innovative Coconut Value Chain by Mwalimu MenzaYouth Involvement in an Innovative Coconut Value Chain by Mwalimu Menza
Youth Involvement in an Innovative Coconut Value Chain by Mwalimu Menzaictsugar
 
Investment in The Coconut Industry by Nancy Cheruiyot
Investment in The Coconut Industry by Nancy CheruiyotInvestment in The Coconut Industry by Nancy Cheruiyot
Investment in The Coconut Industry by Nancy Cheruiyotictsugar
 
Ten Organizational Design Models to align structure and operations to busines...
Ten Organizational Design Models to align structure and operations to busines...Ten Organizational Design Models to align structure and operations to busines...
Ten Organizational Design Models to align structure and operations to busines...Seta Wicaksana
 
8447779800, Low rate Call girls in Shivaji Enclave Delhi NCR
8447779800, Low rate Call girls in Shivaji Enclave Delhi NCR8447779800, Low rate Call girls in Shivaji Enclave Delhi NCR
8447779800, Low rate Call girls in Shivaji Enclave Delhi NCRashishs7044
 
BEST Call Girls In Old Faridabad ✨ 9773824855 ✨ Escorts Service In Delhi Ncr,
BEST Call Girls In Old Faridabad ✨ 9773824855 ✨ Escorts Service In Delhi Ncr,BEST Call Girls In Old Faridabad ✨ 9773824855 ✨ Escorts Service In Delhi Ncr,
BEST Call Girls In Old Faridabad ✨ 9773824855 ✨ Escorts Service In Delhi Ncr,noida100girls
 
Digital Transformation in the PLM domain - distrib.pdf
Digital Transformation in the PLM domain - distrib.pdfDigital Transformation in the PLM domain - distrib.pdf
Digital Transformation in the PLM domain - distrib.pdfJos Voskuil
 
Global Scenario On Sustainable and Resilient Coconut Industry by Dr. Jelfina...
Global Scenario On Sustainable  and Resilient Coconut Industry by Dr. Jelfina...Global Scenario On Sustainable  and Resilient Coconut Industry by Dr. Jelfina...
Global Scenario On Sustainable and Resilient Coconut Industry by Dr. Jelfina...ictsugar
 
(Best) ENJOY Call Girls in Faridabad Ex | 8377087607
(Best) ENJOY Call Girls in Faridabad Ex | 8377087607(Best) ENJOY Call Girls in Faridabad Ex | 8377087607
(Best) ENJOY Call Girls in Faridabad Ex | 8377087607dollysharma2066
 
Islamabad Escorts | Call 03070433345 | Escort Service in Islamabad
Islamabad Escorts | Call 03070433345 | Escort Service in IslamabadIslamabad Escorts | Call 03070433345 | Escort Service in Islamabad
Islamabad Escorts | Call 03070433345 | Escort Service in IslamabadAyesha Khan
 
The CMO Survey - Highlights and Insights Report - Spring 2024
The CMO Survey - Highlights and Insights Report - Spring 2024The CMO Survey - Highlights and Insights Report - Spring 2024
The CMO Survey - Highlights and Insights Report - Spring 2024christinemoorman
 
8447779800, Low rate Call girls in Tughlakabad Delhi NCR
8447779800, Low rate Call girls in Tughlakabad Delhi NCR8447779800, Low rate Call girls in Tughlakabad Delhi NCR
8447779800, Low rate Call girls in Tughlakabad Delhi NCRashishs7044
 
8447779800, Low rate Call girls in Uttam Nagar Delhi NCR
8447779800, Low rate Call girls in Uttam Nagar Delhi NCR8447779800, Low rate Call girls in Uttam Nagar Delhi NCR
8447779800, Low rate Call girls in Uttam Nagar Delhi NCRashishs7044
 
Keppel Ltd. 1Q 2024 Business Update Presentation Slides
Keppel Ltd. 1Q 2024 Business Update  Presentation SlidesKeppel Ltd. 1Q 2024 Business Update  Presentation Slides
Keppel Ltd. 1Q 2024 Business Update Presentation SlidesKeppelCorporation
 

Recently uploaded (20)

Independent Call Girls Andheri Nightlaila 9967584737
Independent Call Girls Andheri Nightlaila 9967584737Independent Call Girls Andheri Nightlaila 9967584737
Independent Call Girls Andheri Nightlaila 9967584737
 
Call Girls In Sikandarpur Gurgaon ❤️8860477959_Russian 100% Genuine Escorts I...
Call Girls In Sikandarpur Gurgaon ❤️8860477959_Russian 100% Genuine Escorts I...Call Girls In Sikandarpur Gurgaon ❤️8860477959_Russian 100% Genuine Escorts I...
Call Girls In Sikandarpur Gurgaon ❤️8860477959_Russian 100% Genuine Escorts I...
 
Japan IT Week 2024 Brochure by 47Billion (English)
Japan IT Week 2024 Brochure by 47Billion (English)Japan IT Week 2024 Brochure by 47Billion (English)
Japan IT Week 2024 Brochure by 47Billion (English)
 
Call Us 📲8800102216📞 Call Girls In DLF City Gurgaon
Call Us 📲8800102216📞 Call Girls In DLF City GurgaonCall Us 📲8800102216📞 Call Girls In DLF City Gurgaon
Call Us 📲8800102216📞 Call Girls In DLF City Gurgaon
 
Call Girls Miyapur 7001305949 all area service COD available Any Time
Call Girls Miyapur 7001305949 all area service COD available Any TimeCall Girls Miyapur 7001305949 all area service COD available Any Time
Call Girls Miyapur 7001305949 all area service COD available Any Time
 
/:Call Girls In Indirapuram Ghaziabad ➥9990211544 Independent Best Escorts In...
/:Call Girls In Indirapuram Ghaziabad ➥9990211544 Independent Best Escorts In.../:Call Girls In Indirapuram Ghaziabad ➥9990211544 Independent Best Escorts In...
/:Call Girls In Indirapuram Ghaziabad ➥9990211544 Independent Best Escorts In...
 
Case study on tata clothing brand zudio in detail
Case study on tata clothing brand zudio in detailCase study on tata clothing brand zudio in detail
Case study on tata clothing brand zudio in detail
 
Youth Involvement in an Innovative Coconut Value Chain by Mwalimu Menza
Youth Involvement in an Innovative Coconut Value Chain by Mwalimu MenzaYouth Involvement in an Innovative Coconut Value Chain by Mwalimu Menza
Youth Involvement in an Innovative Coconut Value Chain by Mwalimu Menza
 
Investment in The Coconut Industry by Nancy Cheruiyot
Investment in The Coconut Industry by Nancy CheruiyotInvestment in The Coconut Industry by Nancy Cheruiyot
Investment in The Coconut Industry by Nancy Cheruiyot
 
Ten Organizational Design Models to align structure and operations to busines...
Ten Organizational Design Models to align structure and operations to busines...Ten Organizational Design Models to align structure and operations to busines...
Ten Organizational Design Models to align structure and operations to busines...
 
8447779800, Low rate Call girls in Shivaji Enclave Delhi NCR
8447779800, Low rate Call girls in Shivaji Enclave Delhi NCR8447779800, Low rate Call girls in Shivaji Enclave Delhi NCR
8447779800, Low rate Call girls in Shivaji Enclave Delhi NCR
 
BEST Call Girls In Old Faridabad ✨ 9773824855 ✨ Escorts Service In Delhi Ncr,
BEST Call Girls In Old Faridabad ✨ 9773824855 ✨ Escorts Service In Delhi Ncr,BEST Call Girls In Old Faridabad ✨ 9773824855 ✨ Escorts Service In Delhi Ncr,
BEST Call Girls In Old Faridabad ✨ 9773824855 ✨ Escorts Service In Delhi Ncr,
 
Digital Transformation in the PLM domain - distrib.pdf
Digital Transformation in the PLM domain - distrib.pdfDigital Transformation in the PLM domain - distrib.pdf
Digital Transformation in the PLM domain - distrib.pdf
 
Global Scenario On Sustainable and Resilient Coconut Industry by Dr. Jelfina...
Global Scenario On Sustainable  and Resilient Coconut Industry by Dr. Jelfina...Global Scenario On Sustainable  and Resilient Coconut Industry by Dr. Jelfina...
Global Scenario On Sustainable and Resilient Coconut Industry by Dr. Jelfina...
 
(Best) ENJOY Call Girls in Faridabad Ex | 8377087607
(Best) ENJOY Call Girls in Faridabad Ex | 8377087607(Best) ENJOY Call Girls in Faridabad Ex | 8377087607
(Best) ENJOY Call Girls in Faridabad Ex | 8377087607
 
Islamabad Escorts | Call 03070433345 | Escort Service in Islamabad
Islamabad Escorts | Call 03070433345 | Escort Service in IslamabadIslamabad Escorts | Call 03070433345 | Escort Service in Islamabad
Islamabad Escorts | Call 03070433345 | Escort Service in Islamabad
 
The CMO Survey - Highlights and Insights Report - Spring 2024
The CMO Survey - Highlights and Insights Report - Spring 2024The CMO Survey - Highlights and Insights Report - Spring 2024
The CMO Survey - Highlights and Insights Report - Spring 2024
 
8447779800, Low rate Call girls in Tughlakabad Delhi NCR
8447779800, Low rate Call girls in Tughlakabad Delhi NCR8447779800, Low rate Call girls in Tughlakabad Delhi NCR
8447779800, Low rate Call girls in Tughlakabad Delhi NCR
 
8447779800, Low rate Call girls in Uttam Nagar Delhi NCR
8447779800, Low rate Call girls in Uttam Nagar Delhi NCR8447779800, Low rate Call girls in Uttam Nagar Delhi NCR
8447779800, Low rate Call girls in Uttam Nagar Delhi NCR
 
Keppel Ltd. 1Q 2024 Business Update Presentation Slides
Keppel Ltd. 1Q 2024 Business Update  Presentation SlidesKeppel Ltd. 1Q 2024 Business Update  Presentation Slides
Keppel Ltd. 1Q 2024 Business Update Presentation Slides
 

Whyexportyourbeer.ppt [autosaved]

  • 1. A Preliminary Analysis of International Expansion Opportunities
  • 2. Top 10 Markets Cross Border Consultants Identified for Beer Exports US Beer Exports 2012 ($) US Export Growth from 2008 - 2012 (%) Total Beer Imports 2012 ($) US Market Share GDP (trillion) GDP Per Capita ($) Population Beer Consumption Per Capita 2010 (liters) Australia 15,299,920.00 39 254,540,000.00 6% 1.542 43,300.00 22,262,501 81 Canada 144,508,026.00 40 594,121,000.00 24% 1.819 43,400.00 34,568,211 68 China 2,923,635.00 1,479 144,173,000.00 2% 8.227 9,300.00 1,349,585,838 32 Colombia 4,188,835.00 333 16,594,000.00 25% 0.366 11,000.00 45,745,783 37 France 153,035.00 3,533 703,990,000.00 0.02% 2.609 36,100.00 65,951,611 35.5 Germany 1,089,908.00 358 553,992,000.00 0.10% 3.401 39,700.00 81,147,265 107 Mexico 102,010,139.00 19 129,947,000.00 78% 1.177 15,600.00 116,220,947 57 Spain 455,415.00 704 255,874,000.00 0.10% 1.352 15,600.00 47,370,542 70 UK 6,372,011.00 -15 676,348,000.00 0.90% 2.441 37,500.00 63,395,574 74 Turkey 3,992,224.00 29,472 3,651,000.00 109% 0.794 15,200.00 80,694,485 13
  • 6. Sales Volume in American Dollars ($) from 2008 - 2012 Top 20 Importers of American Brewed Beer Country 2008 2009 2010 2011 2012 Canada $103,575,431.00 $177,515,501.00 $188,386,611.00 $132,514,399.00 $144,432,007.00 Mexico $85,973,894.00 $84,809,727.00 $84,566,930.00 $95,585,638.00 $101,973,639.00 Paraguay $7,744,703.00 $6,215,744.00 $15,629,851.00 $26,788,415.00 $38,619,858.00 Chile $2,489,218.00 $3,489,566.00 $8,966,939.00 $14,381,455.00 $31,800,116.00 Panama $6,966,764.00 $9,228,348.00 $11,412,217.00 $11,937,601.00 $16,134,426.00 Australia $10,962,986.00 $14,602,100.00 $5,899,784.00 $6,603,786.00 $15,299,920.00 Sweden $2,704,562.00 $3,037,015.00 $3,619,651.00 $5,525,515.00 $8,359,367.00 Taiwan $10,876,939.00 $9,584,705.00 $8,312,904.00 $8,217,569.00 $8,052,005.00 United Kingdom $7,478,150.00 $3,755,665.00 $5,087,142.00 $4,770,087.00 $6,405,923.00 Korea $9,128,615.00 $5,013,181.00 $5,304,875.00 $5,170,384.00 $5,714,585.00 Honduras $1,701,531.00 $2,942,796.00 $2,405,043.00 $3,380,291.00 $5,340,423.00 Colombia $967,763.00 $1,515,665.00 $2,050,875.00 $2,776,919.00 $4,188,835.00 Turkey $13,500.00 $15,120.00 $38,296.00 $275,528.00 $3,992,224.00 UEA $3,944,184.00 $3,272,454.00 $3,752,878.00 $4,025,083.00 $3,619,354.00 Japan $1,524,212.00 $1,795,359.00 $2,161,214.00 $2,868,938.00 $3,330,751.00 Guatemala N/A N/A N/A $728,553.00 $3,012,753.00 China $185,122.00 $168,136.00 $546,417.00 $4,033,338.00 $2,923,635.00 Bahamas $3,125,855.00 $3,086,930.00 $2,475,883.00 $2,666,051.00 $2,853,801.00 Singapore $1,473,983.00 $679,604.00 $759,015.00 $1,080,148.00 $2,633,976.00 Hong Kong $2,890,149.00 $2,357,984.00 $2,558,468.00 $2,646,272.00 $2,489,753.00
  • 7. Sales Volume ($) of US Brewed Beer in Top Growth Markets Top 20 Growth Markets from 2005 - 2012 Country 2005 2006 2007 2008 2009 2010 2011 2012 Turkey $0.00 $101,554.00 $59,223.00 $13,500.00 $15,120.00 $38,296.00 $275,528.00 $3,992,224.00 Brazil $12,759.00 $51,596.00 $46,282.00 $24,858.00 $84,604.00 $377,326.00 $3,172,353.00 $1,654,882.00 France $0.00 $0.00 $2,617.00 $4,212.00 $11,186.00 $61,478.00 $14,494.00 $153,035.00 Thailand $40,546.00 $36,325.00 $14,208.00 $6,521.00 $51,194.00 $106,293.00 $158,253.00 $211,890.00 China $91,168.00 $221,426.00 $430,666.00 $185,122.00 $168,136.00 $546,417.00 $4,033,338.00 $2,923,635.00 El Salvador $177,724.00 $231,076.00 $128,157.00 $53,193.00 $44,141.00 $4,756.00 $136,330.00 $762,076.00 Uruguay $0.00 $0.00 $2,606.00 $25,123.00 $92,193.00 $153,507.00 $292,827.00 $356,026.00 Chile $0.00 $0.00 $186,648.00 $2,489,218.00 $3,489,566.00 $8,966,939.00 $14,381,455.00 $31,800,116.00 Costa Rica $42,636.00 $64,694.00 $66,992.00 $197,346.00 $365,179.00 $659,789.00 $1,404,205.00 $1,952,158.00 Malta $0.00 $0.00 $37,542.00 $18,891.00 $75,176.00 $61,771.00 $69,816.00 $163,894.00 Spain $0.00 $107,530.00 $3,300.00 $56,634.00 $112,696.00 $41,559.00 $248,133.00 $455,415.00 Italy $56,813.00 $29,045.00 $112,642.00 $152,586.00 $281,670.00 $258,111.00 $423,236.00 $1,009,768.00 Philippines $0.00 $4,200.00 $26,091.00 $41,109.00 $129,978.00 $169,993.00 $312,126.00 $250,423.00 New Zealand $205,492.00 $61,467.00 $62,889.00 $216,821.00 $418,683.00 $676,902.00 $941,871.00 $1,255,793.00 Paraguay $246,211.00 $508,491.00 $2,127,738.00 $7,744,703.00 $6,215,744.00 $15,629,851.00 $26,787,115.00 $38,537,818.00 Israel $98,031.00 $72,364.00 $47,065.00 $40,304.00 $68,296.00 $1,029,216.00 $169,707.00 $194,200.00 Germany $422,860.00 $470,515.00 $1,114,378.00 $238,081.00 $362,194.00 $1,881,009.00 $990,065.00 $1,089,908.00 Colombia $261,214.00 $1,021,911.00 $1,531,235.00 $967,763.00 $1,515,665.00 $2,050,875.00 $2,776,919.00 $4,188,835.00 Anguilla $10,600.00 $10,080.00 $10,800.00 $23,936.00 $25,133.00 $32,632.00 $82,747.00 $88,741.00
  • 8. Target Market Demographics Population Population growth rate (%) Literacy (%) Unemployment (%) GDP (trillion) GDP growth rate (%) GDP per capita Inflation rate (%) Country Risk* Australia 22,262,501 1.11 99 5.2 1.542 3.6 $43,300.00 1.8 A2 Canada 34,568,211 0.77 99 7.3 1.819 1.8 $43,400.00 1.5 A1 China 1,349,585,838 0.46 95.1 6.5 8.227 7.8 $9,300.00 2.6 A3 Colombia 45,745,783 1.1 93.6 10.4 0.366 4 $11,000.00 3.2 A4 France 65,951,611 0.47 99 10.3 2.609 0 $36,100.00 2.2 A3 Germany 81,147,265 -0.19 99 5.5 3.401 0.7 $39,700.00 2.1 A2 Mexico 116,220,947 1.07 93.5 5 1.177 3.9 $15,600.00 4.1 A4 Spain 47,370,542 0.73 97.7 25.1 1.352 -1.4 $31,100.00 2.4 B UK 63,395,574 0.55 99 8 2.441 0.2 $37,500.00 2.8 A3 Turkey 80,694,485 1.16 94.1 9.2 0.794 2.6 $15,200.00 8.9 A4 * Based on a scale of A1, A2, A3, A4, B, C and D. Coface's estimate of the average credit risk on a country’s businesses. This is giving an indication of a country’s potential influence on businesses’ financial commitments. Of course, there may be some very solid businesses in high-risk countries, just as there may be some risky ones in reliable countries. The overall risk is thus a combination of business-specific factors and factors relating to the country in which the business operates.
  • 9. Target Market Business Climate Business climate Coface* Index of Economic Freedom** Economic Freedom of the World^ World Bank Doing Business~ Australia A1 3 10 10 Canada A1 6 8 17 China B 136 123 91 Colombia A4 37 96 45 France A1 62 40 34 Germany A1 19 19 20 Mexico A4 50 94 48 Spain A1 46 32 44 UK A1 14 12 7 Turkey A4 69 68 71
  • 10. *Evaluating the business environment involves measuring the quality of a country’s private sector governance – in other words businesses’ financial transparency and the effectiveness of the courts in settling debts. This assessment relies on Coface’s worldwide network and the expertise deriving from its experience in underwriting risks, investigating companies and managing receivables. Coface's business environment evaluations use a seven-level ranking. In ascending order of risk these are: A1, A2, A3, A4, B, C and D. **The Index of Economic Freedom, an annual guide published by The Wall Street Journal and The Heritage Foundation, measures liberty, prosperity and economic freedom by creating 10 benchmarks that gauge the economic success of 185 countries around the world. The rankings are on a scale of 1 - 185. ^The index published by the Fraser Institute's Economic Freedom of the World measures the degree to which the policies and institutions of countries are supportive of economic freedom. The cornerstones of economic freedom are personal choice, voluntary exchange, freedom to compete, and security of privately owned property. Forty-two data points are used to construct a summary index and to measure the degree of economic freedom in five broad areas: (1) size of government: expenditures, taxes, and enterprises; (2) legal structure and security of property rights; (3) access to sound money; (4) freedom to trade internationally; and (5) regulation of credit, labor and business. The rankings are on a scale of 1 - 152. ~The World Bank's annual Doing Business Project. Economies are ranked on their ease of doing business, from 1 – 185. A high ranking on the ease of doing business index means the regulatory environment is more conducive to the starting and operation of a local firm. This index averages the country's percentile rankings on 10 topics, made up of a variety of indicators, giving equal weight to each topic. The rankings for all economies are benchmarked to June 2012.
  • 11. Why Use Economic “Freedom” indexes? The relationship between economic freedom and prosperity is strong. Using the Index of Economic Freedom where economies are scaled on a range from 80 – 100 which are “most free,” 70 - 79.9 , which are “mostly free,” 60 – 69.9, which are “moderately free,” 50 – 59.9, which are “mostly unfree,” and 0 – 49.9, which are “repressed.” Looking at the bar chart we can determine countries that tilt toward market economics have healthy GDP per capita figures. For example, US consumer spending accounts for 70 percent of GDP and has a ranking of 76. We can assume similar markets’ consumers’ purchasing power are in a better position than their lower ranked, international peers to buy foreign goods. $0.00 $5,000.00 $10,000.00 $15,000.00 $20,000.00 $25,000.00 $30,000.00 $35,000.00 $40,000.00 Least Free Third Second Most Free GDPpercapitaPPP(US$2011) Economic Freedom Quartile
  • 12. Australia Opportunities and Challenges • Favorable tariff schedule under U.S.-Australia Free Trade Agreement (AUSFTA) • Australia was ranked fourth internationally in per capita beer consumption, at around 110 litres per year • The overwhelming proportion of beer produced is lager (approximately 95%), the most popular among Australian beer drinkers. Opportunities • Strong Australian dollar will translate into cheaper imported goods Challenges • Company bankruptcies accelerated in the first eight months of 2012 and payments could continue to be delayed • Household consumption will continue to drive growth in 2013, but the rise in spending will be less sustained • In World Bank’s Doing Business report Australia ranked 44 out of 185 in terms of trading across borders • Discretionary spending will remain tight with households preferring to build up their precautionary savings
  • 13. Canada Opportunities and Challenges Opportunities • The top selling style of beer in Canada, by far, is the pale lager • Regarding spending, Canadians in 2013 and 2014 will reduce their savings to compensate for modest increase in real wages. • Many factors will help sustain business spending: U.S. QE3, lower taxes, and competitive prices for imported products thanks to strong Canadian dollar • By volume, imported beer more than doubled its market share in past decade. In 2009, imported beer captured 13% of market, up from six per cent in 1999 Challenges • Per-capita beer sales have dropped 28 per cent from their peak of 115.2 litres in 1976 to 83.5 litres in 2009 • High household debt level • Canadian customs documentation, bilingual labeling, packaging requirements, and Canadian federal and provincial sales tax accounting can be surprisingly challenging • Increasing competition in a number of sectors translates into a need for competitive pricing, aggressive, flashy marketing, and deep discounts for agents and distributors
  • 14. China Opportunities and Challenges Opportunities • In 2010 China eased trade finance by relaxing its trade credit rules • Gradual move up-market • Household consumption continues to grow moderately • By 2020, China‘s middle class is expected to account for around 45 percent of the population, or approximately 700 million people. Challenges • Share of consumption in GDP remains weak: rebalancing China’s growth model remains a medium term challenge • Overcapacity in industry and trade • China often lacks predictability in its business environment. China‘s current legal and regulatory system can be opaque, inconsistent, often arbitrary, and corrupt • While the outright prohibition of foreign invested firms to import, export and distribute goods in China has improved, the licensing and approval process remains difficult, time consuming and highly opaque
  • 15. Colombia Opportunities and Challenges Opportunities • The growing popularity of beer among Colombia's middle classes is predicted to increase volume sales by about 14% between 2012 and 2017. The growing appreciation of international premium varieties means that sales are expected to grow at a slightly faster rate • Leading international brands are gradually finding markets in wealthy metropolitan areas, which will lead to an increase in consumption • Beer receives immediate duty-free treatment since May 2012 • A strong Colombian peso against the U.S. dollar is favoring U.S. exports Challenges • Many other trade agreements has increased competition for U.S. products • Internal transportation costs from ports of entry are costly due extremely poor infrastructure • Colombia’s bureaucracy still constitutes a barrier to trade for both local and foreign companies • U.S. suppliers should be aware that their ability to compete in Colombia could be hampered by unfair business practices such as contraband, counterfeiting, intellectual property rights violations, under- invoicing, money laundering, and dumping.
  • 16. France Opportunities and Challenges Opportunities • High savings level, low household debt • Most beer sold in France is mass-produced, with major breweries having control of over 90% of the market and pilsner lagers predominating • An increasing interest in American culture, younger consumers, and changing lifestyles contribute to France’s import demand for American food and beverage products • In 2009 France speeded up and simplified its customs clearance procedures by introducing an electronic customs declaration and eliminating certain documents Challenges • The rise in unemployment, low business profitability, loss of confidence, and the significant fiscal shock suggest that there will be a fall in domestic demand • Household consumption will continue to slow in response both to more job losses and lower purchasing power • Business profit margins are at their lowest levels since 1985 • Overall beer consumption was down 14% between 1991 and 2010
  • 17. German Opportunities and Challenges Opportunities • A 2010 report showed that Germany ranked second in terms of per-capita beer consumption, behind the Czech Republic and ahead of Austria (third) and Ireland (fourth) • Germany is the 5th largest U.S. trading partner globally and the top importer of U.S. goods in the EU (in 2011) • Price is not necessarily the determining factor for the German buyer, given the German market’s demand for quality • The strong growth of sales to non-European countries will only partially offset declining or weak growth in European countries. At the same time, imports could accelerate slightly in line with household demand. Challenges • While not directly discriminatory, government regulation by virtue of its complexity may offer a degree of protection to established local suppliers • GDP grew by 0.7% in 2012. Forecasts show annual growth of 0.4 percent in 2013 • Demographic decline • Some German entrepreneurs with selective experience with U.S. companies are skeptical about their long-term commitment and after-sales support
  • 18. Mexico Opportunities and Challenges Opportunities • Mexican beer is distinctive for its lager-like properties, being generally light- bodied with a mild taste and is meant to be drunk cold. Most beer is sold in 325ml bottles and certain brands often sold in cans • Consumption will benefit from a healthy labor market, credit growth and the moderation of food and energy prices • Vast market (112 million inhabitants) • World players in cement, beer, telephony Challenges • Most Mexican microbrews are exported to the U.S., as it is difficult for small breweries to compete in the Mexican market • Competition will be tough. Mexico displaced Holland in 2003 as the worldwide leader in beer sales. Grupo Modelo and FEMSA send more than 80% of their exports to the U.S. Mexican beer's growth is coming largely at the expense of U.S. brands. • High crime level linked to drug trafficking • Strong domestic demand has led to high import flows, but the peso’s exchange rate, which floats fairly freely though on a long-term slight devaluation trend against the dollar, is favorable to exports
  • 19. Spain Opportunities and Challenges Opportunities • Spain’s trade policy is the same as that of other members of the European Union, with the common EU weighted average tariff rate standing at 1.6 percent • Spain has improved the procedural requirements for exporting and importing goods • More and more Spaniards are beginning to drink beer instead. Most attribute it to the country experiencing a large number of microbreweries opening, particularly in areas like Catalonia. These microbreweries are helping the industry to grow and transform Challenges • Very high unemployment, especially among the young • Consumption is expected to be badly affected by the fall in household disposable income • Momentum for deeper economic and structural reforms appears to largely stalled. • Businesses are confronted not only with a fall in domestic sales but also with a shortage of finance, higher taxes and the ending of subsidies
  • 20. United Kingdom Opportunities and Challenges Opportunities • The financial situation of businesses has improved • English beer styles include bitter, mild, brown ale and old ale. Stout was also originally brewed in London. Other developments include consolidation growth of beer consumerism; expansion of microbreweries and increased interest in bottle conditioned beers • Imported beers are increasingly popular, especially brewers from Eastern Europe • With few trade barriers, the United Kingdom is the entry market into the EU for over 41,000 U.S. exporters Challenges • Household consumption should remain weak especially as the level of debt remains high •Imports will grow only slightly due to household and business caution • Weak consumer confidence and broadly static wages continue to dampen retail sales • As UK and third-country suppliers represent strong competition, U.S. exporters need to offer differentiated products at competitive prices
  • 21. Turkey Opportunities and Challenges Opportunities • Beer is a very popular alcoholic beverage in Turkey. Commonly lager type beers are popular • The Turkish beer market experienced 20% growth from 2001 to 2005 with many international brands gaining popularity. • The food and beverages industry will perform well in 2013 and beyond • In 2008 Turkey eased trade by introducing an Electronic Data Interchange, improving IT infrastructure and training of some 2500 customs officers and 14,000 traders Challenges • The lira continues to depreciate against the dollar and euro, it even reached a historical low point in August 2013, making imports more expensive • The government intends to boost its revenues by increasing taxes paid by motorists, and by raising alcohol and tobacco prices • The country is now in open crisis with Syria while tensions with the Kurd minority remain high • U.S. exporters face many challenges, such as contradictory policies, regulations and documentation requirements, lack of transparency etc.

Editor's Notes

  1. Source:Kirin Institute of Food and Lifestyle
  2. Source: Kirin Institute of Food and Lifestyle
  3. Source: UN COMTRADE statistics
  4. Source: U.S. Department of Commerce
  5. Sources: CIA World Factbook & Coface
  6. See slide 10 for sources
  7. Target Market Business Climate continued