

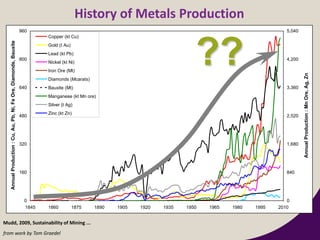

![Source: Grilli and Yang; Pfaffenzeller; World Bank; International Monetary Fund; Organisation for Economic Co-operation and Development statistics; UN Food
and Agriculture Organization; UN Comtrade; Ellen MacArthur Foundation circular economy team – image from their ‘Towards A Circular Economy ‘report
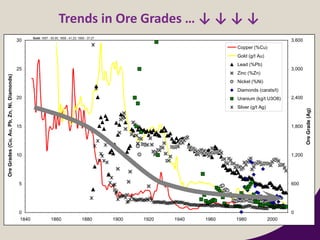
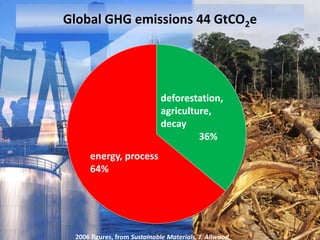
Extraction is predicted to account for 40% of
the world’s energy use by 2050 [Green Alliance (2011)
Reinventing the Wheel: A circular economy for resource security]](https://image.slidesharecdn.com/pitts-gcb-slides-feb-16-160211221312/85/Why-do-Circular-Economy-CEThinking-7-320.jpg)
![Industrial GHG emissions 10GtCO2
steel
25%
3%
other
44%
cement
19%
4%
plastics
4%
aluminium
paper
Demand for steel is set to rise by
80% between 2010 and 2030 [BBC]](https://image.slidesharecdn.com/pitts-gcb-slides-feb-16-160211221312/85/Why-do-Circular-Economy-CEThinking-11-320.jpg)
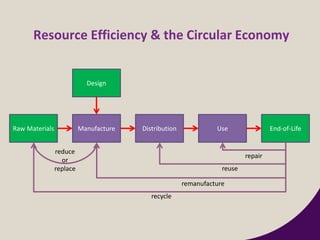
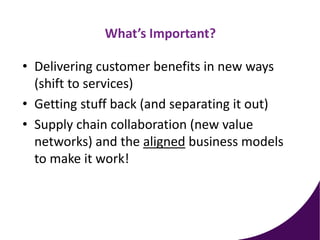


The document discusses the business case and benefits of adopting a circular economy in the built environment, highlighting significant resource efficiency opportunities. It mentions the predicted increase in materials demand and the impact of extraction on energy use and greenhouse gas emissions by 2050. The document also emphasizes the importance of customer benefits, supply chain collaboration, and innovative business models that support a circular economy.


