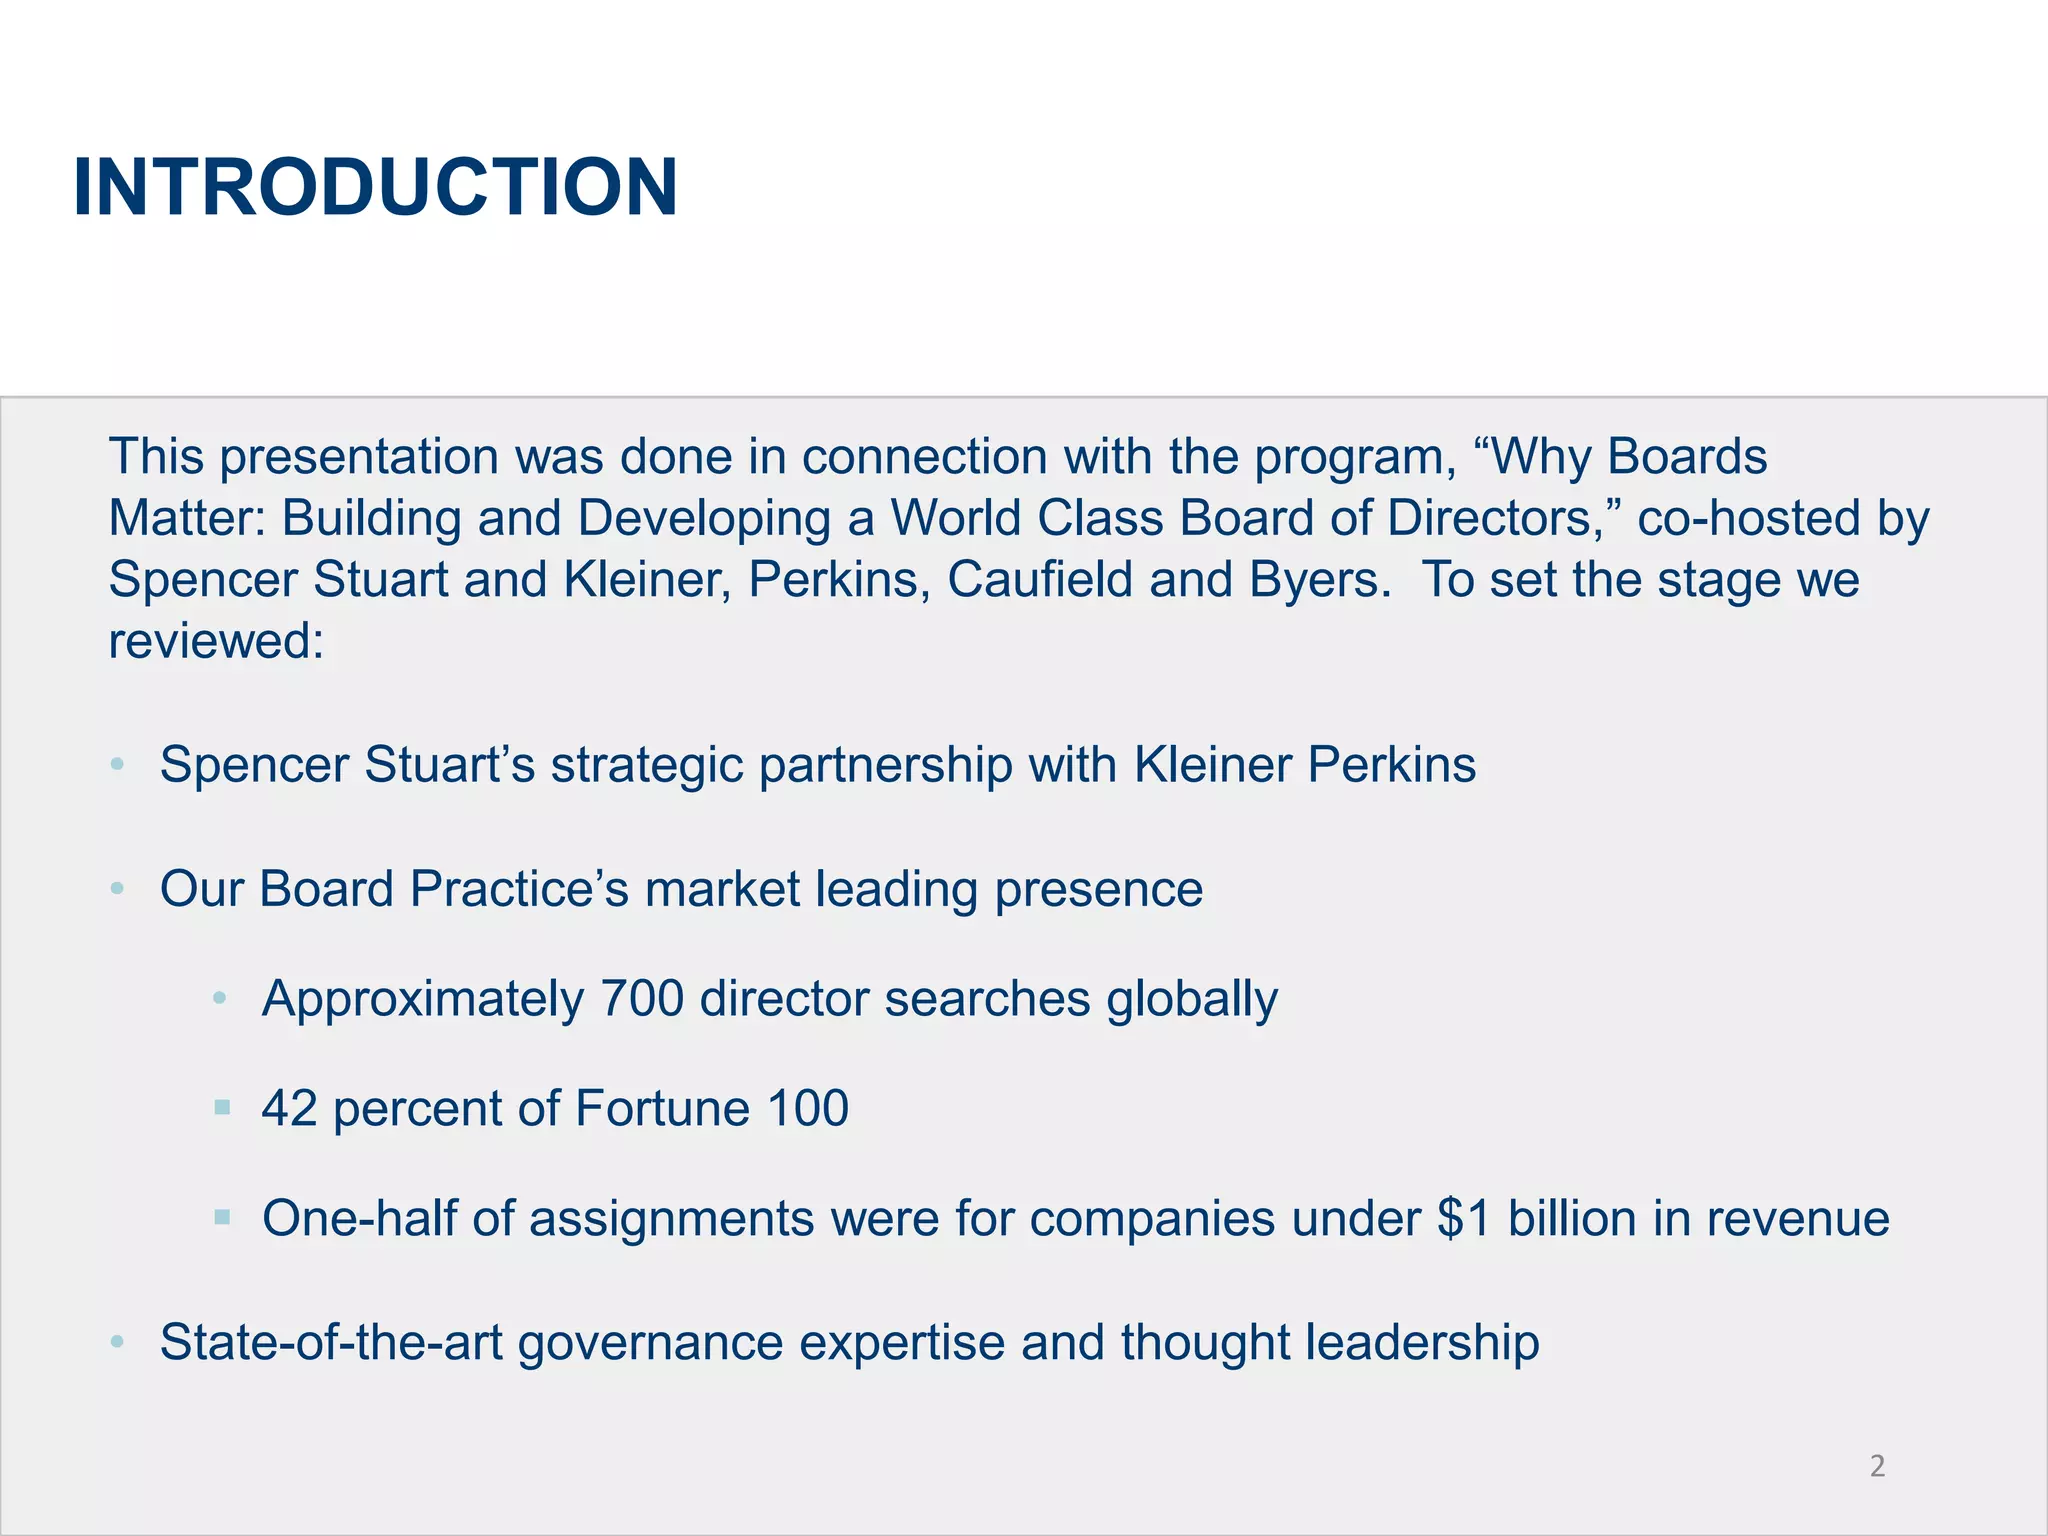
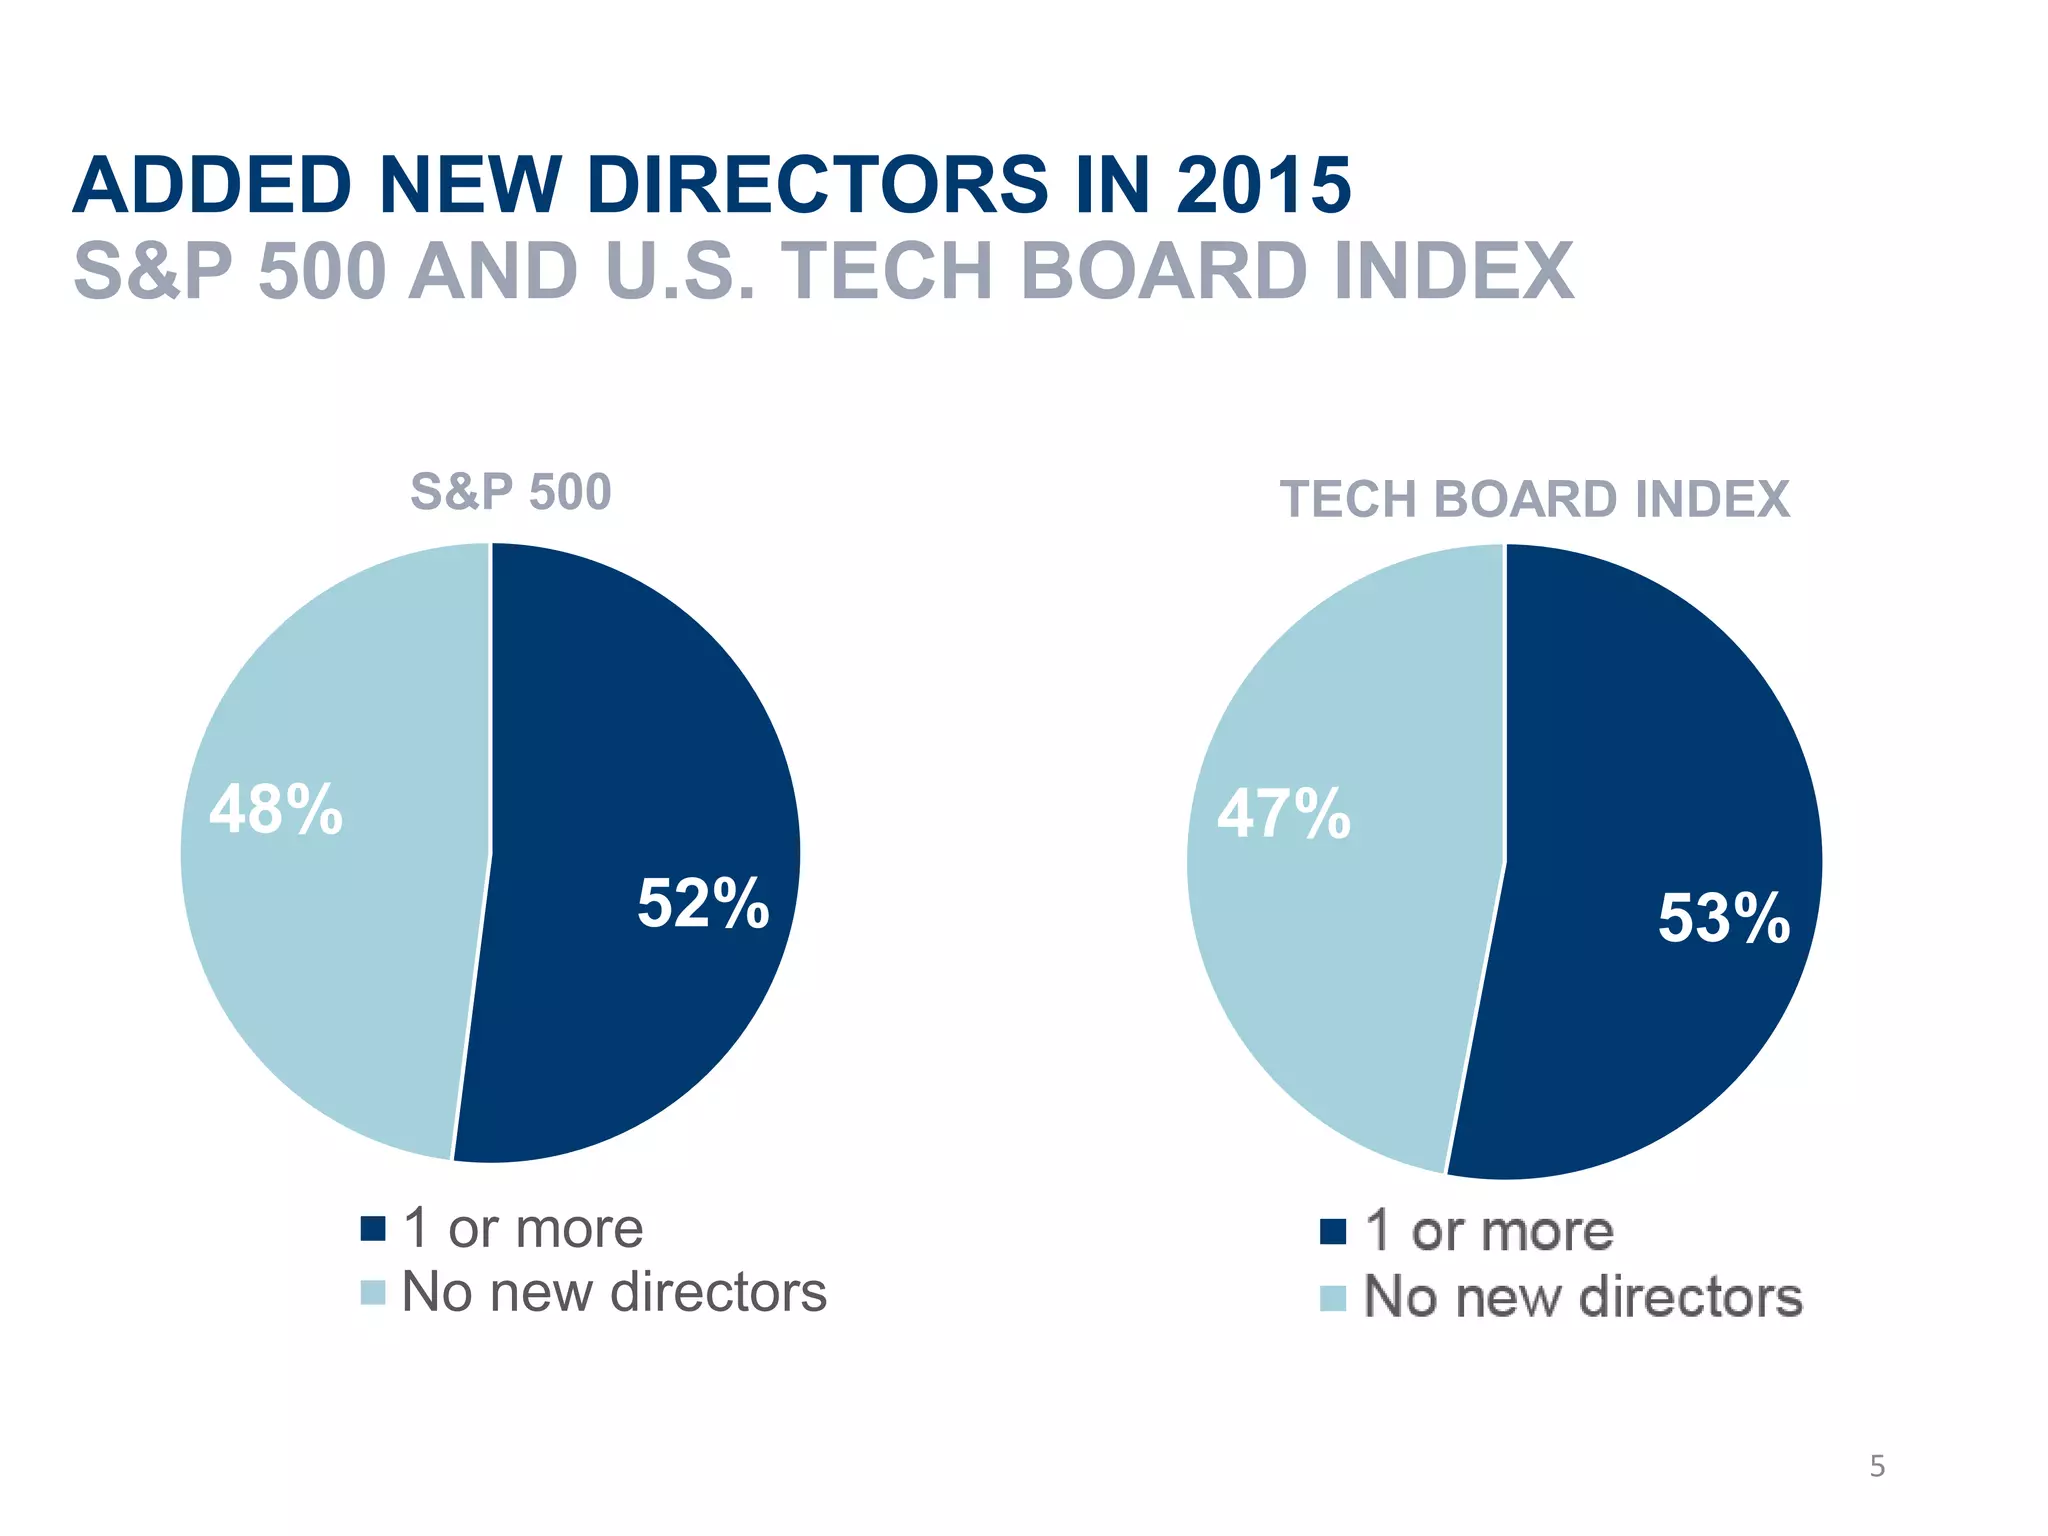
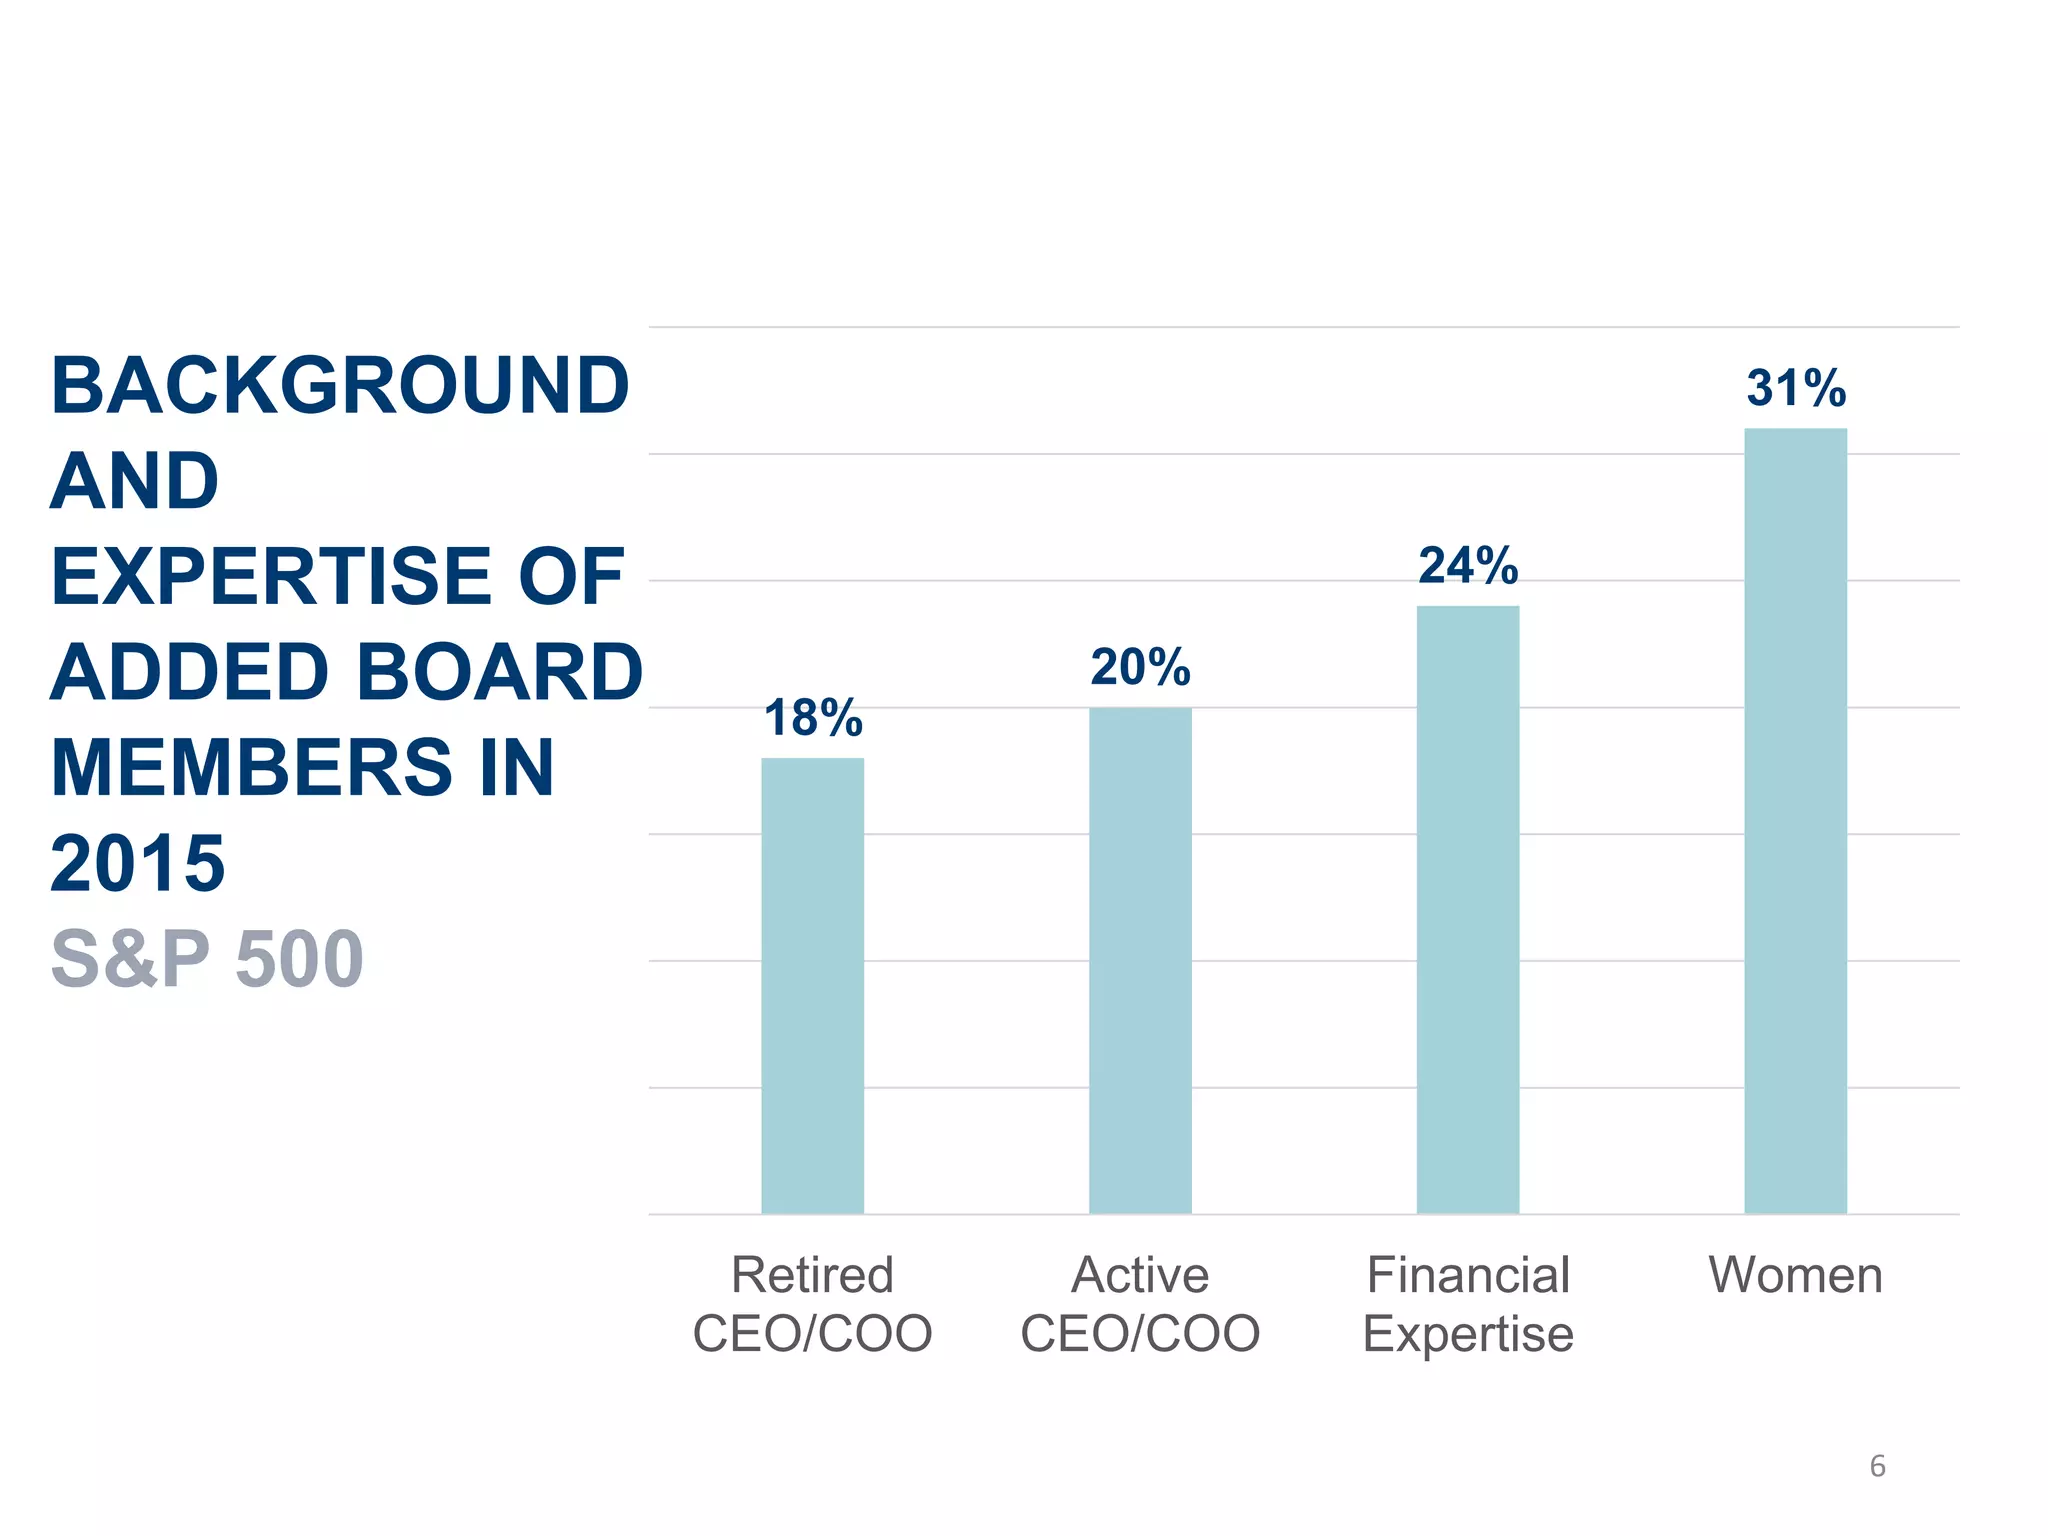
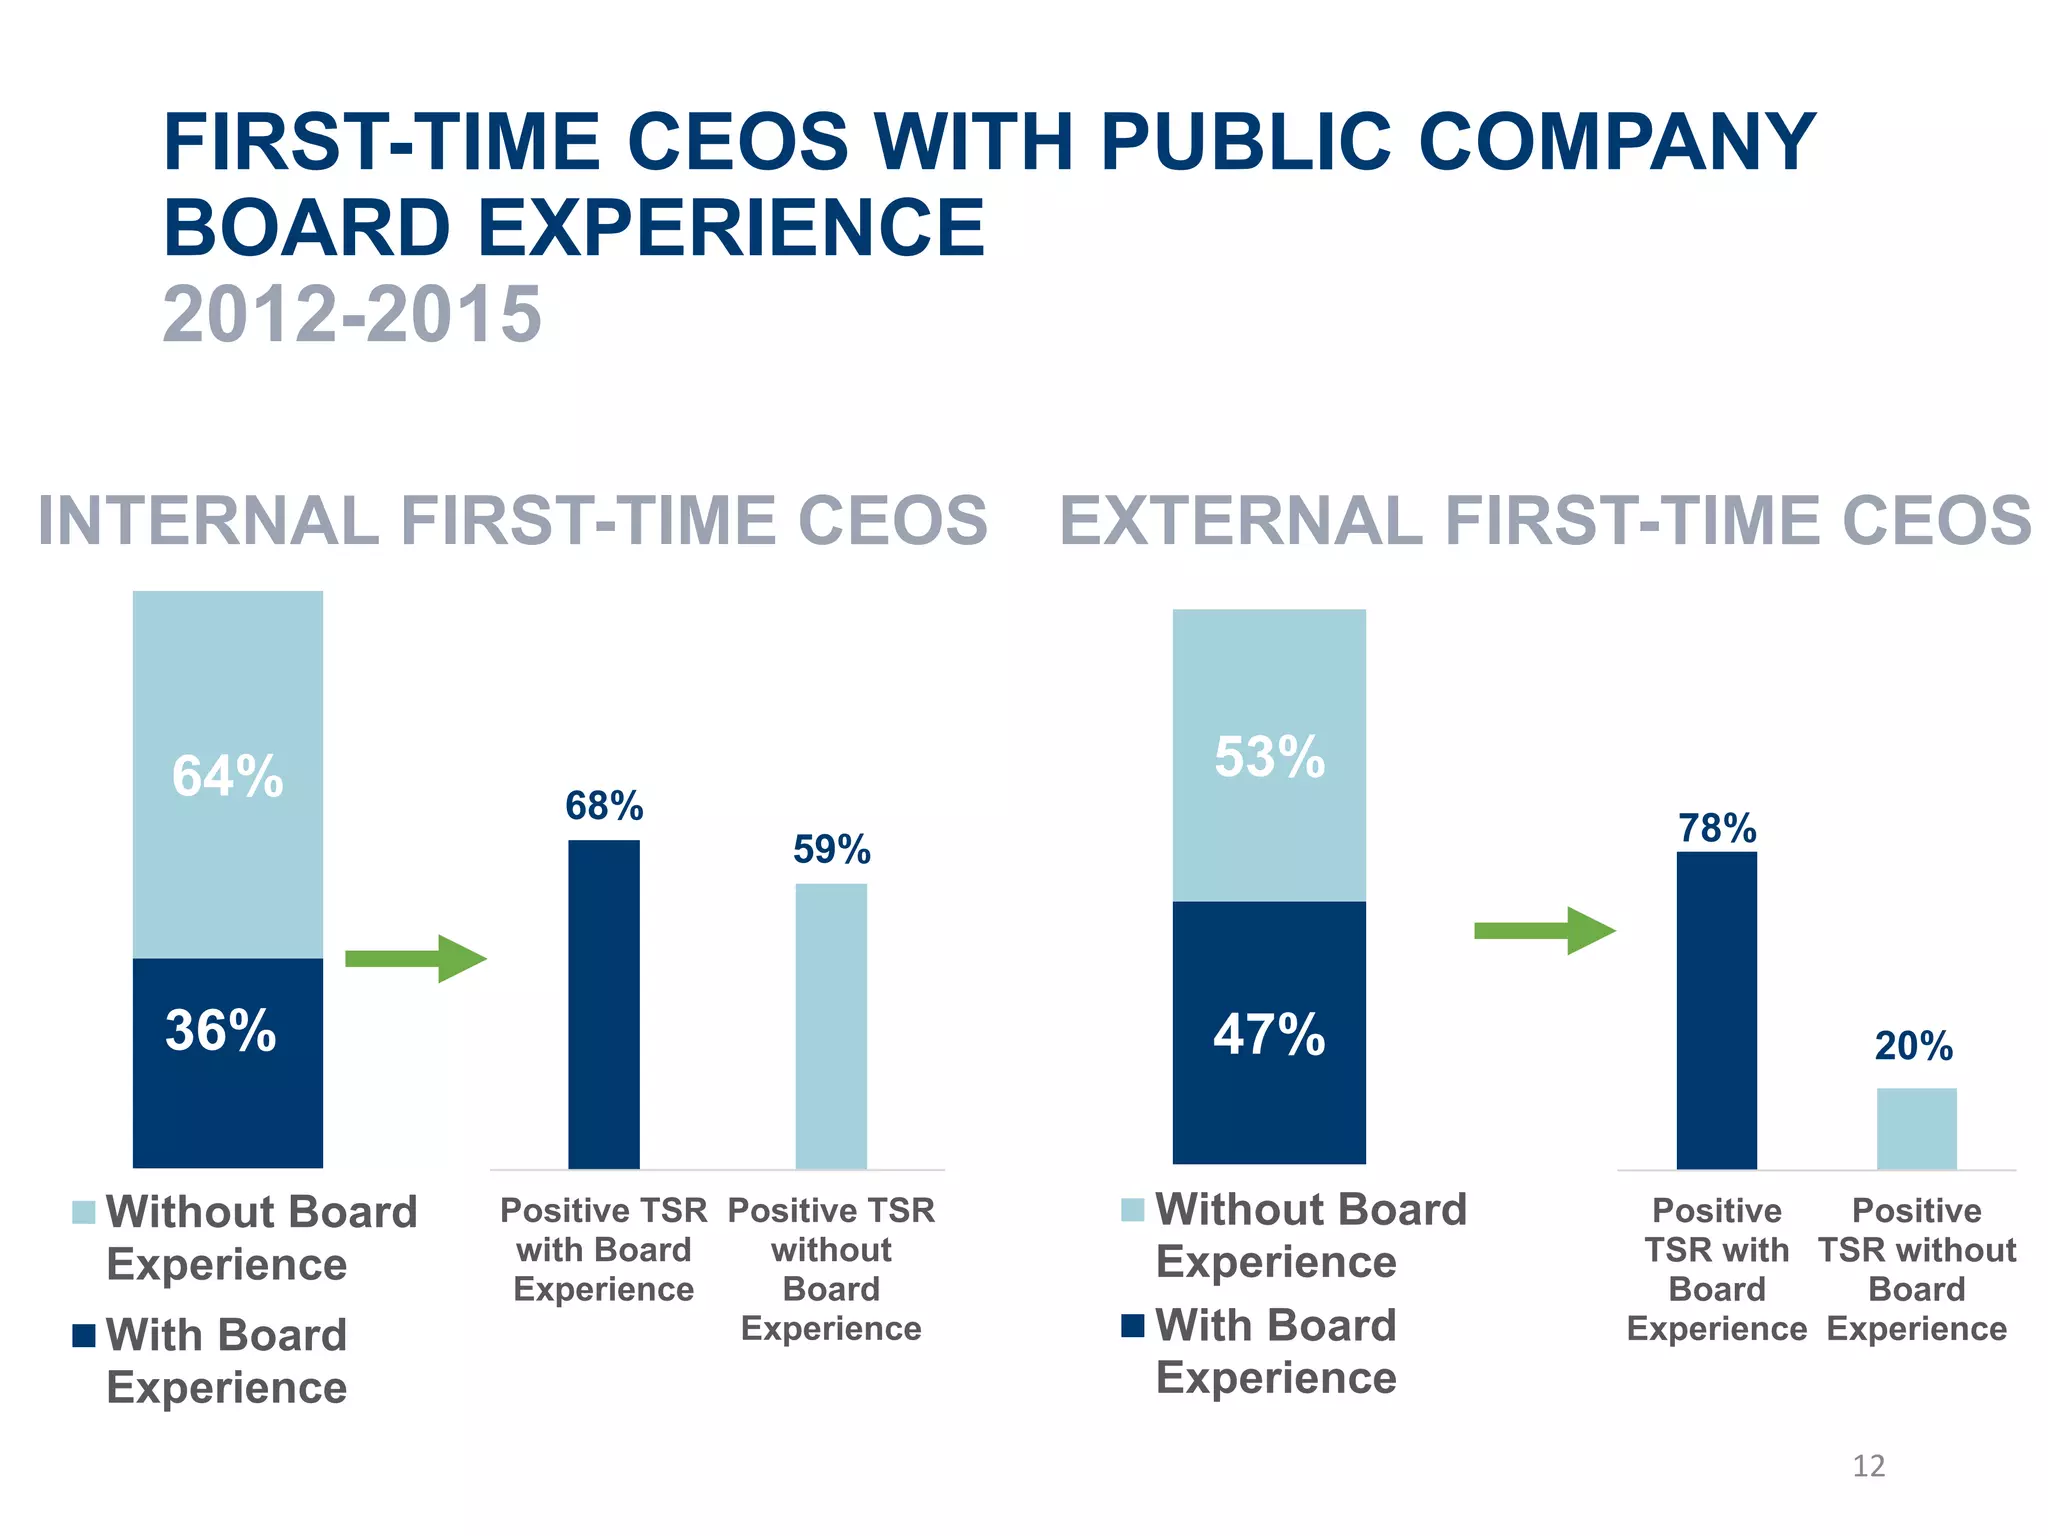
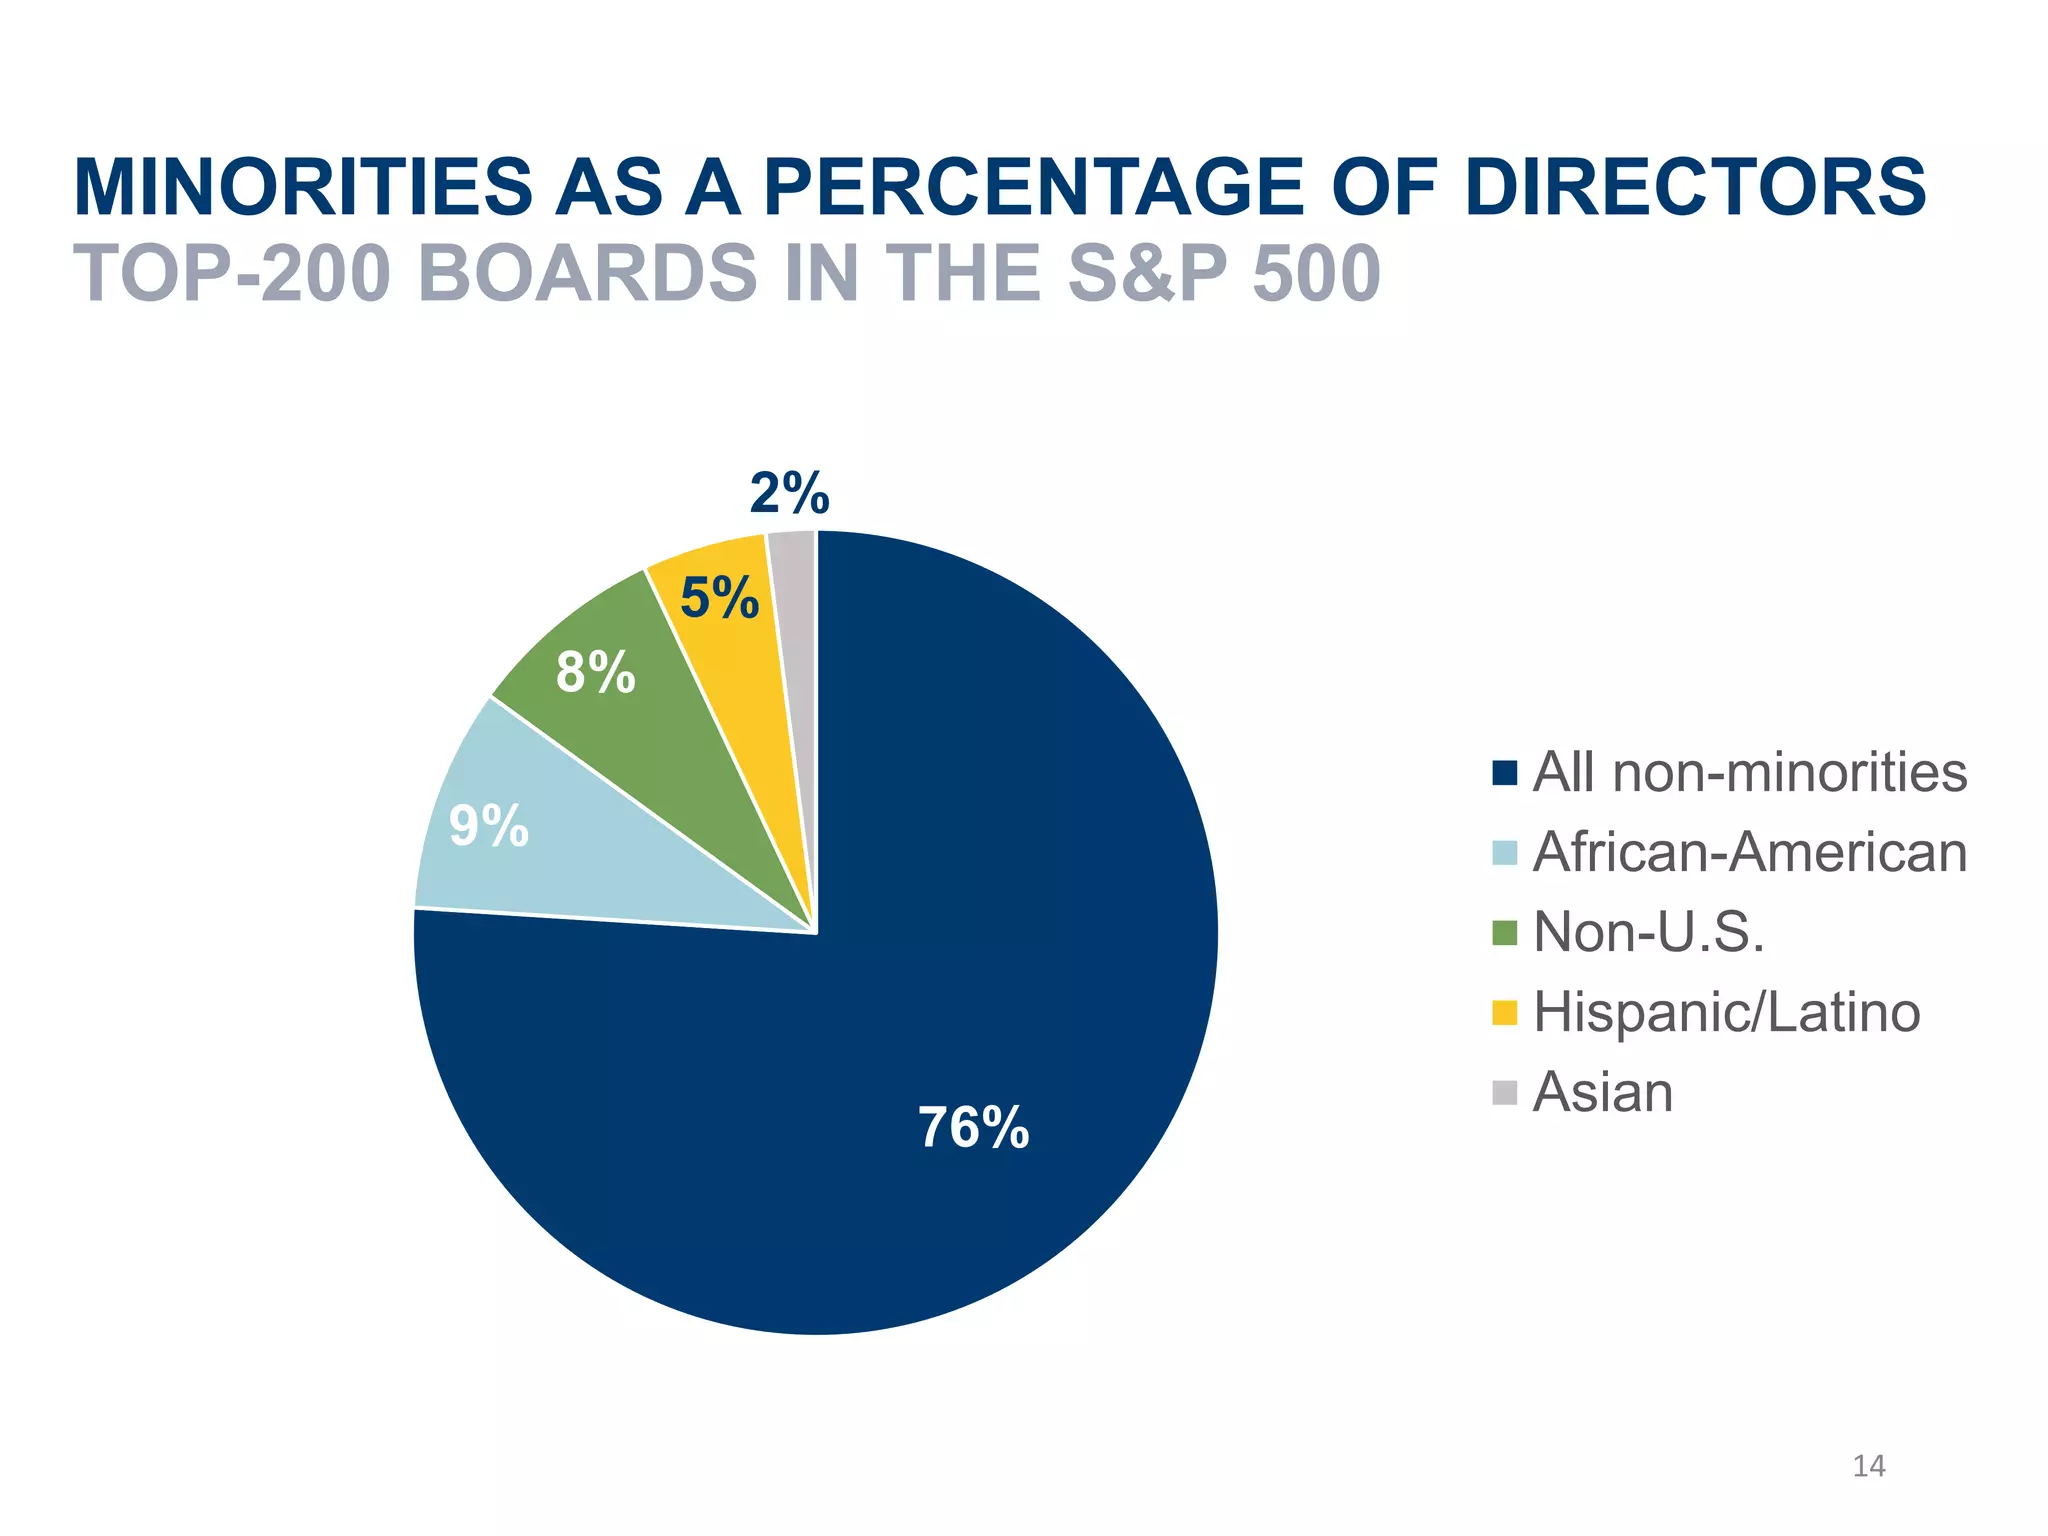
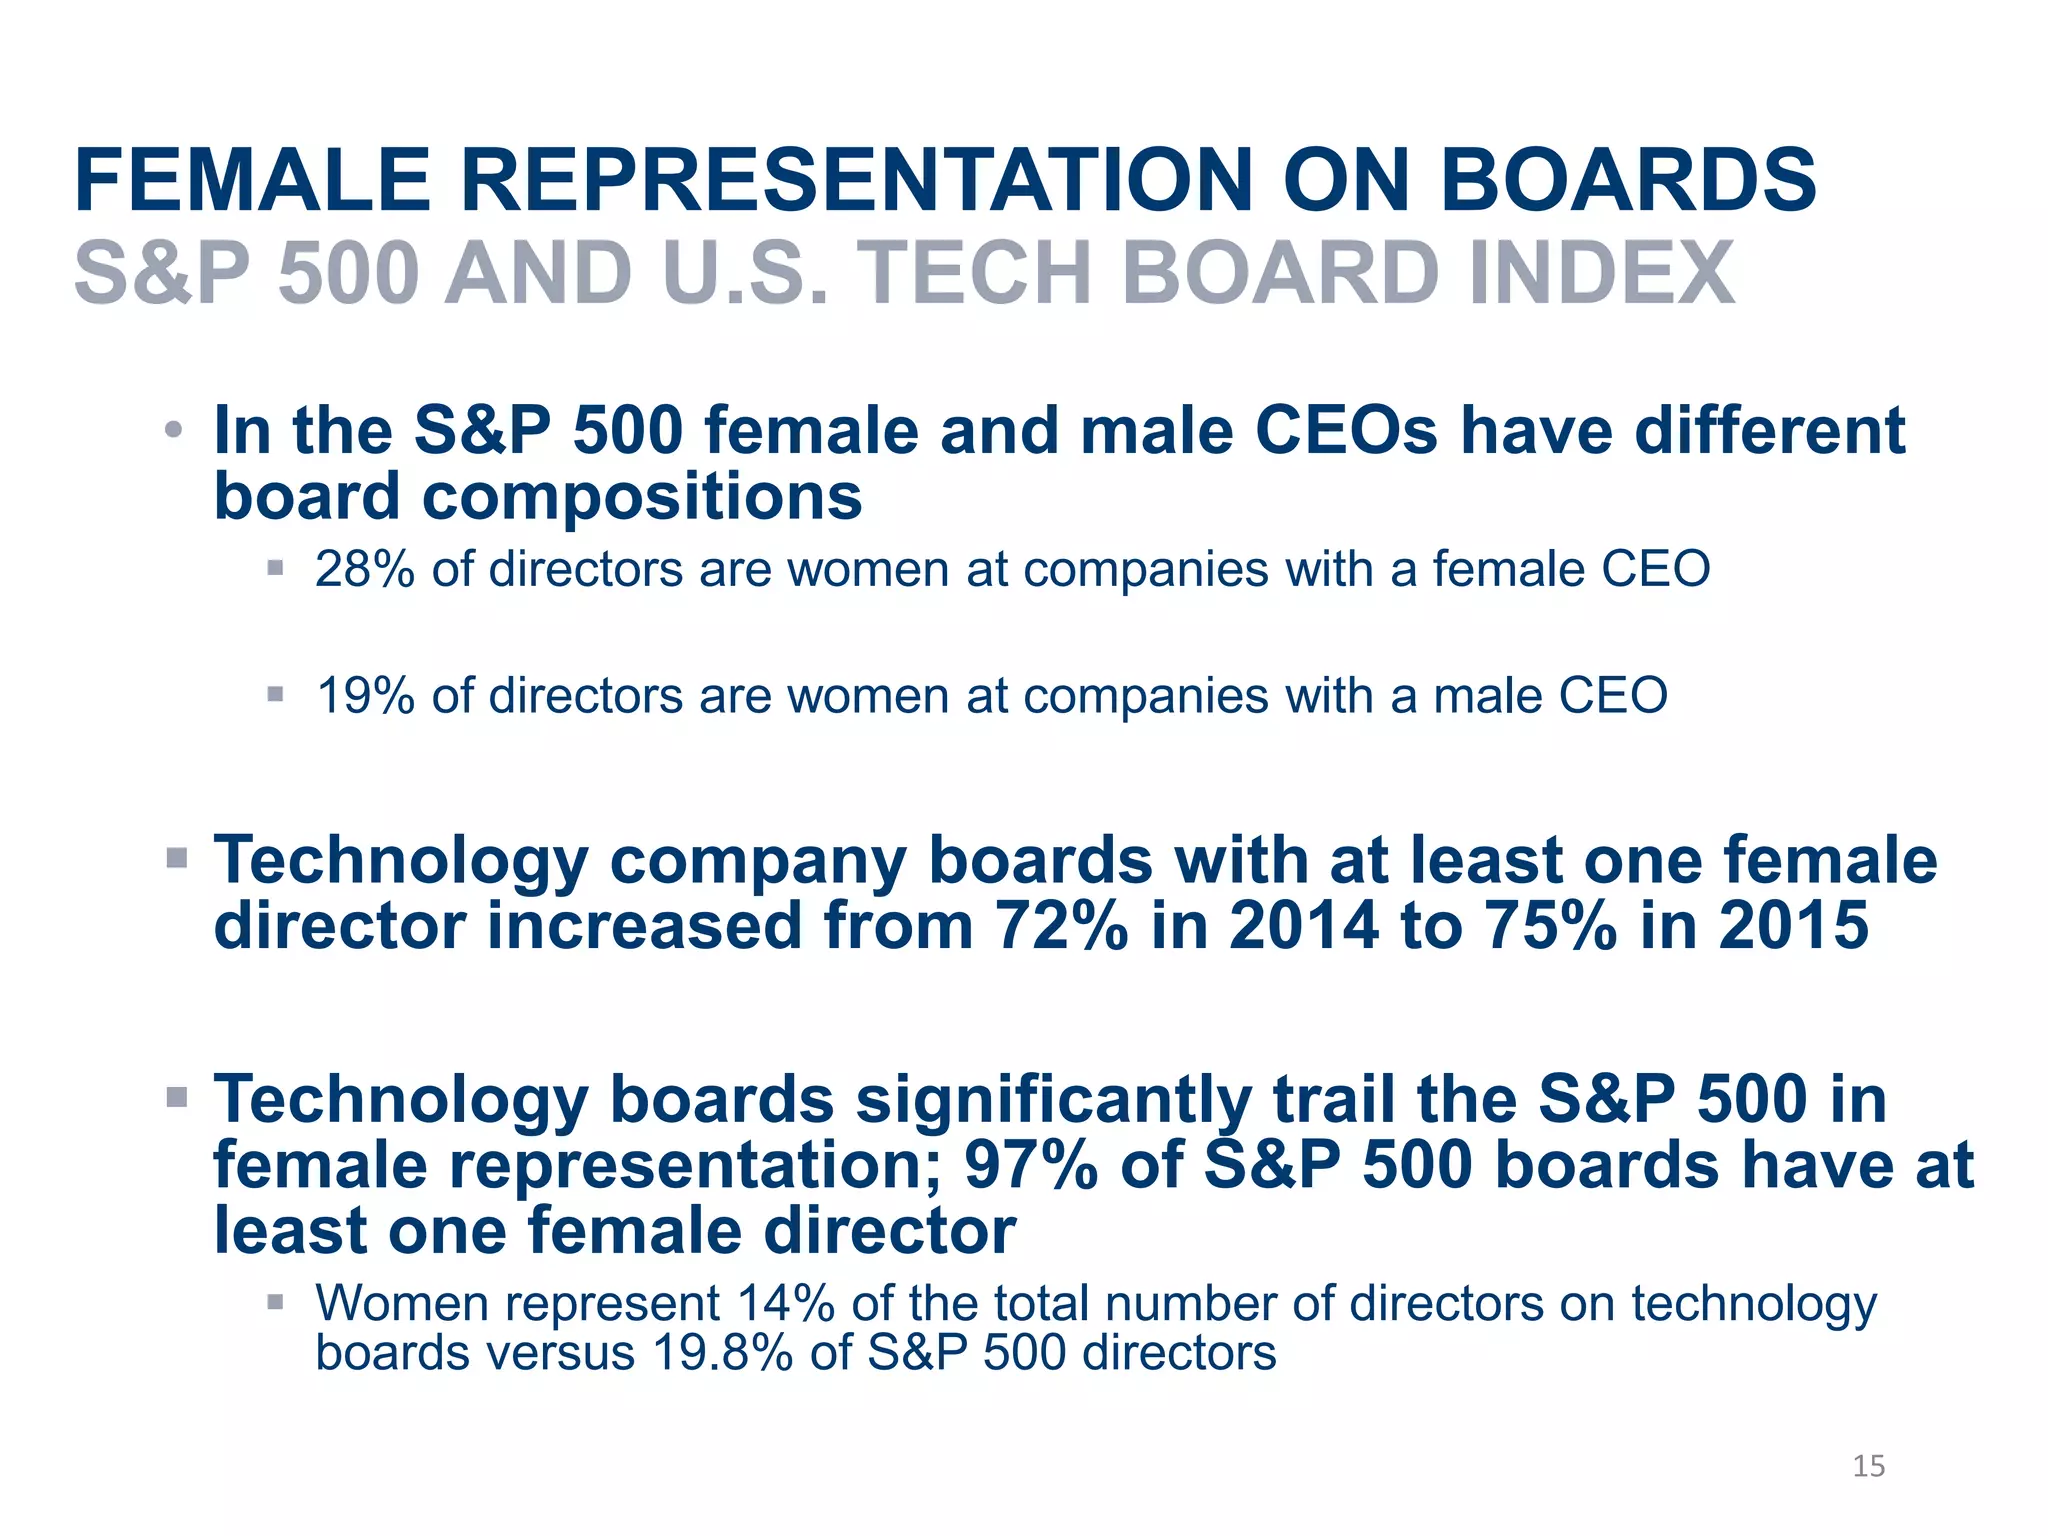
"Why Boards Matter: Building and
Developing a World Class Board of Directors”
James M. Citrin
Leader CEO Practice
Spencer Stuart
1
INTRODUCTION
This presentation was done in connection with the program, “Why Boards
Matter: Building and Developing a World Class Board of Directors,” co-hosted by
Spencer Stuart and Kleiner, Perkins, Caufield and Byers. To set the stage we
reviewed:
• Spencer Stuart’s strategic partnership with Kleiner Perkins
• Our Board Practice’s market leading presence
• Approximately 700 director searches globally
 42 percent of Fortune 100
 One-half of assignments were for companies under $1 billion in revenue
• State-of-the-art governance expertise and thought leadership
2
INPUT FOR THIS PRESENTATION
30 years
SURVEYMONKEY SURVEY
Boards Interested
Executives
42
S&P 500
Board Demographics
Trends
⋆
➲
➚
✓
SPENCER STUART BOARD INDEX
3
SPENCER STUART U.S.
TECHNOLOGY BOARD INDEX
4 years
Top 200 U.S. Tech Companies
Board Demographics
Trends
⋆
➲
➚
✓
WHAT ARE BOARDS
LOOKING FOR?
4
52%
48%
1 or more
No new directors
ADDED NEW DIRECTORS IN 2015
S&P 500 AND U.S. TECH BOARD INDEX
S&P 500
5
53%
47%
TECH BOARD INDEX
18%
20%
24%
31%
Retired
CEO/COO
Active
CEO/COO
Financial
Expertise
Women
BACKGROUND
AND
EXPERTISE OF
ADDED BOARD
MEMBERS IN
2015
S&P 500
6
NEW DIRECTOR BACKGROUND WISH LIST
S&P 500
65%
58%
54% 52% 51%
41% 41%
27%
21% 20% 16%
14% 13%
7
8
65%
58%
54%
52% 51%
41% 41%
27%
21% 20%
16%
14%
38%
71%
29%
55%
24%
10%
76%
43%
12% 14%
57%
33%
0%
10%
20%
30%
40%
50%
60%
70%
80%
S&P 500 Boards Interested
S&P 500 NEW DIRECTOR BACKGROUND WISH
LIST COMPARED TO BOARDS INTERESTED
CEOS
SNAPSHOT OF BOARDS INTERESTED
EXECUTIVES
17%
55%
55%
55%
0% 20% 40% 60%
None
NFP
Private
Public
EXPERIENCE INTERESTS/GOALS
17%
31%
60%
64%
0% 20% 40% 60% 80%
Help/Add Value
Experience for new
role
Experience for
existing role
Build portfoilio
9
THE VALUE OF
BOARD
EXPERIENCE
10
MARKET CONTEXT:
S&P 500 CEO TRANSITIONS
2004-2015
0%
10%
20%
30%
40%
50%
60%
70%
80%
90%
100%
2004 2005 2006 2007 2008 2009 2010 2011 2012 2013 2014 2015
Internals Externals Other*
11*Other includes: From Board, Former Executive, Insider-Outsider
68%
59%
Positive TSR
with Board
Experience
Positive TSR
without
Board
Experience
FIRST-TIME CEOS WITH PUBLIC COMPANY
BOARD EXPERIENCE
2012-2015
INTERNAL FIRST-TIME CEOS EXTERNAL FIRST-TIME CEOS
36%
64%
Without Board
Experience
With Board
Experience
47%
53%
Without Board
Experience
With Board
Experience
78%
20%
Positive
TSR with
Board
Experience
Positive
TSR without
Board
Experience
12
LET’S TALK ABOUT
DIVERSITY
13
MINORITIES AS A PERCENTAGE OF DIRECTORS
TOP-200 BOARDS IN THE S&P 500
76%
9%
8%
5%
2%
All non-minorities
African-American
Non-U.S.
Hispanic/Latino
Asian
14
FEMALE REPRESENTATION ON BOARDS
S&P 500 AND U.S. TECH BOARD INDEX
• In the S&P 500 female and male CEOs have different
board compositions
 28% of directors are women at companies with a female CEO
 19% of directors are women at companies with a male CEO
 Technology company boards with at least one female
director increased from 72% in 2014 to 75% in 2015
 Technology boards significantly trail the S&P 500 in
female representation; 97% of S&P 500 boards have at
least one female director
 Women represent 14% of the total number of directors on technology
boards versus 19.8% of S&P 500 directors
15
"Why Boards Matter: Building and
Developing a World Class Board of Directors”
16

Why Boards Matter: Building and Developing a World Class Board of Directors

  • 1.
    "Why Boards Matter:Building and Developing a World Class Board of Directors” James M. Citrin Leader CEO Practice Spencer Stuart 1
  • 2.
    INTRODUCTION This presentation wasdone in connection with the program, “Why Boards Matter: Building and Developing a World Class Board of Directors,” co-hosted by Spencer Stuart and Kleiner, Perkins, Caufield and Byers. To set the stage we reviewed: • Spencer Stuart’s strategic partnership with Kleiner Perkins • Our Board Practice’s market leading presence • Approximately 700 director searches globally  42 percent of Fortune 100  One-half of assignments were for companies under $1 billion in revenue • State-of-the-art governance expertise and thought leadership 2
  • 3.
    INPUT FOR THISPRESENTATION 30 years SURVEYMONKEY SURVEY Boards Interested Executives 42 S&P 500 Board Demographics Trends ⋆ ➲ ➚ ✓ SPENCER STUART BOARD INDEX 3 SPENCER STUART U.S. TECHNOLOGY BOARD INDEX 4 years Top 200 U.S. Tech Companies Board Demographics Trends ⋆ ➲ ➚ ✓
  • 4.
  • 5.
    52% 48% 1 or more Nonew directors ADDED NEW DIRECTORS IN 2015 S&P 500 AND U.S. TECH BOARD INDEX S&P 500 5 53% 47% TECH BOARD INDEX
  • 6.
  • 7.
    NEW DIRECTOR BACKGROUNDWISH LIST S&P 500 65% 58% 54% 52% 51% 41% 41% 27% 21% 20% 16% 14% 13% 7
  • 8.
    8 65% 58% 54% 52% 51% 41% 41% 27% 21%20% 16% 14% 38% 71% 29% 55% 24% 10% 76% 43% 12% 14% 57% 33% 0% 10% 20% 30% 40% 50% 60% 70% 80% S&P 500 Boards Interested S&P 500 NEW DIRECTOR BACKGROUND WISH LIST COMPARED TO BOARDS INTERESTED CEOS
  • 9.
    SNAPSHOT OF BOARDSINTERESTED EXECUTIVES 17% 55% 55% 55% 0% 20% 40% 60% None NFP Private Public EXPERIENCE INTERESTS/GOALS 17% 31% 60% 64% 0% 20% 40% 60% 80% Help/Add Value Experience for new role Experience for existing role Build portfoilio 9
  • 10.
  • 11.
    MARKET CONTEXT: S&P 500CEO TRANSITIONS 2004-2015 0% 10% 20% 30% 40% 50% 60% 70% 80% 90% 100% 2004 2005 2006 2007 2008 2009 2010 2011 2012 2013 2014 2015 Internals Externals Other* 11*Other includes: From Board, Former Executive, Insider-Outsider
  • 12.
    68% 59% Positive TSR with Board Experience PositiveTSR without Board Experience FIRST-TIME CEOS WITH PUBLIC COMPANY BOARD EXPERIENCE 2012-2015 INTERNAL FIRST-TIME CEOS EXTERNAL FIRST-TIME CEOS 36% 64% Without Board Experience With Board Experience 47% 53% Without Board Experience With Board Experience 78% 20% Positive TSR with Board Experience Positive TSR without Board Experience 12
  • 13.
  • 14.
    MINORITIES AS APERCENTAGE OF DIRECTORS TOP-200 BOARDS IN THE S&P 500 76% 9% 8% 5% 2% All non-minorities African-American Non-U.S. Hispanic/Latino Asian 14
  • 15.
    FEMALE REPRESENTATION ONBOARDS S&P 500 AND U.S. TECH BOARD INDEX • In the S&P 500 female and male CEOs have different board compositions  28% of directors are women at companies with a female CEO  19% of directors are women at companies with a male CEO  Technology company boards with at least one female director increased from 72% in 2014 to 75% in 2015  Technology boards significantly trail the S&P 500 in female representation; 97% of S&P 500 boards have at least one female director  Women represent 14% of the total number of directors on technology boards versus 19.8% of S&P 500 directors 15
  • 16.
    "Why Boards Matter:Building and Developing a World Class Board of Directors” 16