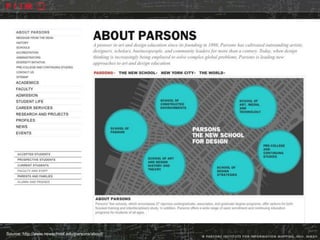
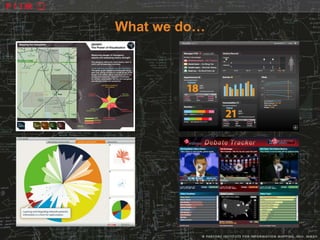
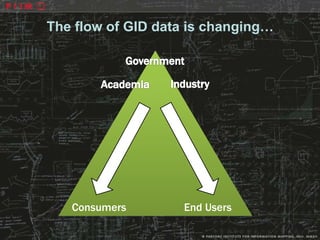
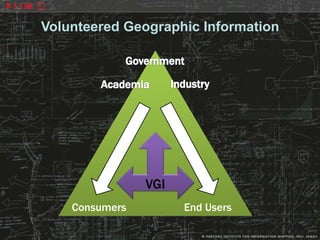
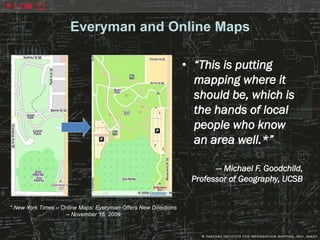
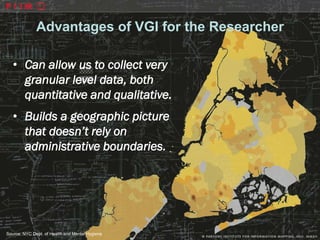
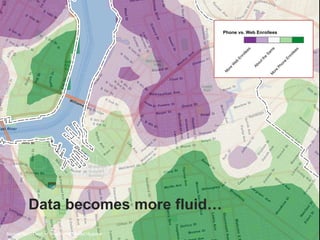
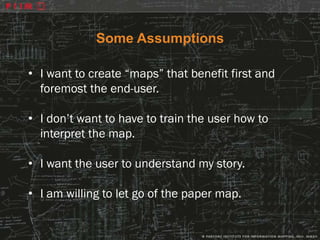
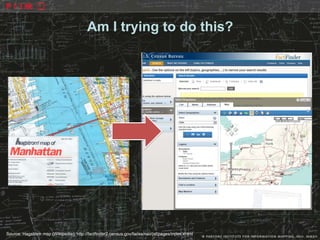
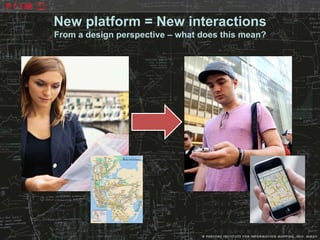
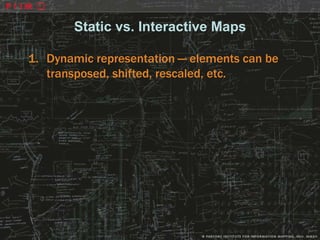
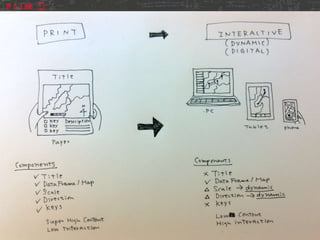
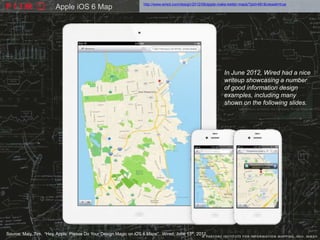
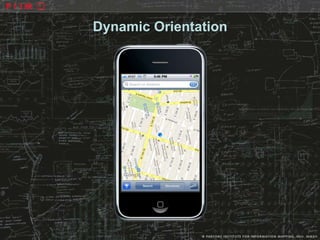
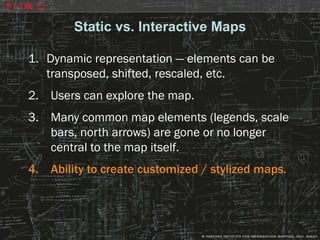
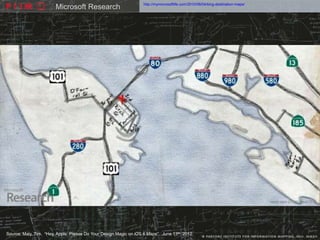
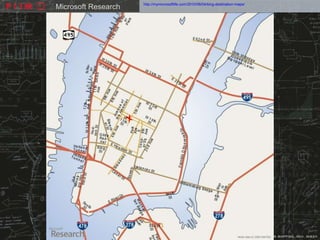
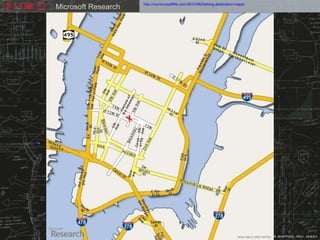
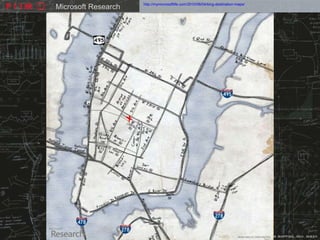
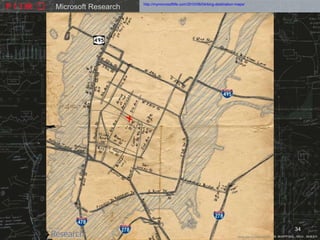
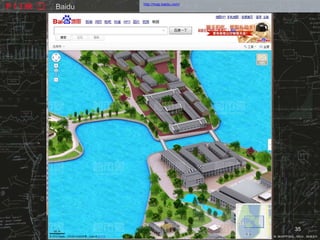
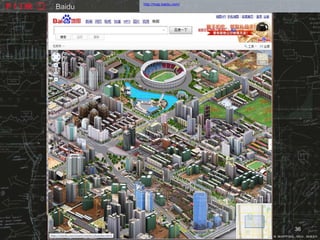
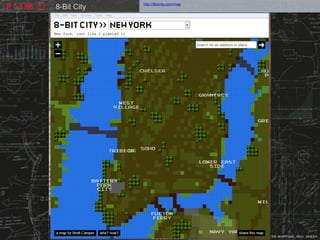
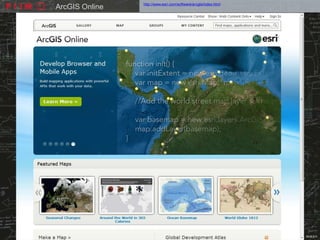
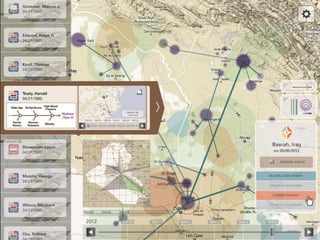
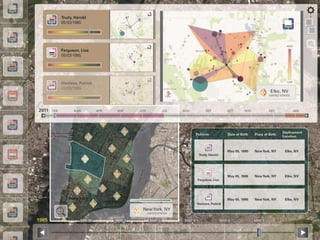
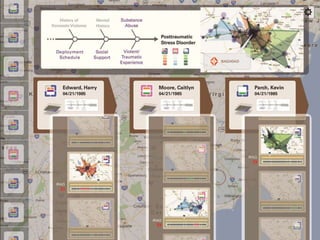
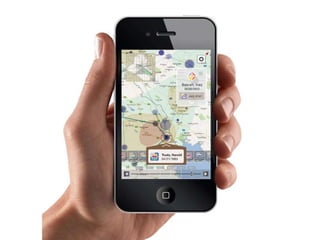
Who’s Reading Your Map?
Why knowing your audience is important

     NYCArc User Group Third Annual Symposium
                   New York City


             Chris Goranson, Director
    Sayoko Yoshida, Senior Information Designer
     Parsons Institute for Information Mapping
                  The New School
Source: http://www.newschool.edu/parsons/about/
What is the Parsons Institute for
    Information Mapping (PIIM)?

    PIIM is a research, development and
professional services facility that specializes
    in data and knowledge visualization.
What we do…
Outline

1. Why are we creating maps?

2. The changing landscape of data collection & GIS

3. Traditional maps vs. new maps

4. Design-centered strategies for map-making
WHY DO WE CREATE “MAPS”?
Why do we create maps?

• We want to convey information that provides
  spatial context to our information.

• We want to help our readers understand our data
  as it relates to them.

• We want to tell a story.

• Because making maps is fun!
THE CHANGING LANDSCAPE OF
DATA COLLECTION AND GIS
The flow of GID data is changing…


   Consumers       End Users
Volunteered Geographic Information


                VGI
    Consumers         End Users
Everyman and Online Maps

                                                                 • “This is putting
                                                                   mapping where it
                                                                   should be, which is
                                                                   the hands of local
                                                                   people who know
                                                                   an area well.*”

                                                                        — Michael F. Goodchild,
                                                                  Professor of Geography, UCSB


* New York Times – Online Maps: Everyman Offers New Directions
                    – November 16, 2009.
Advantages of VGI for the Researcher

   • Can allow us to collect very
     granular level data, both
     quantitative and qualitative.
   • Builds a geographic picture
     that doesn’t rely on
     administrative boundaries.


Source: NYC Dept. of Health and Mental Hygiene
Phone vs. Web Enrollees


                                                                                  e
                                                               es


                                                                                                      es
                                                                                  m
                                                            lle


                                                                                                 lle
                                                                                Sa
                                                          ro


                                                                                                 ro
                                                                            e
                                                       En


                                                                                               En
                                                                           th
                                                     eb


                                                                      ut


                                                                                           e
                                                                                          on
                                                                       o
                                                    W


                                                                    Ab


                                                                                      Ph
                                                   e
                                                  or


                                                                                      e
                                                 M


                                                                                  or
                                                                                 M
                                                       World Street Map


          Data becomes more fluid…
Source: NYC Dept. of Health and Mental Hygiene
TRADITIONAL VS. NEW
“MAP” MAKING
Some Assumptions

• I want to create “maps” that benefit first and
  foremost the end-user.

• I don’t want to have to train the user how to
  interpret the map.

• I want the user to understand my story.

• I am willing to let go of the paper map.
Am I trying to do this?


Source: Hagstrom map (Wikipedia); http://factfinder2.census.gov/faces/nav/jsf/pages/index.xhtml
New platform = New interactions
From a design perspective – what does this mean?
Our brainstorming session…
Static vs. Interactive Maps

1. Dynamic representation — elements can be
   transposed, shifted, rescaled, etc.
EURO CRISIS — CNN   http://edition.cnn.com/SPECIALS/business/euro-crisis/index.html?iid=article_sidebar
                                  Screen clipping taken: 6/18/2012 5:48 PM


Source: CNN
Rescaling Map With Gesture


Zoom in                  Zoom out
Static vs. Interactive Maps

1. Dynamic representation — elements can be
   transposed, shifted, rescaled, etc.
2. Users can explore the map.
http://www.bing.com/maps
Bing   Screen clipping taken: 6/18/2012 5:48 PM
http://www.yelp.com/manhattan
Yelp
Static vs. Interactive Maps

1. Dynamic representation — elements can be
   transposed, shifted, rescaled, etc.
2. Users can explore the map.
3. Many common map elements (legends, scale
   bars, north arrows) are gone or no longer
   central to the map itself.


                                               25
New platform = New interactions


26
http://www.wired.com/design/2012/06/apple-make-better-maps/?pid=481&viewall=true
                        Apple iOS 6 Map


                                                                                                                In June 2012, Wired had a nice
                                                                                                                writeup showcasing a number
                                                                                                                of good information design
                                                                                                                examples, including many
                                                                                                                shown on the following slides.


Source: Maly, Tim. “Hey, Apple: Please Do Your Design Magic on iOS 6 Maps”. Wired, June 13th, 2012.
Dynamic Orientation
Static vs. Interactive Maps

1. Dynamic representation — elements can be
   transposed, shifted, rescaled, etc.
2. Users can explore the map.
3. Many common map elements (legends, scale
   bars, north arrows) are gone or no longer
   central to the map itself.
4. Ability to create customized / stylized maps.
http://mymicrosoftlife.com/2010/06/04/bing-destination-maps/
                        Microsoft Research


Source: Maly, Tim. “Hey, Apple: Please Do Your Design Magic on iOS 6 Maps”. June 13th, 2012.
http://mymicrosoftlife.com/2010/06/04/bing-destination-maps/
Microsoft Research
http://mymicrosoftlife.com/2010/06/04/bing-destination-maps/
Microsoft Research
http://mymicrosoftlife.com/2010/06/04/bing-destination-maps/
Microsoft Research
http://mymicrosoftlife.com/2010/06/04/bing-destination-maps/
Microsoft Research


                                                                                    34
http://map.baidu.com/
Baidu


                                35
http://map.baidu.com/
Baidu


                                36
http://8bitcity.com/map
8-Bit City
Static vs. Interactive Maps

1. Dynamic representation — elements can be
   transposed, shifted, rescaled, etc.
2. Users can explore the map.
3. Many common map elements (legends, scale
   bars, north arrows) are gone or no longer
   central to the map itself.
4. Ability to create customized / stylized maps.
5. Advanced spatial processes now underpin
   popular visualization techniques
http://www.bing.com/maps
Bing   Screen clipping taken: 6/18/2012 5:48 PM
http://www.bing.com/maps
Bing   Screen clipping taken: 6/18/2012 5:48 PM


                                                  40
http://maps.stamen.com/watercolor/#11/40.7070/-73.9726
Stamen   Screen clipping taken: 6/21/2012 1:49 PM
http://www.esri.com/software/arcgis/index.html
ArcGIS Online
FROM A DESIGN PERSPECTIVE,
WHAT DOES THIS MEAN?

                             43
Lessons Learned

1. The user is central to the map experience,
   not the map maker.
2. Familiarity and ease-of-use drive map adoption.
3. Different maps serve different purposes, but all
   maps are better when simplified.
4. The interface is just a mechanism for accessing
   the information — it does not need to look like a
   paper map.


                                                       44
Guiding Principles

• Affordance — How easy is it to use the map?
• Appropriate Feedback — Do the buttons do what
  I tell them to do?
• Consistency and Standards — Is the map confusing
  or frustrating?
• Flexibility and Efficiency — Do I have to be an expert?
• Engagement — Is it fun to use the map?
• Discovery and New Knowledge — Do I learn
  something by using the map?
49
Next Steps

• Develop design criteria for interactive maps
• Analyze categories for maps based on the purpose
• Identify appropriate design principles for map groups
• Develop guidelines for user interaction and usability
  requirements
Thank You!

Chris Goranson, Director
212-229-6825 x4712
goransoc@newschool.edu

Sayoko Yoshida
Senior Information Designer
212-229-6825 x.4656
yoshidas@newschool.edu

Who\'s Reading Your Map? Why knowing your audience is important