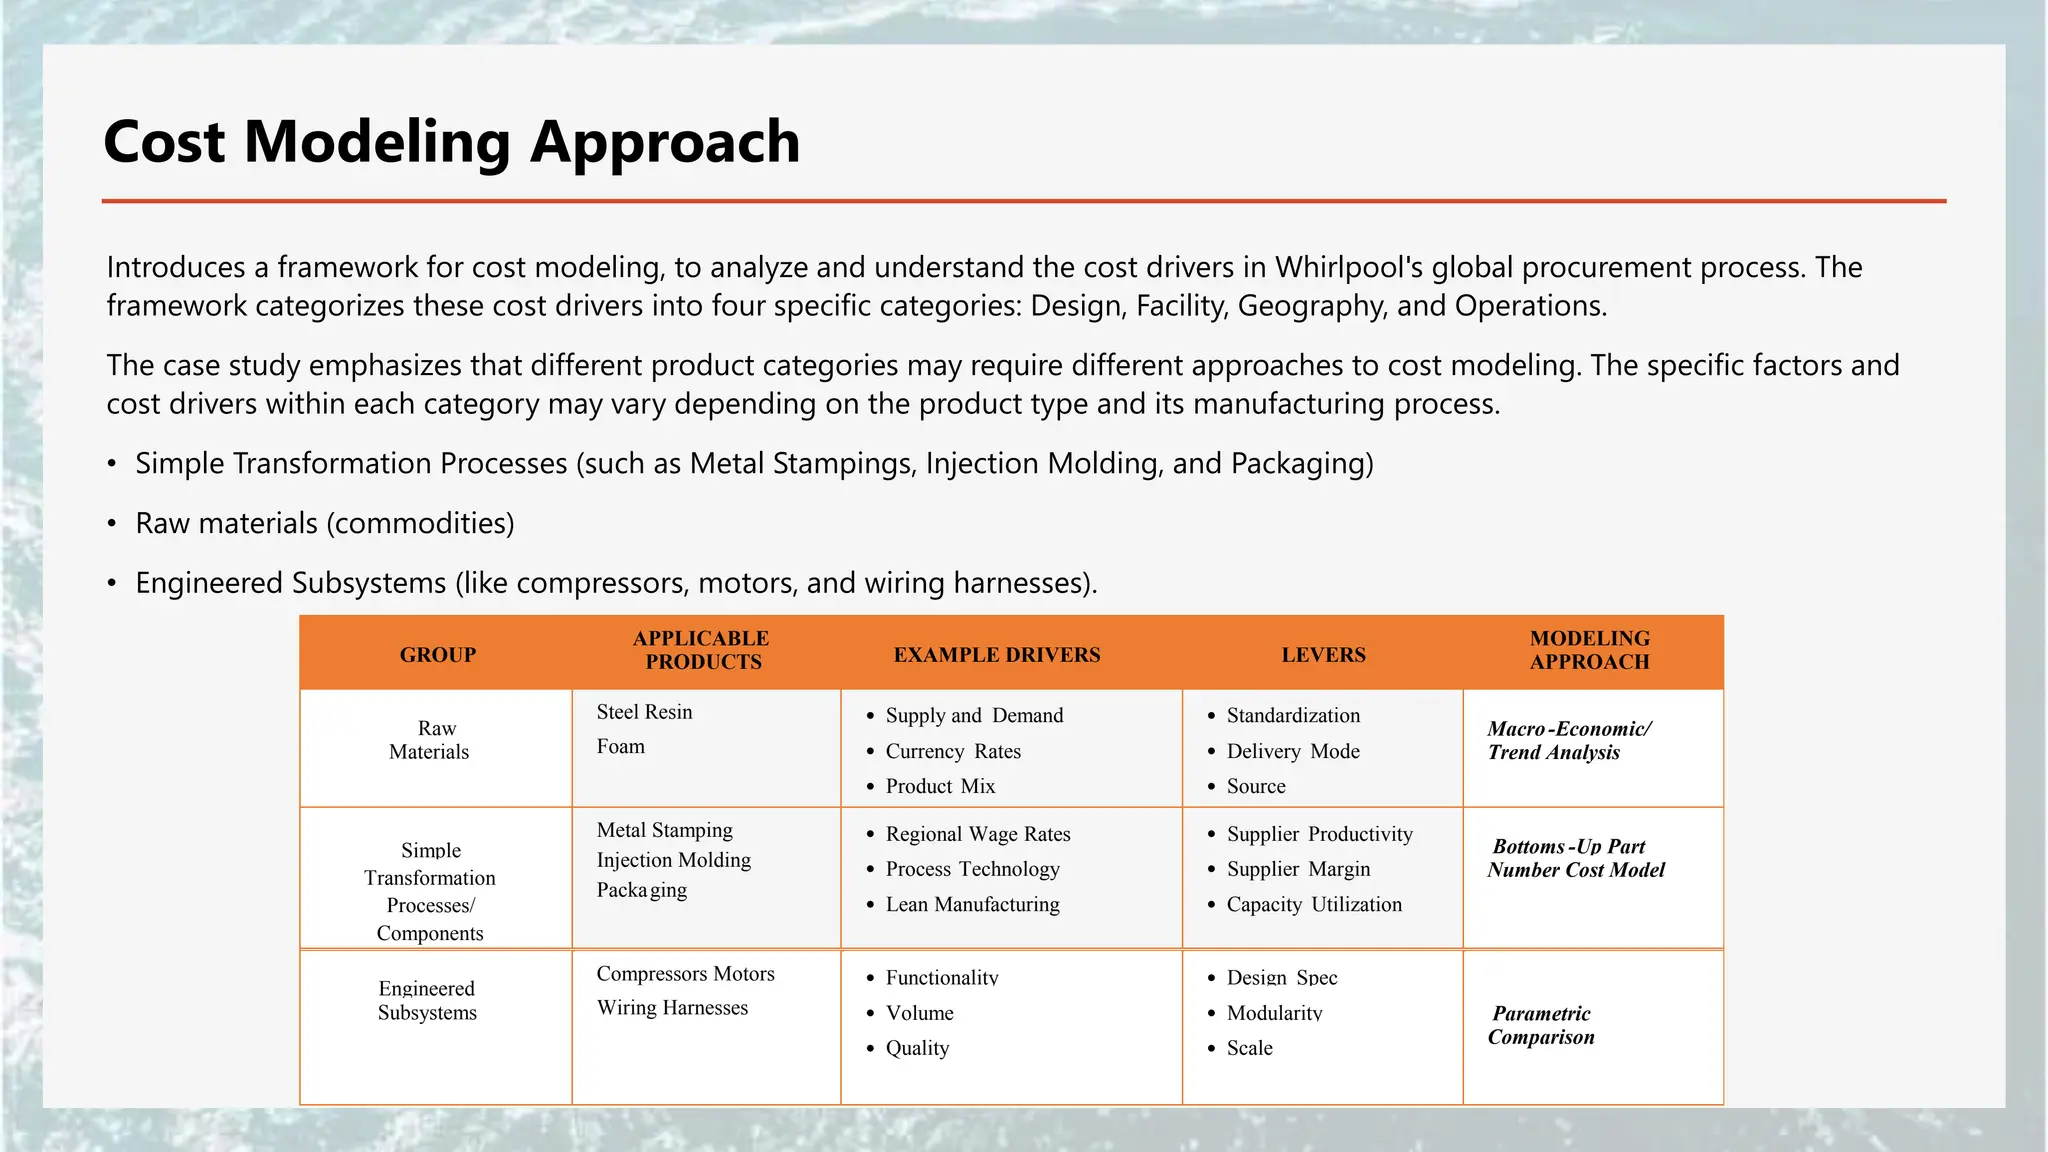
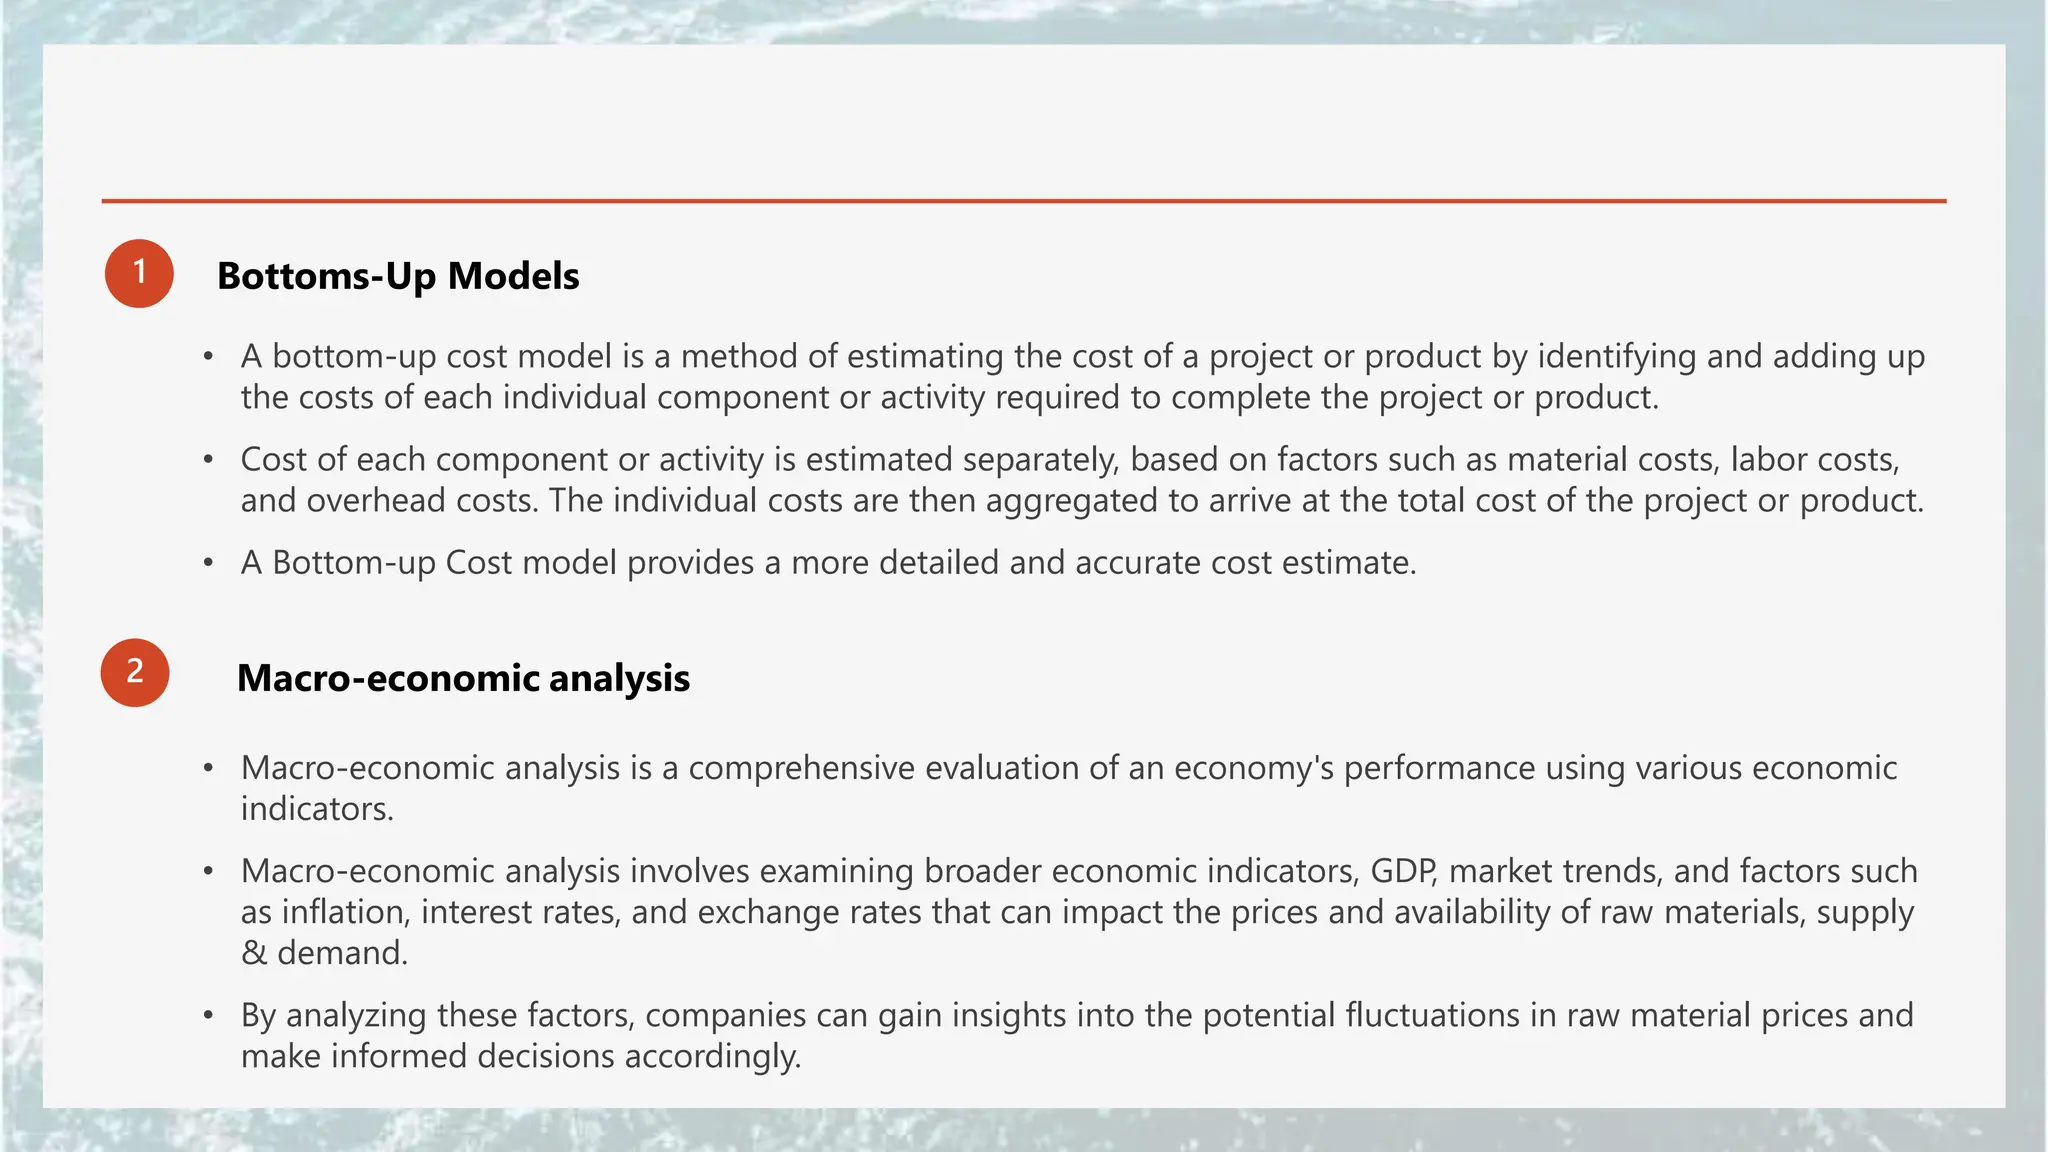
Whirlpool Corporation Global
Procurement
Discussing different approaches to cost modeling and
analyzing cost drivers for various product categories
Presented By:
Farrukh Aftab – 44550
Umair Zaman – 50744
Safder Rasool - 46944
Intizar Hussain - 47642
Whirlpool Historical Background
• Whirlpool Corporation traces its roots back to the Upton Motor Machine Company, founded in 1911.
• Whirlpool Corporation operates manufacturing facilities in 13 countries worldwide and products are
marketed in over 170 countries, demonstrating its wide market penetration and global presence.
• Whirlpool Corporation owns and operates several major appliance brands, including Whirlpool, KitchenAid,
Roper, Estate, Bauknecht, Ignis, Laden, Inglis, Brastemp, and Consul.
• Whirlpool Corporation supplies appliances to Sears, Roebuck and Co., which are marketed and sold under
the popular Kenmore brand name. This partnership expands Whirlpool's market reach and strengthens its
presence in the retail sector.
• Whirlpool Corporation expanded globally through investments, joint ventures, and acquisitions in the
1980s and early 1990s.
• North America, including Mexico, accounts for about two-thirds of the company's revenues ($11 Billion):
- North America (incl. Mexico): 2/3 (approximately $7.33 billion)
- Rest of the world: 1/3 (approximately $3.67 billion)
Whirlpool Organization Structure
Whirlpool Corporation's Senior Management Team
• Chairman
• President
• Executive Vice Presidents (5 total):
• EVP for North America
• EVP for Europe
• EVP for Latin America
• Chief Financial Officer (CFO)
• Chief Technology Officer (CTO)
• Both CFO & CTO are responsible for product development and procurement.
• Whirlpool Corporation established a Global Procurement Organization (GPO) in the mid-1990s to drive efficiency in
product design and sourcing across the regions. GPO reports to the CTO.
• The GPO manages critical commodities on a global basis while also collaborating with regional Procurement vice
presidents, and the continuous pursuit of best practices to optimize procurement processes and achieve organizational
objectives.
Cost Modeling Approach
Introduces a framework for cost modeling, to analyze and understand the cost drivers in Whirlpool's global procurement process. The
framework categorizes these cost drivers into four specific categories: Design, Facility, Geography, and Operations.
The case study emphasizes that different product categories may require different approaches to cost modeling. The specific factors and
cost drivers within each category may vary depending on the product type and its manufacturing process.
• Simple Transformation Processes (such as Metal Stampings, Injection Molding, and Packaging)
• Raw materials (commodities)
• Engineered Subsystems (like compressors, motors, and wiring harnesses).
GROUP
APPLICABLE
PRODUCTS EXAMPLE DRIVERS LEVERS
MODELING
APPROACH
Raw
Materials
Steel Resin
Foam
• Supply and Demand
• Currency Rates
• Product Mix
• Standardization
• Delivery Mode
• Source
Macro-Economic/
Trend Analysis
Simple
Transformation
Processes/
Components
Metal Stamping
Injection Molding
Packaging
• Regional Wage Rates
• Process Technology
• Lean Manufacturing
• Supplier Productivity
• Supplier Margin
• Capacity Utilization
Bottoms -Up Part
Number Cost Model
Engineered
Subsystems
Compressors Motors
Wiring Harnesses
• Functionality
• Volume
• Quality
• Design Spec
• Modularity
• Scale
Parametric
Comparison
Bottoms-Up Models
1
• A bottom-up cost model is a method of estimating the cost of a project or product by identifying and adding up
the costs of each individual component or activity required to complete the project or product.
• Cost of each component or activity is estimated separately, based on factors such as material costs, labor costs,
and overhead costs. The individual costs are then aggregated to arrive at the total cost of the project or product.
• A Bottom-up Cost model provides a more detailed and accurate cost estimate.
Macro-economic analysis
2
• Macro-economic analysis is a comprehensive evaluation of an economy's performance using various economic
indicators.
• Macro-economic analysis involves examining broader economic indicators, GDP, market trends, and factors such
as inflation, interest rates, and exchange rates that can impact the prices and availability of raw materials, supply
& demand.
• By analyzing these factors, companies can gain insights into the potential fluctuations in raw material prices and
make informed decisions accordingly.
Multivariate Regression Analysis
3
• It is a statistical technique used to identify the relationship between multiple variables and a specific outcome.
• It can be used to identify the key factors that contribute to the cost of a complex product such as a motor,
compressors
• Analyzing the relationship between variables such as raw material costs, labor costs, and production volumes, it is
possible to quantify the impact of each variable on the overall cost of the product.
• Using Multivariate Regression analysis it becomes possible to identify areas where cost savings can be achieved.
For example, a better understanding of the key cost drivers may enable procurement teams to negotiate better
prices with suppliers or to identify opportunities for process optimization or product redesign.
Parametric Comparison
• A "Parametric Comparison" involves comparing the performance and cost of similar products across
different regions, while controlling for differences in product specifications and other factors that may
impact performance.
• In this case study, the goal is to use regression analysis to identify the key factors that impact the cost and
performance of compressors and to compare these factors across different regions.
• To conduct a meaningful analysis of compressors using regression analysis, it is necessary to have a good
understanding of the product and the factors that impact its performance and cost. This may involve
consulting with subject matter experts or having a deeper understanding of the product and the market.
• They hypothesize various key parameters such as size, cooling capacity, and energy efficiency, related to
the compressor. The size and capacity of the compressor may impact its manufacturing cost as larger
compressors may require bigger and heavier parts. They suggest that larger compressors may cost more
to make and, consequently, be priced higher.
• They imagine that larger compressors with higher cooling capacities may be priced higher due to their
value to consumers, and energy efficiency adds to the value proposition. However, further analysis is
required to determine the specific impact of these parameters on manufacturing cost and pricing.
Economy of Scale
• One of the participants also suggests that the annual purchase (number of units purchased within a given time frame)
might have an impact on costs.
• Others explain that higher unit volumes tend to result in lower costs per unit due to economies of scale. Economies of
scale refer to cost advantages that arise from increased production or operational efficiencies when producing larger
quantities.
• This is because higher volumes allow for the amortization of one-time costs (e.g., product design) and batch costs (e.g.,
machine setups) over a greater number of units. As a result, the cost per unit decreases, leading to potential cost
savings.
• It clarifies that while the economy of scale is related to cost reductions, it is more closely associated with facility capacity
(the ability of production facilities) rather than volume at an individual SKU (Stock Keeping Unit) level. The capacity of the
production facilities to handle larger volumes efficiently and effectively contributes to achieving economies of scale.
Conclusion:
Higher unit volumes tend to result in lower costs per unit due to economies of scale. By producing larger quantities, one-time
and batch costs can be spread over more units, leading to cost savings. Economy of scale, although related to volume,
primarily pertains to the capacity of production facilities to handle larger volumes efficiently.
Study on Cost Comparison of Injection-Molded Parts
• Collected data for comparison of prices of injection-molded parts between Europe and North America.
• Collected detailed supplier data comparing the costs of producing six identical parts in Europe and North America to figure out the
reasons behind the changes in prices and understand the expenses involved in making injection-molded parts in Europe and North
America.
• Identify the key factors driving the cost differences between Europe and North America.
• Considering a framework based on four categories of cost drivers: Design, Facility, Geography, and Operations.
a. Design: This category recognizes that different design concepts can result in varying costs, even if the functionality of the products
remains the same. For example, using reciprocating compressors versus scroll compressors may have different cost implications.
b. Facility: The facility category considers the cost drivers related to the production facilities themselves. Factors such as facility size,
equipment, automation, and capacity utilization can impact costs.
c. Geography: The geography category takes into account location-specific factors that influence costs, such as labor rates, raw
material availability, transportation costs, and regulatory requirements.
d. Operations: The operations category includes cost drivers associated with the manufacturing process and operations management.
This can involve factors like production efficiency, waste reduction, quality control, and supply chain management.
• This framework is also applicable to compressors. It can help in identifying and analyzing the key cost drivers for compressors,
considering factors related to design, facility, geography, and operations.
- Cost drivers: factors that affect the cost of a product or service. - Capacity utilization: the degree to which a production facility is being used to produce goods or services.
• Regression analysis shows a relationship between variables but does not prove cause and effect.
• Parametric analysis will be used to determine if a difference exists between regions.
• Design is not a factor in comparing plastic parts. Other factors affecting cost may be Geography, Facility & Operation.
• By considering these categories, a comprehensive analysis of cost drivers can be conducted.
• By analyzing utilization levels and productivity differences, a more comprehensive understanding of cost variations can
be gained.
• By addressing these factors, a clearer picture of the cost differences between regions can be obtained.
• The objectives of the analysis include demonstrating the power of cost modeling, showcasing different techniques for
different product categories, and identifying evidence of regional performance differences or opportunities for sharing
insights.
• Cost models are tools that can drive sourcing strategies.
• Cost models can help identify geographic cost drivers, such as comparing cost savings from low-factor cost countries to
the high transportation costs associated with sourcing from those regions.
• Cost models can also be used in negotiations, although other factors like industry structure and competitive tension also
play a role.
Discussion Points
Conclusion
It concludes with a discussion about the application of cost models,
including driving sourcing strategies, using them in negotiations,
and sharing insights and learning across regions within Whirlpool
Corporation.

Whirlpool Corporation Global Procurement.pptx

  • 1.
    Whirlpool Corporation Global Procurement Discussingdifferent approaches to cost modeling and analyzing cost drivers for various product categories Presented By: Farrukh Aftab – 44550 Umair Zaman – 50744 Safder Rasool - 46944 Intizar Hussain - 47642
  • 2.
    Whirlpool Historical Background •Whirlpool Corporation traces its roots back to the Upton Motor Machine Company, founded in 1911. • Whirlpool Corporation operates manufacturing facilities in 13 countries worldwide and products are marketed in over 170 countries, demonstrating its wide market penetration and global presence. • Whirlpool Corporation owns and operates several major appliance brands, including Whirlpool, KitchenAid, Roper, Estate, Bauknecht, Ignis, Laden, Inglis, Brastemp, and Consul. • Whirlpool Corporation supplies appliances to Sears, Roebuck and Co., which are marketed and sold under the popular Kenmore brand name. This partnership expands Whirlpool's market reach and strengthens its presence in the retail sector. • Whirlpool Corporation expanded globally through investments, joint ventures, and acquisitions in the 1980s and early 1990s. • North America, including Mexico, accounts for about two-thirds of the company's revenues ($11 Billion): - North America (incl. Mexico): 2/3 (approximately $7.33 billion) - Rest of the world: 1/3 (approximately $3.67 billion)
  • 3.
    Whirlpool Organization Structure WhirlpoolCorporation's Senior Management Team • Chairman • President • Executive Vice Presidents (5 total): • EVP for North America • EVP for Europe • EVP for Latin America • Chief Financial Officer (CFO) • Chief Technology Officer (CTO) • Both CFO & CTO are responsible for product development and procurement. • Whirlpool Corporation established a Global Procurement Organization (GPO) in the mid-1990s to drive efficiency in product design and sourcing across the regions. GPO reports to the CTO. • The GPO manages critical commodities on a global basis while also collaborating with regional Procurement vice presidents, and the continuous pursuit of best practices to optimize procurement processes and achieve organizational objectives.
  • 4.
    Cost Modeling Approach Introducesa framework for cost modeling, to analyze and understand the cost drivers in Whirlpool's global procurement process. The framework categorizes these cost drivers into four specific categories: Design, Facility, Geography, and Operations. The case study emphasizes that different product categories may require different approaches to cost modeling. The specific factors and cost drivers within each category may vary depending on the product type and its manufacturing process. • Simple Transformation Processes (such as Metal Stampings, Injection Molding, and Packaging) • Raw materials (commodities) • Engineered Subsystems (like compressors, motors, and wiring harnesses). GROUP APPLICABLE PRODUCTS EXAMPLE DRIVERS LEVERS MODELING APPROACH Raw Materials Steel Resin Foam • Supply and Demand • Currency Rates • Product Mix • Standardization • Delivery Mode • Source Macro-Economic/ Trend Analysis Simple Transformation Processes/ Components Metal Stamping Injection Molding Packaging • Regional Wage Rates • Process Technology • Lean Manufacturing • Supplier Productivity • Supplier Margin • Capacity Utilization Bottoms -Up Part Number Cost Model Engineered Subsystems Compressors Motors Wiring Harnesses • Functionality • Volume • Quality • Design Spec • Modularity • Scale Parametric Comparison
  • 5.
    Bottoms-Up Models 1 • Abottom-up cost model is a method of estimating the cost of a project or product by identifying and adding up the costs of each individual component or activity required to complete the project or product. • Cost of each component or activity is estimated separately, based on factors such as material costs, labor costs, and overhead costs. The individual costs are then aggregated to arrive at the total cost of the project or product. • A Bottom-up Cost model provides a more detailed and accurate cost estimate. Macro-economic analysis 2 • Macro-economic analysis is a comprehensive evaluation of an economy's performance using various economic indicators. • Macro-economic analysis involves examining broader economic indicators, GDP, market trends, and factors such as inflation, interest rates, and exchange rates that can impact the prices and availability of raw materials, supply & demand. • By analyzing these factors, companies can gain insights into the potential fluctuations in raw material prices and make informed decisions accordingly.
  • 6.
    Multivariate Regression Analysis 3 •It is a statistical technique used to identify the relationship between multiple variables and a specific outcome. • It can be used to identify the key factors that contribute to the cost of a complex product such as a motor, compressors • Analyzing the relationship between variables such as raw material costs, labor costs, and production volumes, it is possible to quantify the impact of each variable on the overall cost of the product. • Using Multivariate Regression analysis it becomes possible to identify areas where cost savings can be achieved. For example, a better understanding of the key cost drivers may enable procurement teams to negotiate better prices with suppliers or to identify opportunities for process optimization or product redesign.
  • 7.
    Parametric Comparison • A"Parametric Comparison" involves comparing the performance and cost of similar products across different regions, while controlling for differences in product specifications and other factors that may impact performance. • In this case study, the goal is to use regression analysis to identify the key factors that impact the cost and performance of compressors and to compare these factors across different regions. • To conduct a meaningful analysis of compressors using regression analysis, it is necessary to have a good understanding of the product and the factors that impact its performance and cost. This may involve consulting with subject matter experts or having a deeper understanding of the product and the market. • They hypothesize various key parameters such as size, cooling capacity, and energy efficiency, related to the compressor. The size and capacity of the compressor may impact its manufacturing cost as larger compressors may require bigger and heavier parts. They suggest that larger compressors may cost more to make and, consequently, be priced higher. • They imagine that larger compressors with higher cooling capacities may be priced higher due to their value to consumers, and energy efficiency adds to the value proposition. However, further analysis is required to determine the specific impact of these parameters on manufacturing cost and pricing.
  • 8.
    Economy of Scale •One of the participants also suggests that the annual purchase (number of units purchased within a given time frame) might have an impact on costs. • Others explain that higher unit volumes tend to result in lower costs per unit due to economies of scale. Economies of scale refer to cost advantages that arise from increased production or operational efficiencies when producing larger quantities. • This is because higher volumes allow for the amortization of one-time costs (e.g., product design) and batch costs (e.g., machine setups) over a greater number of units. As a result, the cost per unit decreases, leading to potential cost savings. • It clarifies that while the economy of scale is related to cost reductions, it is more closely associated with facility capacity (the ability of production facilities) rather than volume at an individual SKU (Stock Keeping Unit) level. The capacity of the production facilities to handle larger volumes efficiently and effectively contributes to achieving economies of scale. Conclusion: Higher unit volumes tend to result in lower costs per unit due to economies of scale. By producing larger quantities, one-time and batch costs can be spread over more units, leading to cost savings. Economy of scale, although related to volume, primarily pertains to the capacity of production facilities to handle larger volumes efficiently.
  • 9.
    Study on CostComparison of Injection-Molded Parts • Collected data for comparison of prices of injection-molded parts between Europe and North America. • Collected detailed supplier data comparing the costs of producing six identical parts in Europe and North America to figure out the reasons behind the changes in prices and understand the expenses involved in making injection-molded parts in Europe and North America. • Identify the key factors driving the cost differences between Europe and North America. • Considering a framework based on four categories of cost drivers: Design, Facility, Geography, and Operations. a. Design: This category recognizes that different design concepts can result in varying costs, even if the functionality of the products remains the same. For example, using reciprocating compressors versus scroll compressors may have different cost implications. b. Facility: The facility category considers the cost drivers related to the production facilities themselves. Factors such as facility size, equipment, automation, and capacity utilization can impact costs. c. Geography: The geography category takes into account location-specific factors that influence costs, such as labor rates, raw material availability, transportation costs, and regulatory requirements. d. Operations: The operations category includes cost drivers associated with the manufacturing process and operations management. This can involve factors like production efficiency, waste reduction, quality control, and supply chain management. • This framework is also applicable to compressors. It can help in identifying and analyzing the key cost drivers for compressors, considering factors related to design, facility, geography, and operations. - Cost drivers: factors that affect the cost of a product or service. - Capacity utilization: the degree to which a production facility is being used to produce goods or services.
  • 10.
    • Regression analysisshows a relationship between variables but does not prove cause and effect. • Parametric analysis will be used to determine if a difference exists between regions. • Design is not a factor in comparing plastic parts. Other factors affecting cost may be Geography, Facility & Operation. • By considering these categories, a comprehensive analysis of cost drivers can be conducted. • By analyzing utilization levels and productivity differences, a more comprehensive understanding of cost variations can be gained. • By addressing these factors, a clearer picture of the cost differences between regions can be obtained. • The objectives of the analysis include demonstrating the power of cost modeling, showcasing different techniques for different product categories, and identifying evidence of regional performance differences or opportunities for sharing insights. • Cost models are tools that can drive sourcing strategies. • Cost models can help identify geographic cost drivers, such as comparing cost savings from low-factor cost countries to the high transportation costs associated with sourcing from those regions. • Cost models can also be used in negotiations, although other factors like industry structure and competitive tension also play a role. Discussion Points
  • 11.
    Conclusion It concludes witha discussion about the application of cost models, including driving sourcing strategies, using them in negotiations, and sharing insights and learning across regions within Whirlpool Corporation.

Editor's Notes

  • #12 In Slide Show mode, select the arrows to visit links.