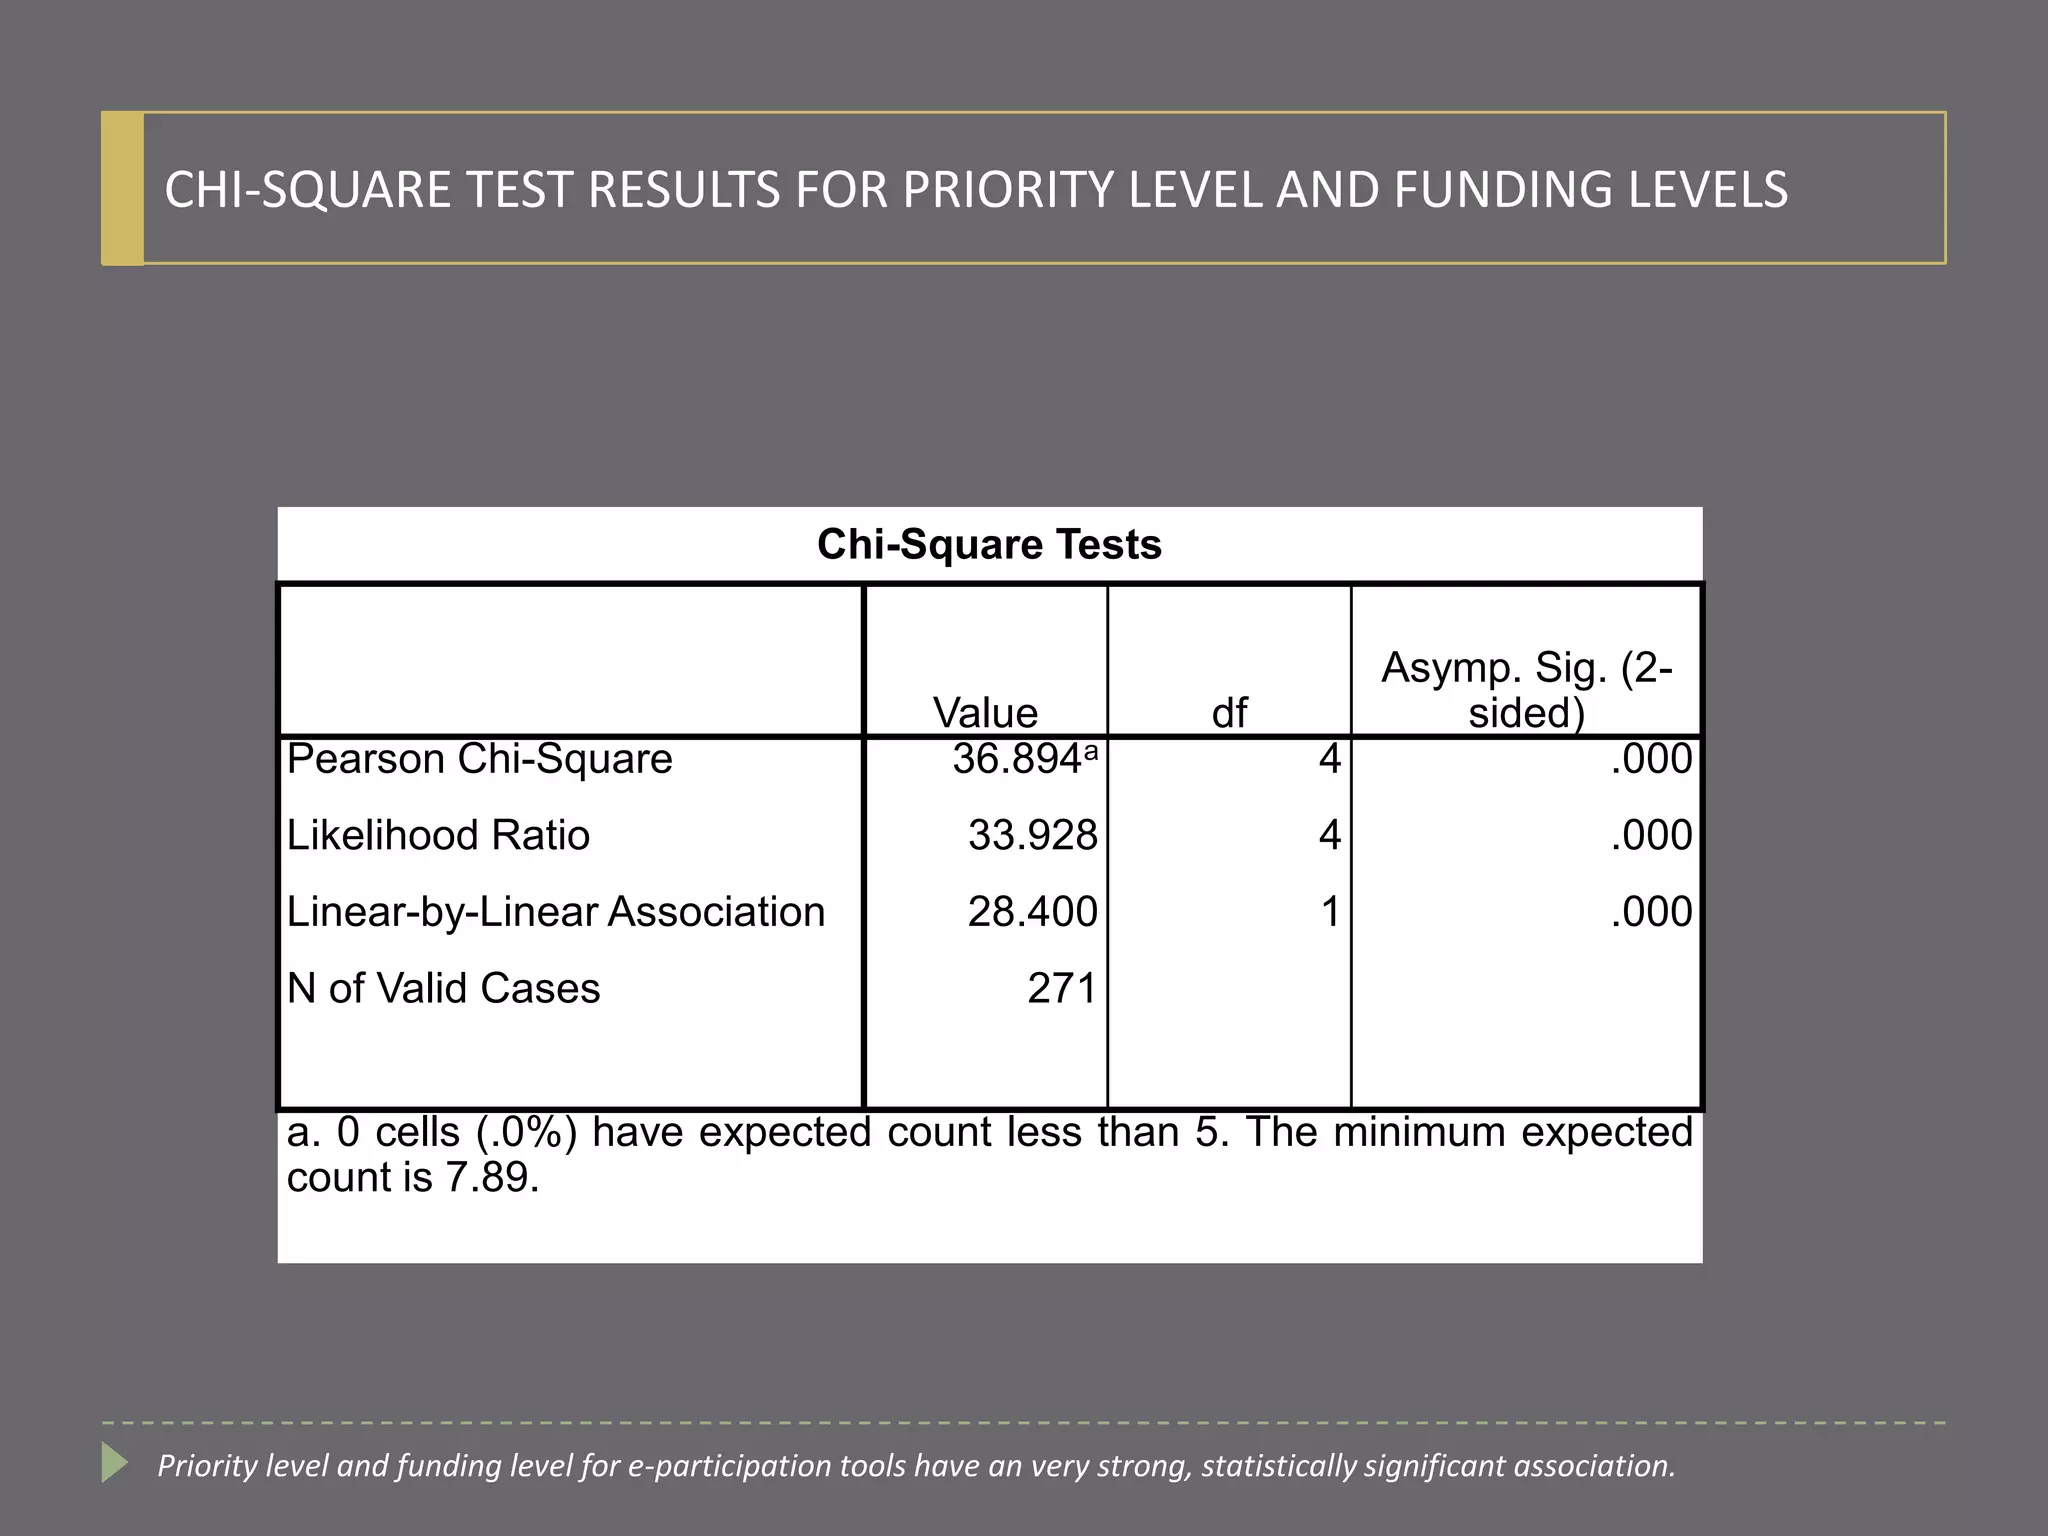
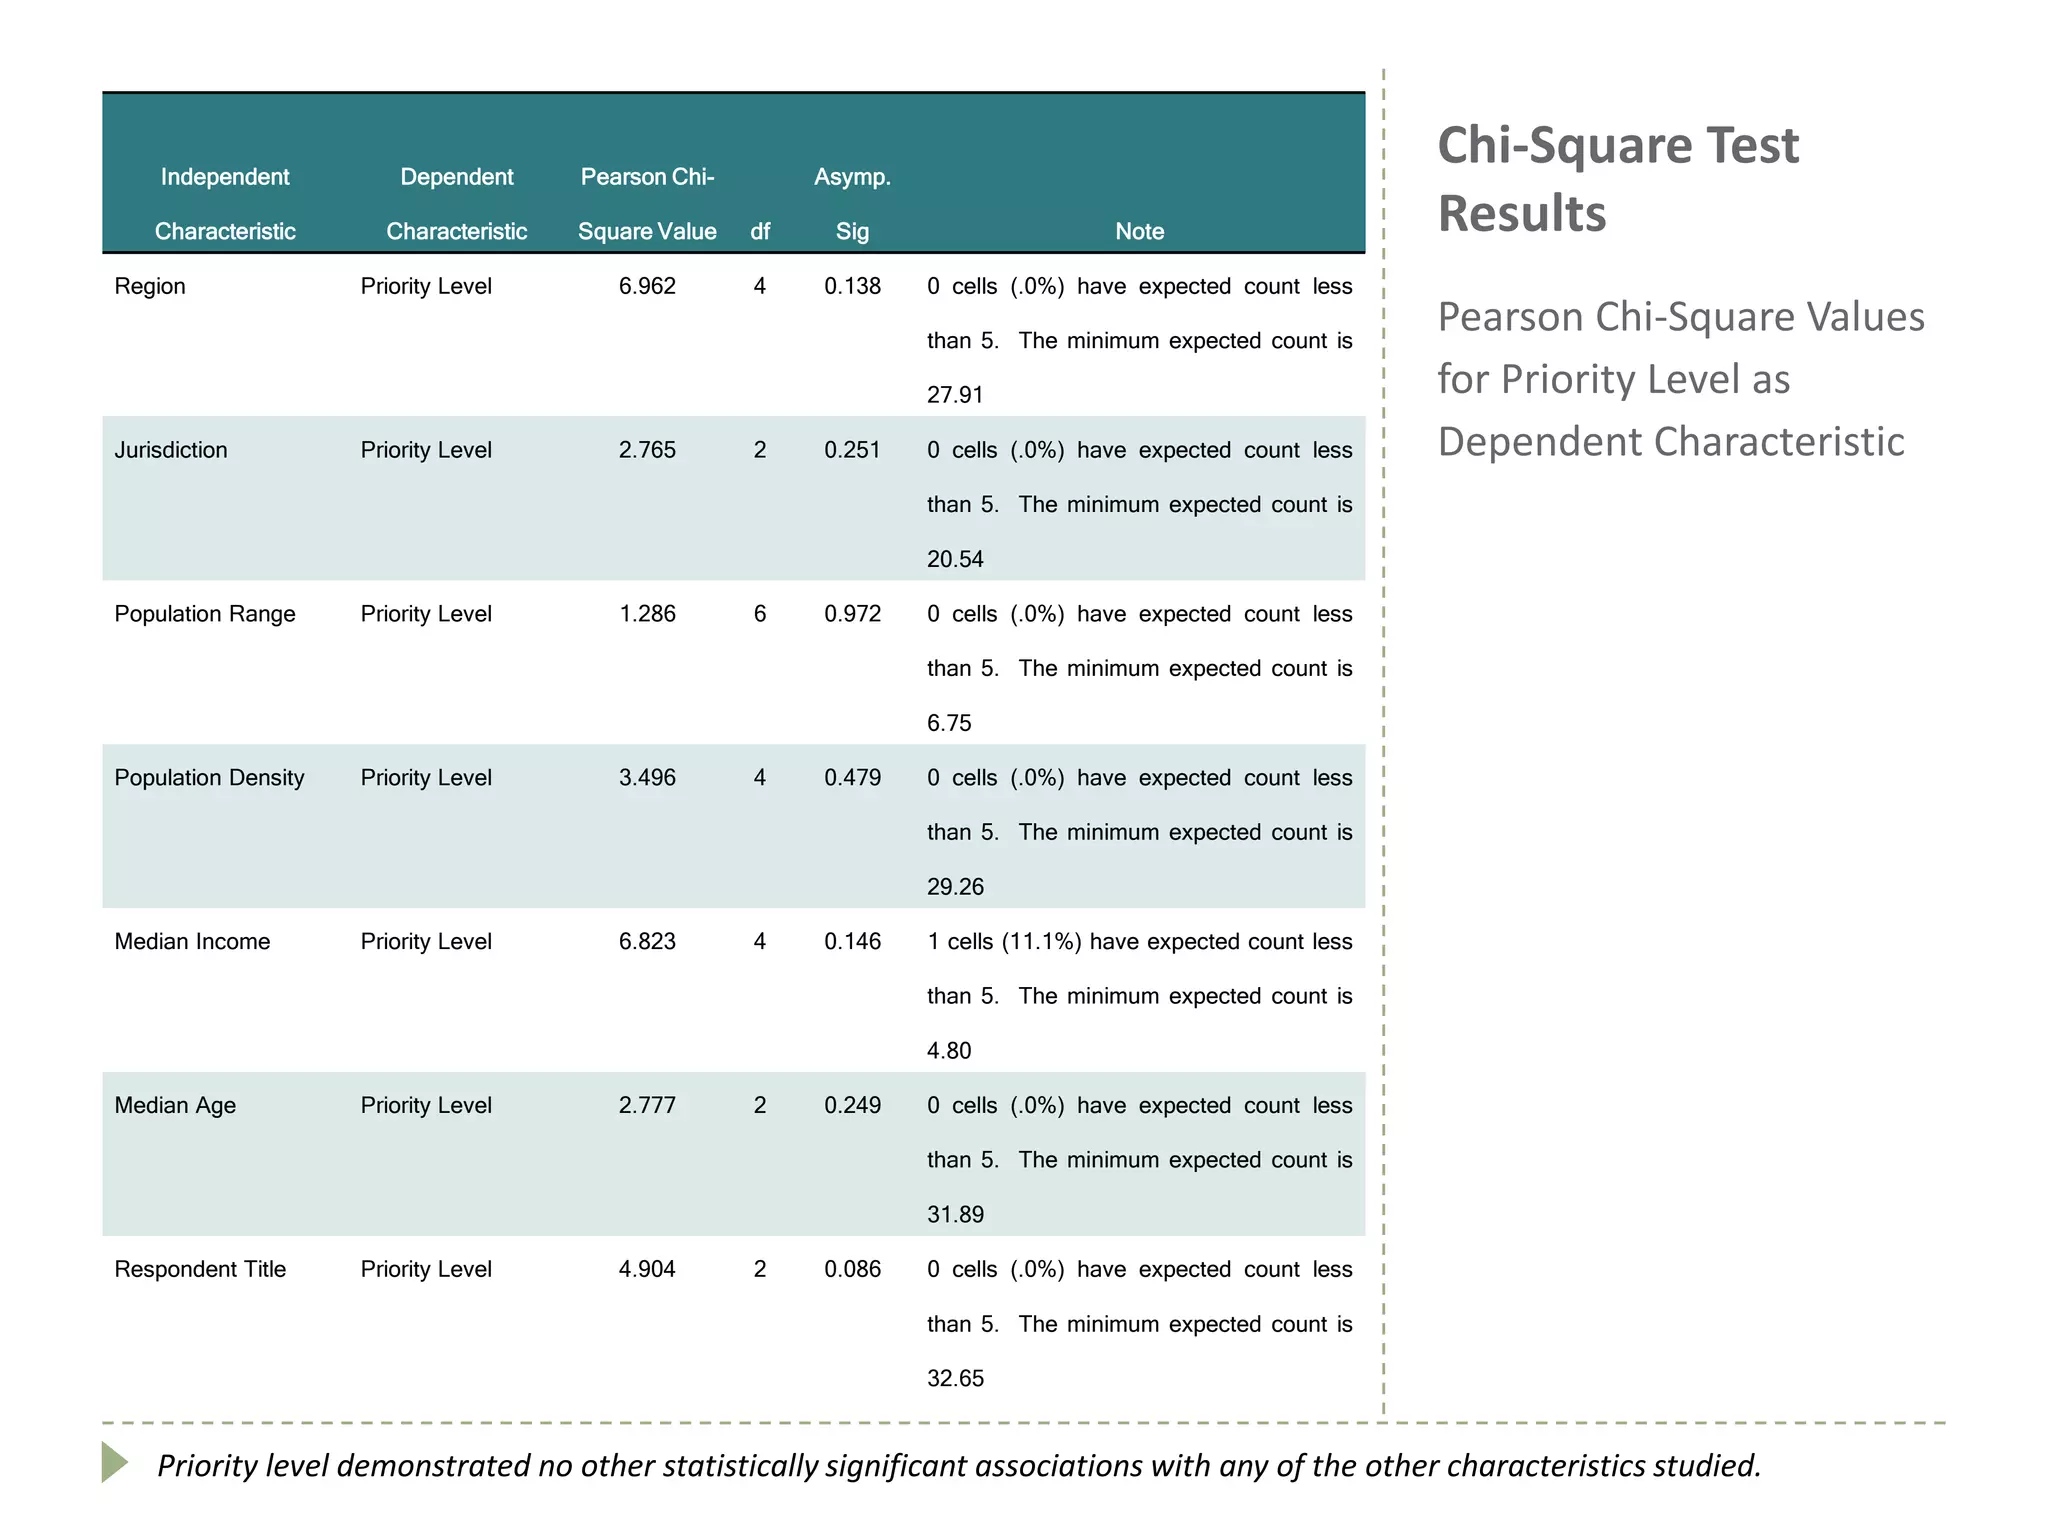
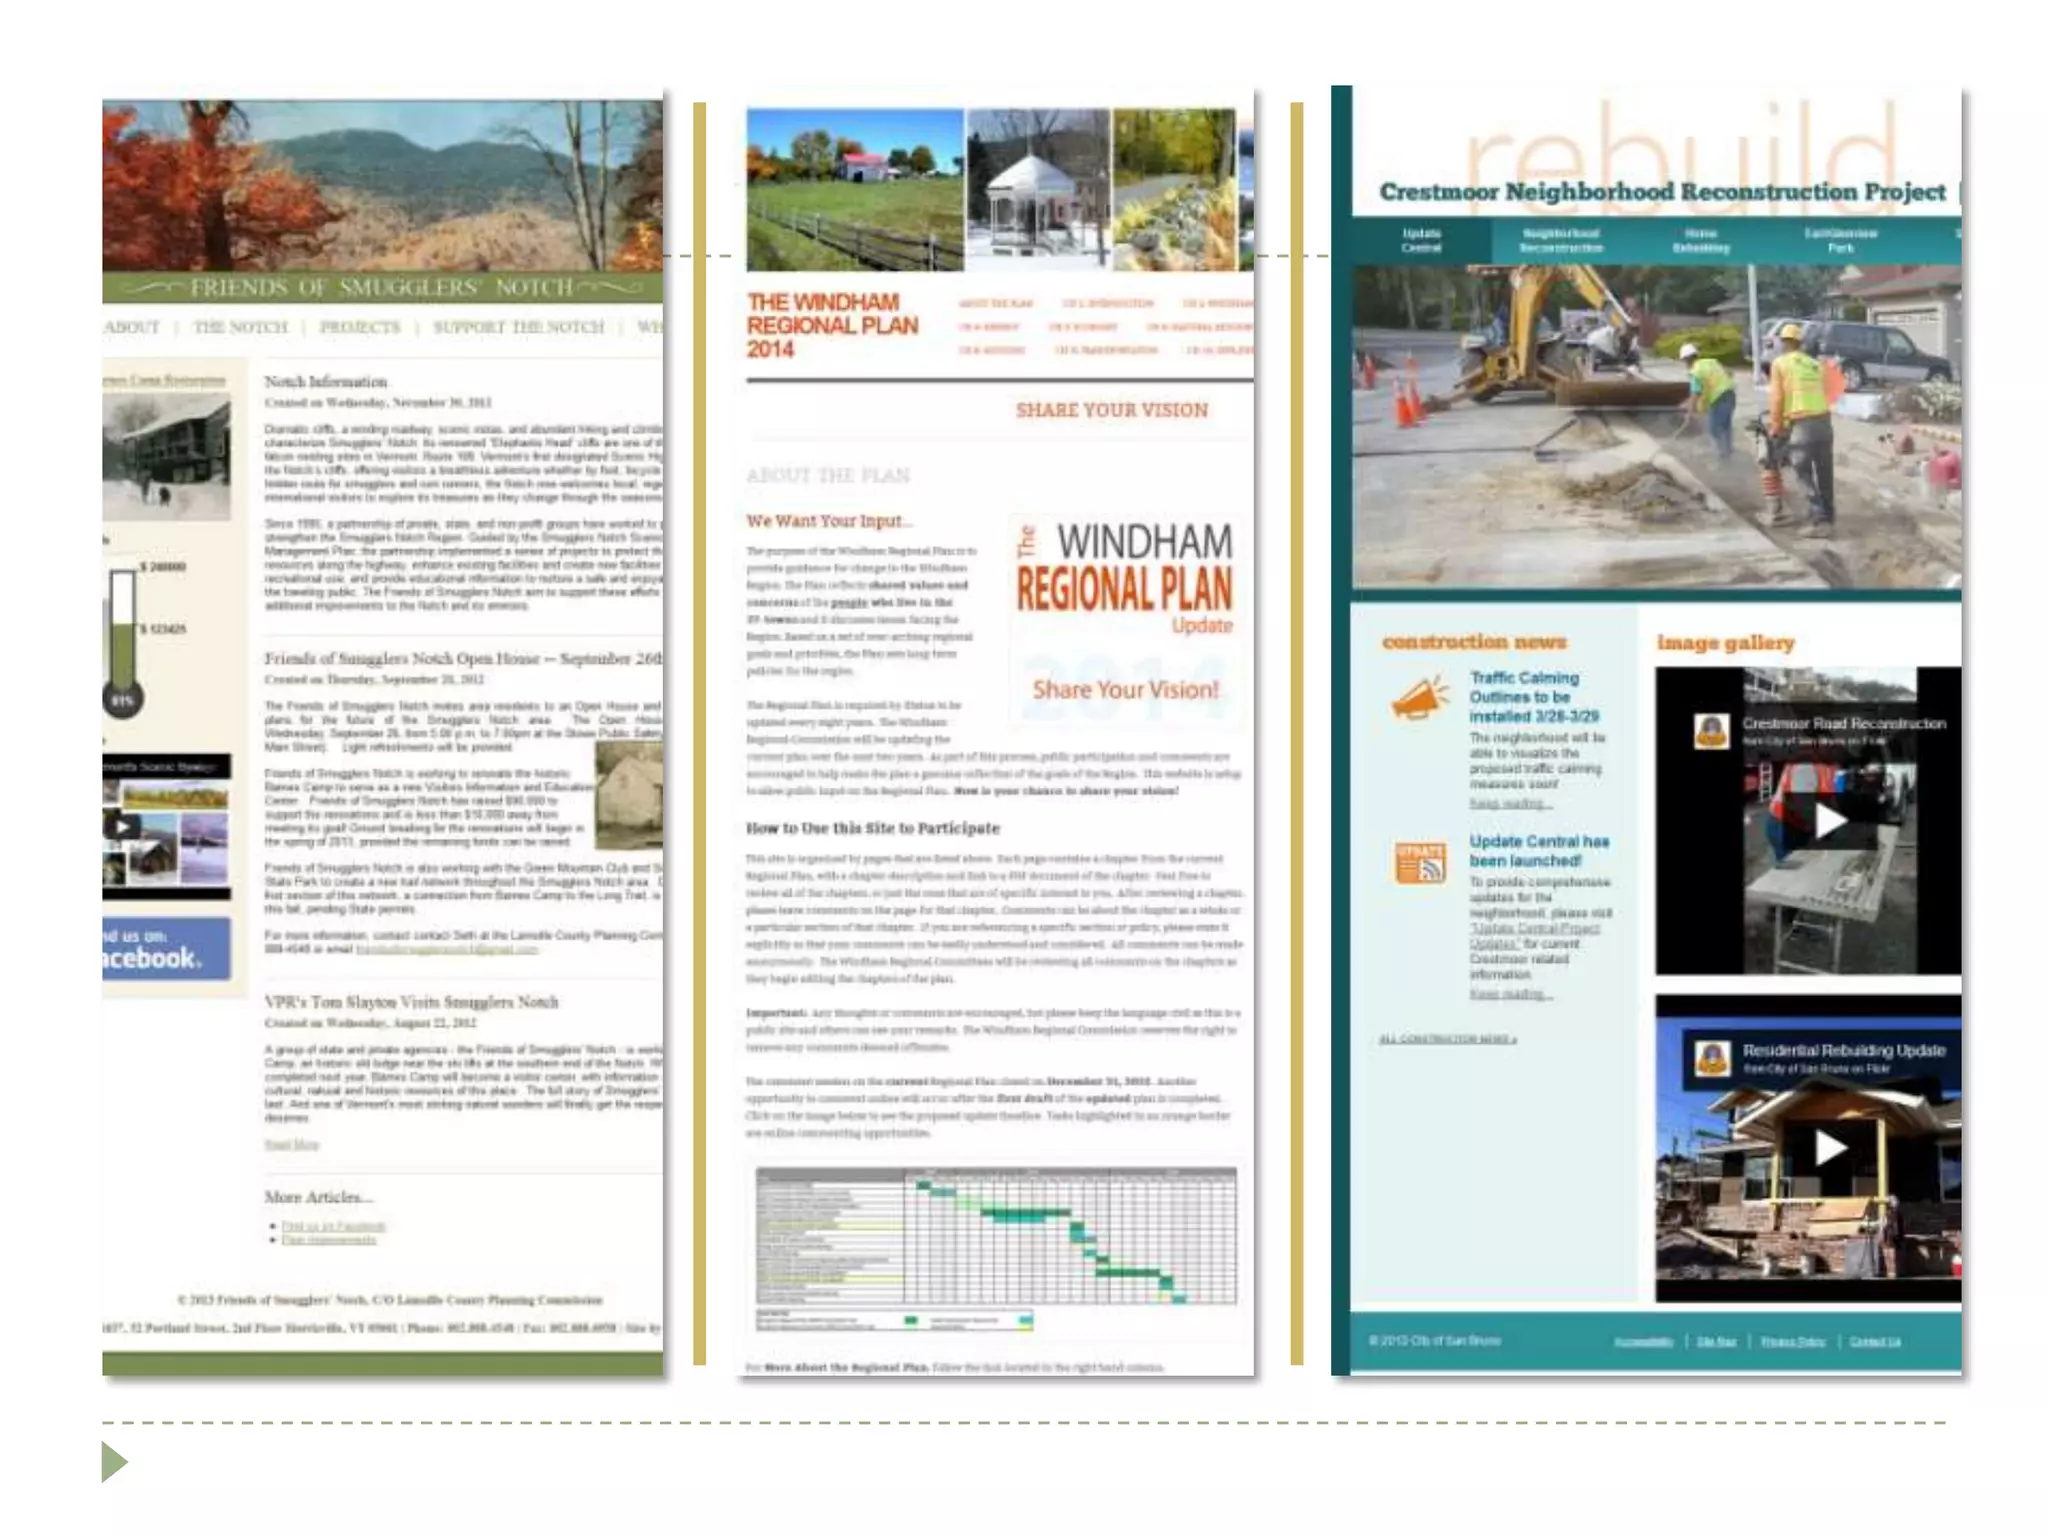
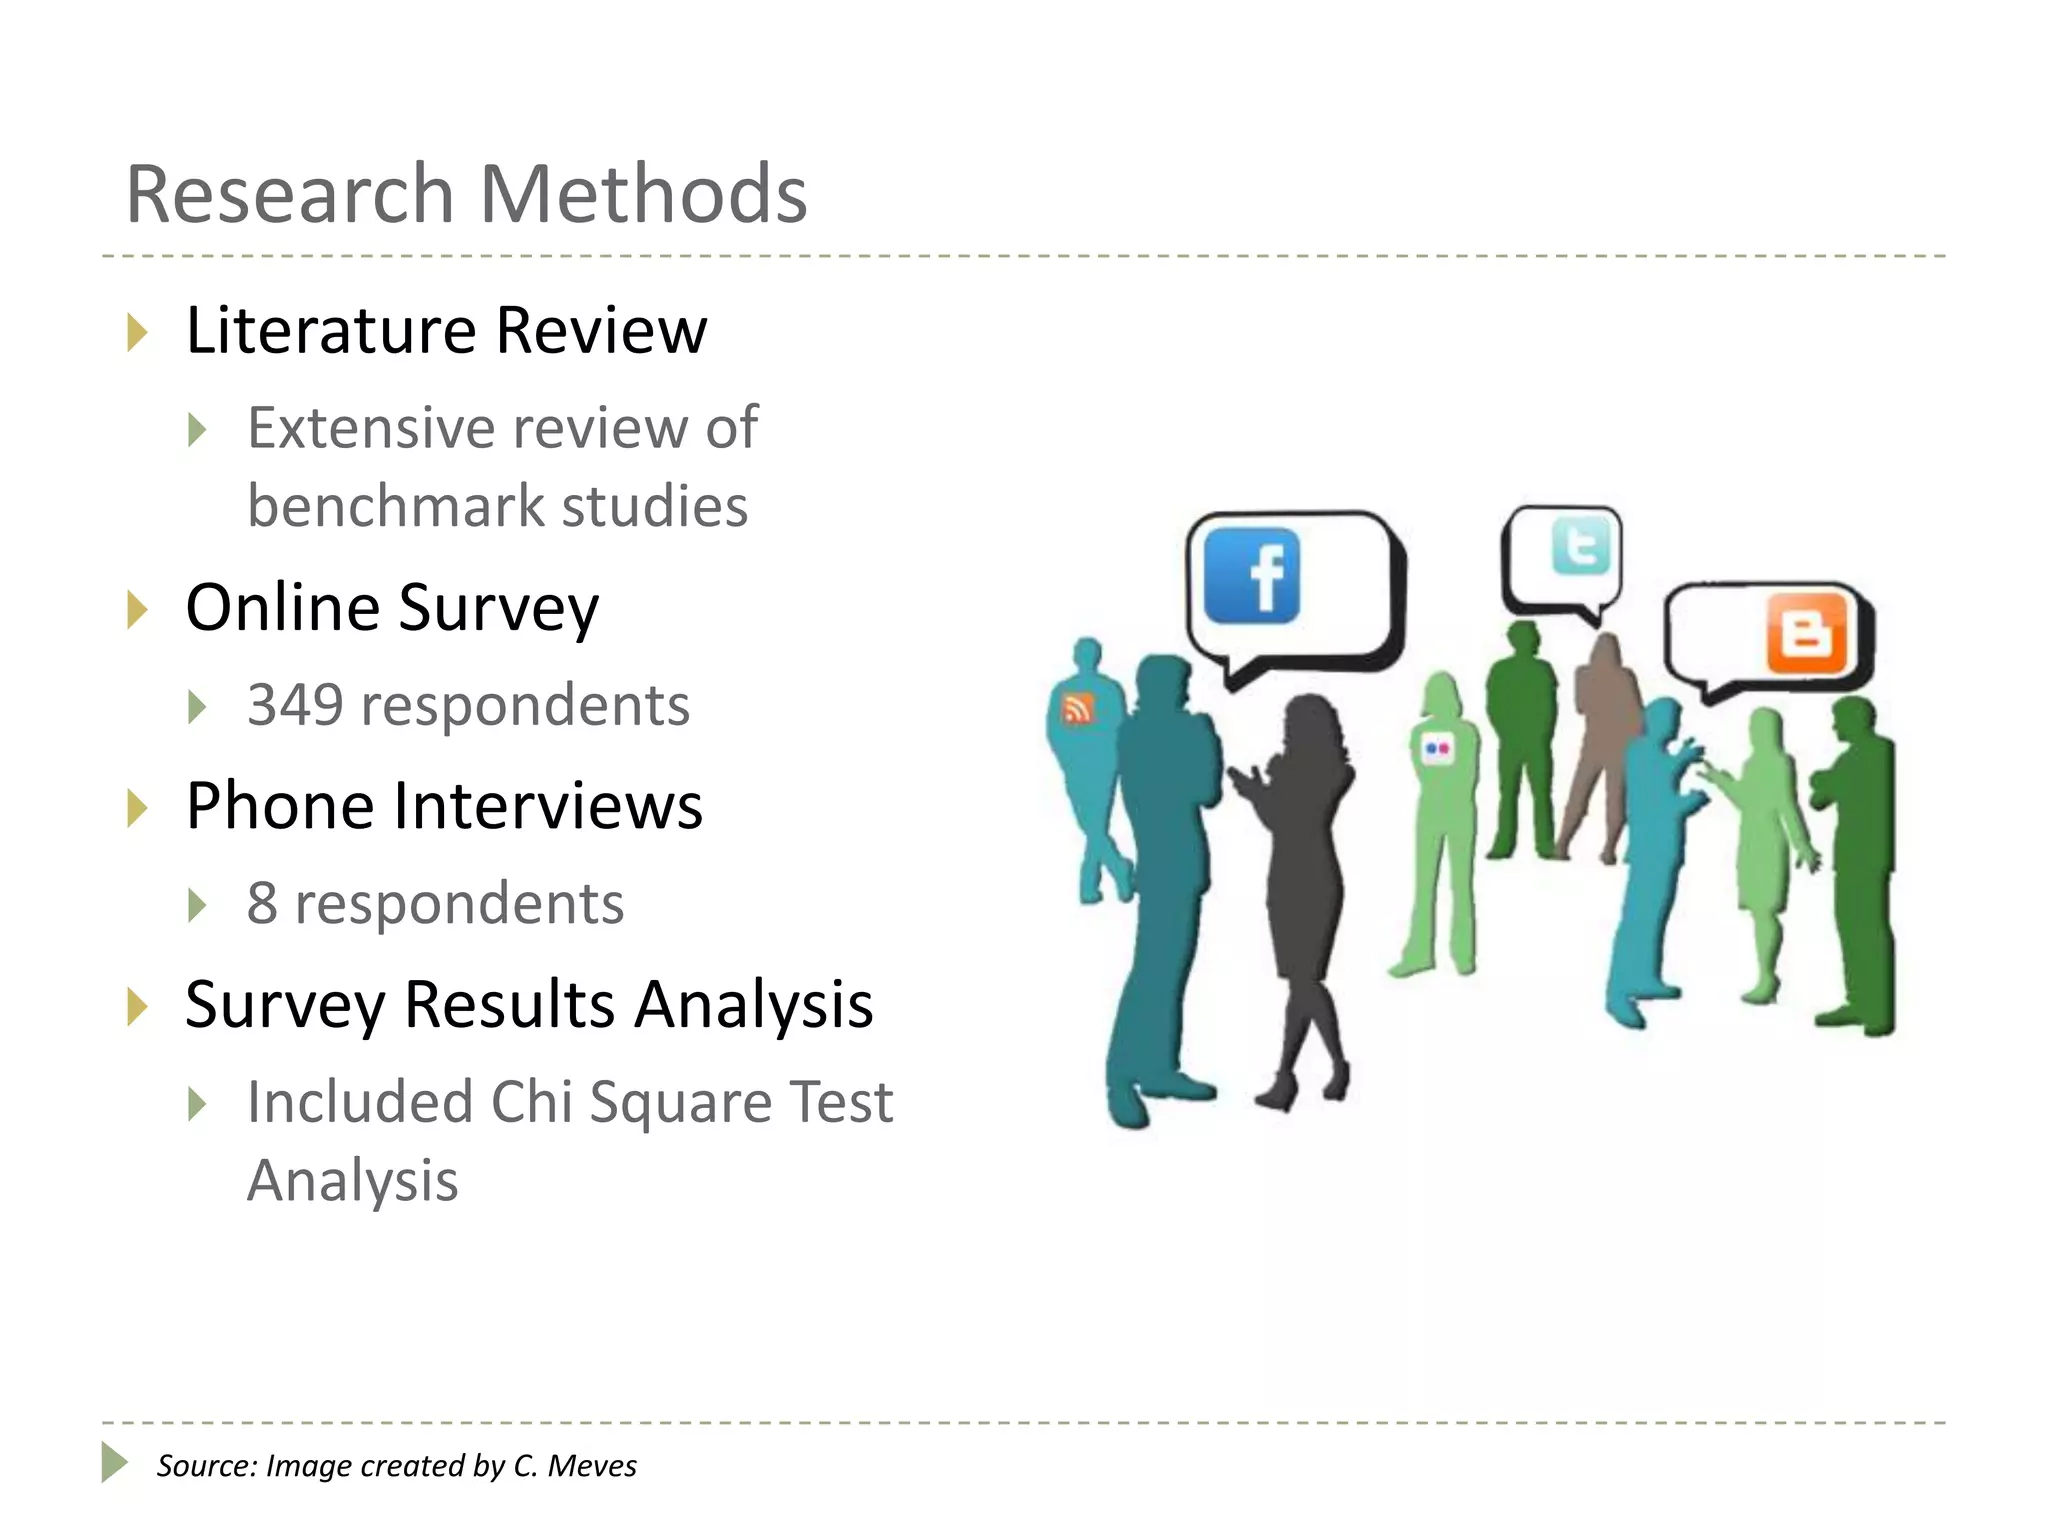
The document analyzes barriers to the adoption of web-based e-participation tools in planning departments serving smaller populations, identifying key issues such as limited budgets, staff time, and training. It includes a benchmarking study based on surveys of 349 respondents and interviews that reveal low usage rates of e-participation methods and the importance of public engagement. Overall, the study suggests that improvements in user experience could reduce some barriers and facilitate more effective public participation.

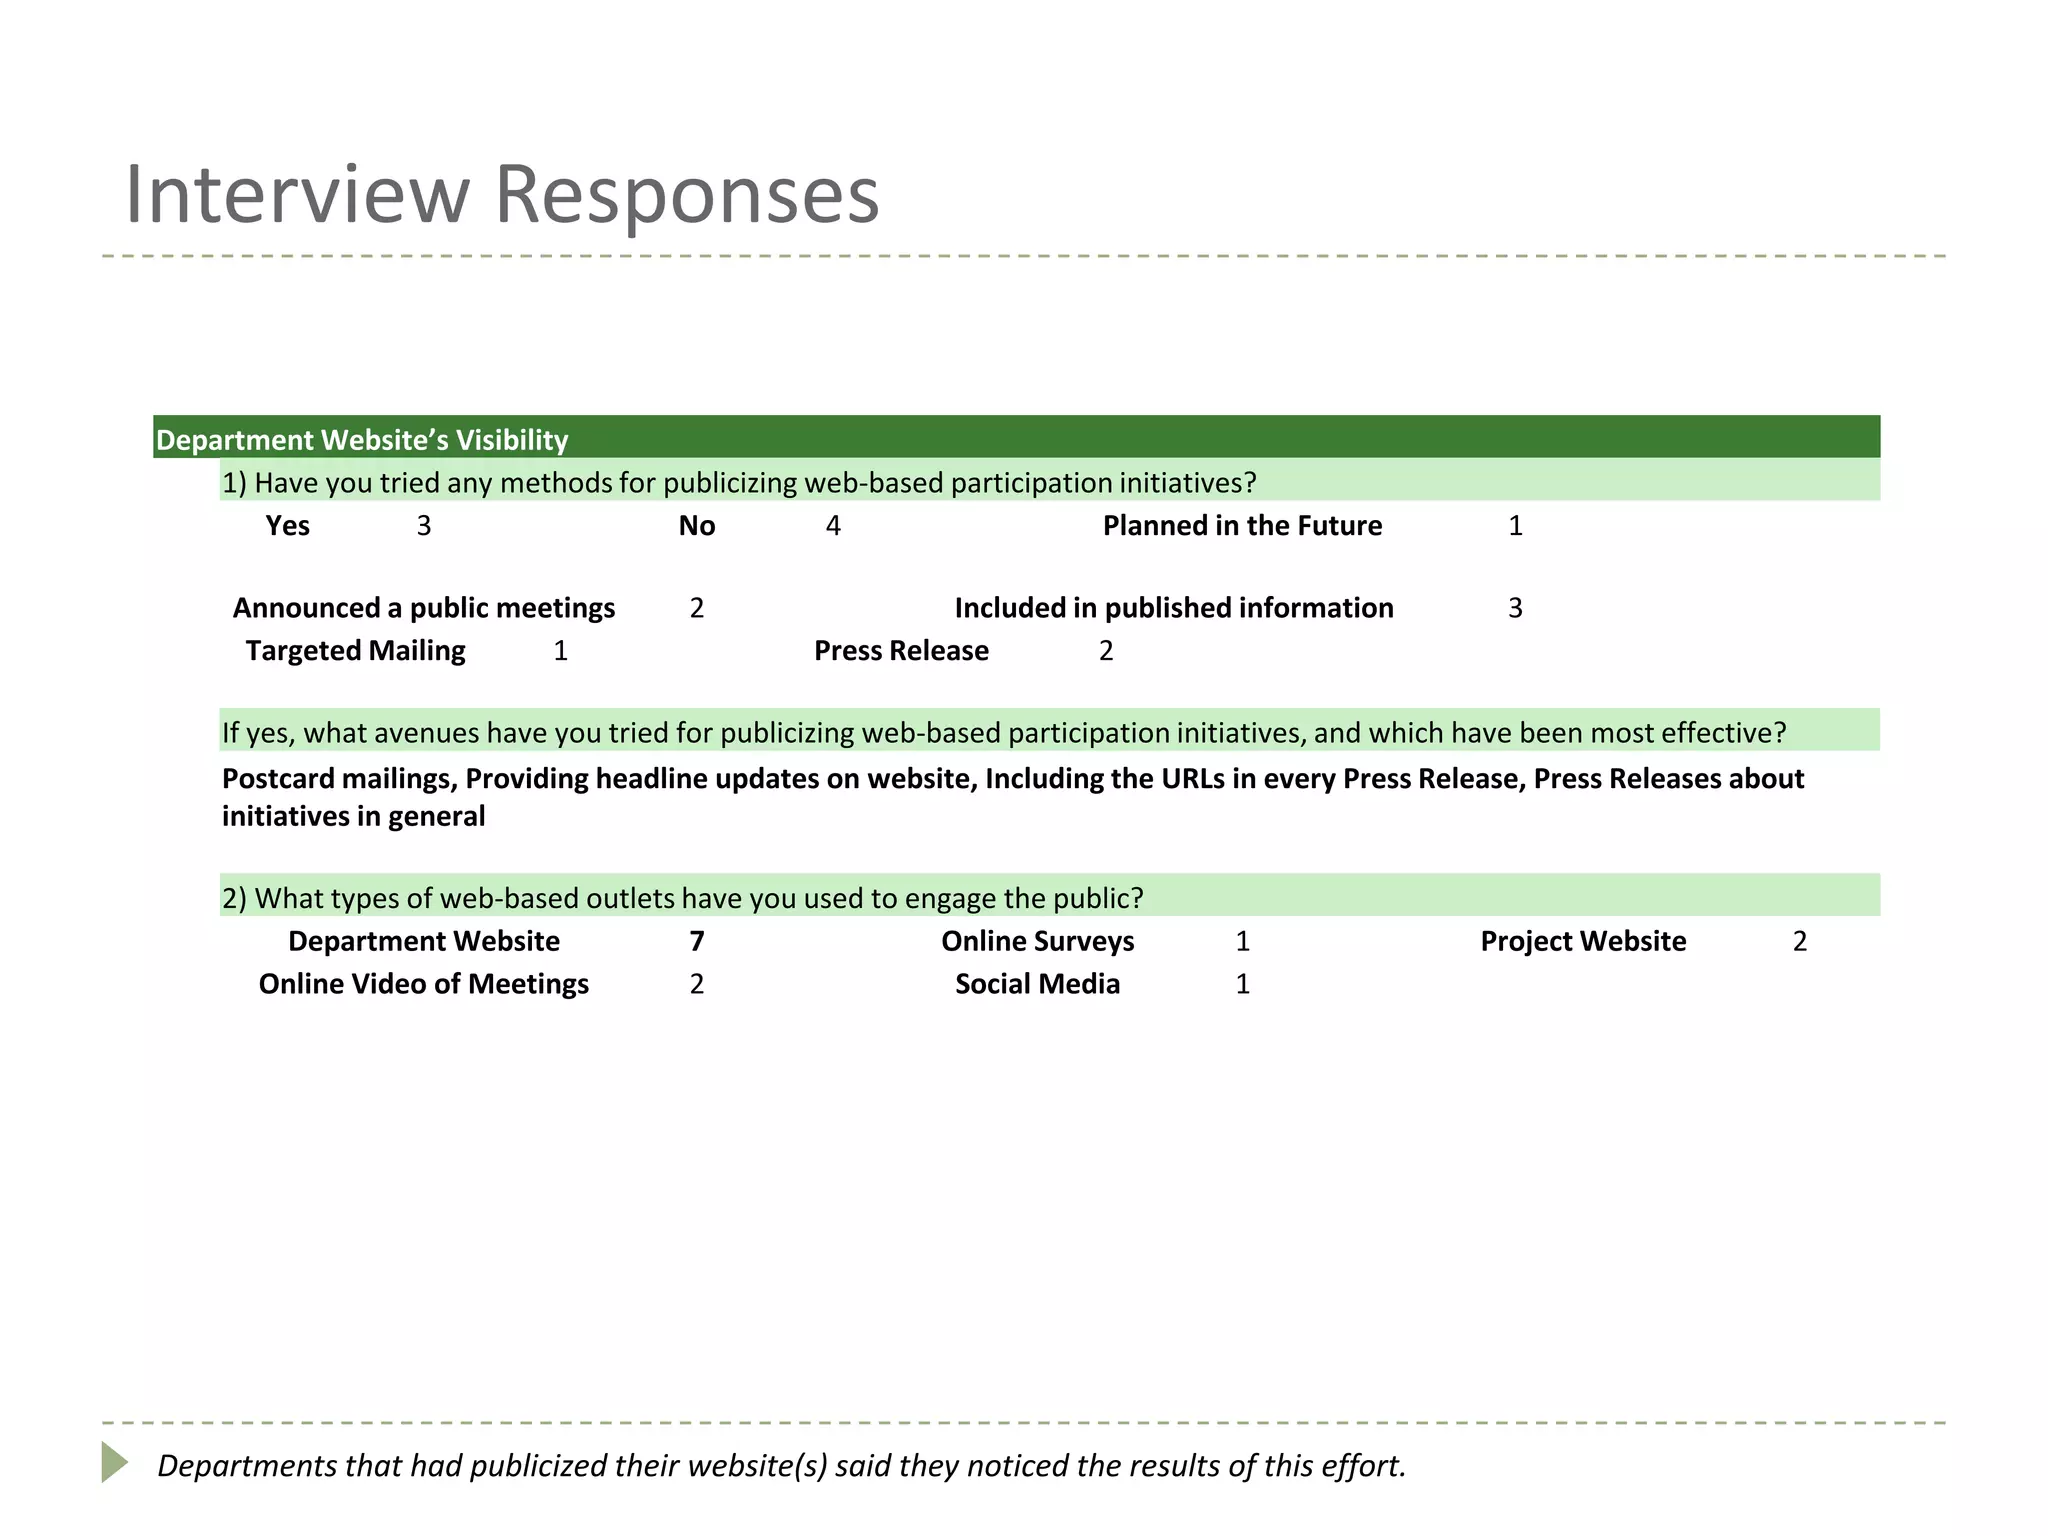
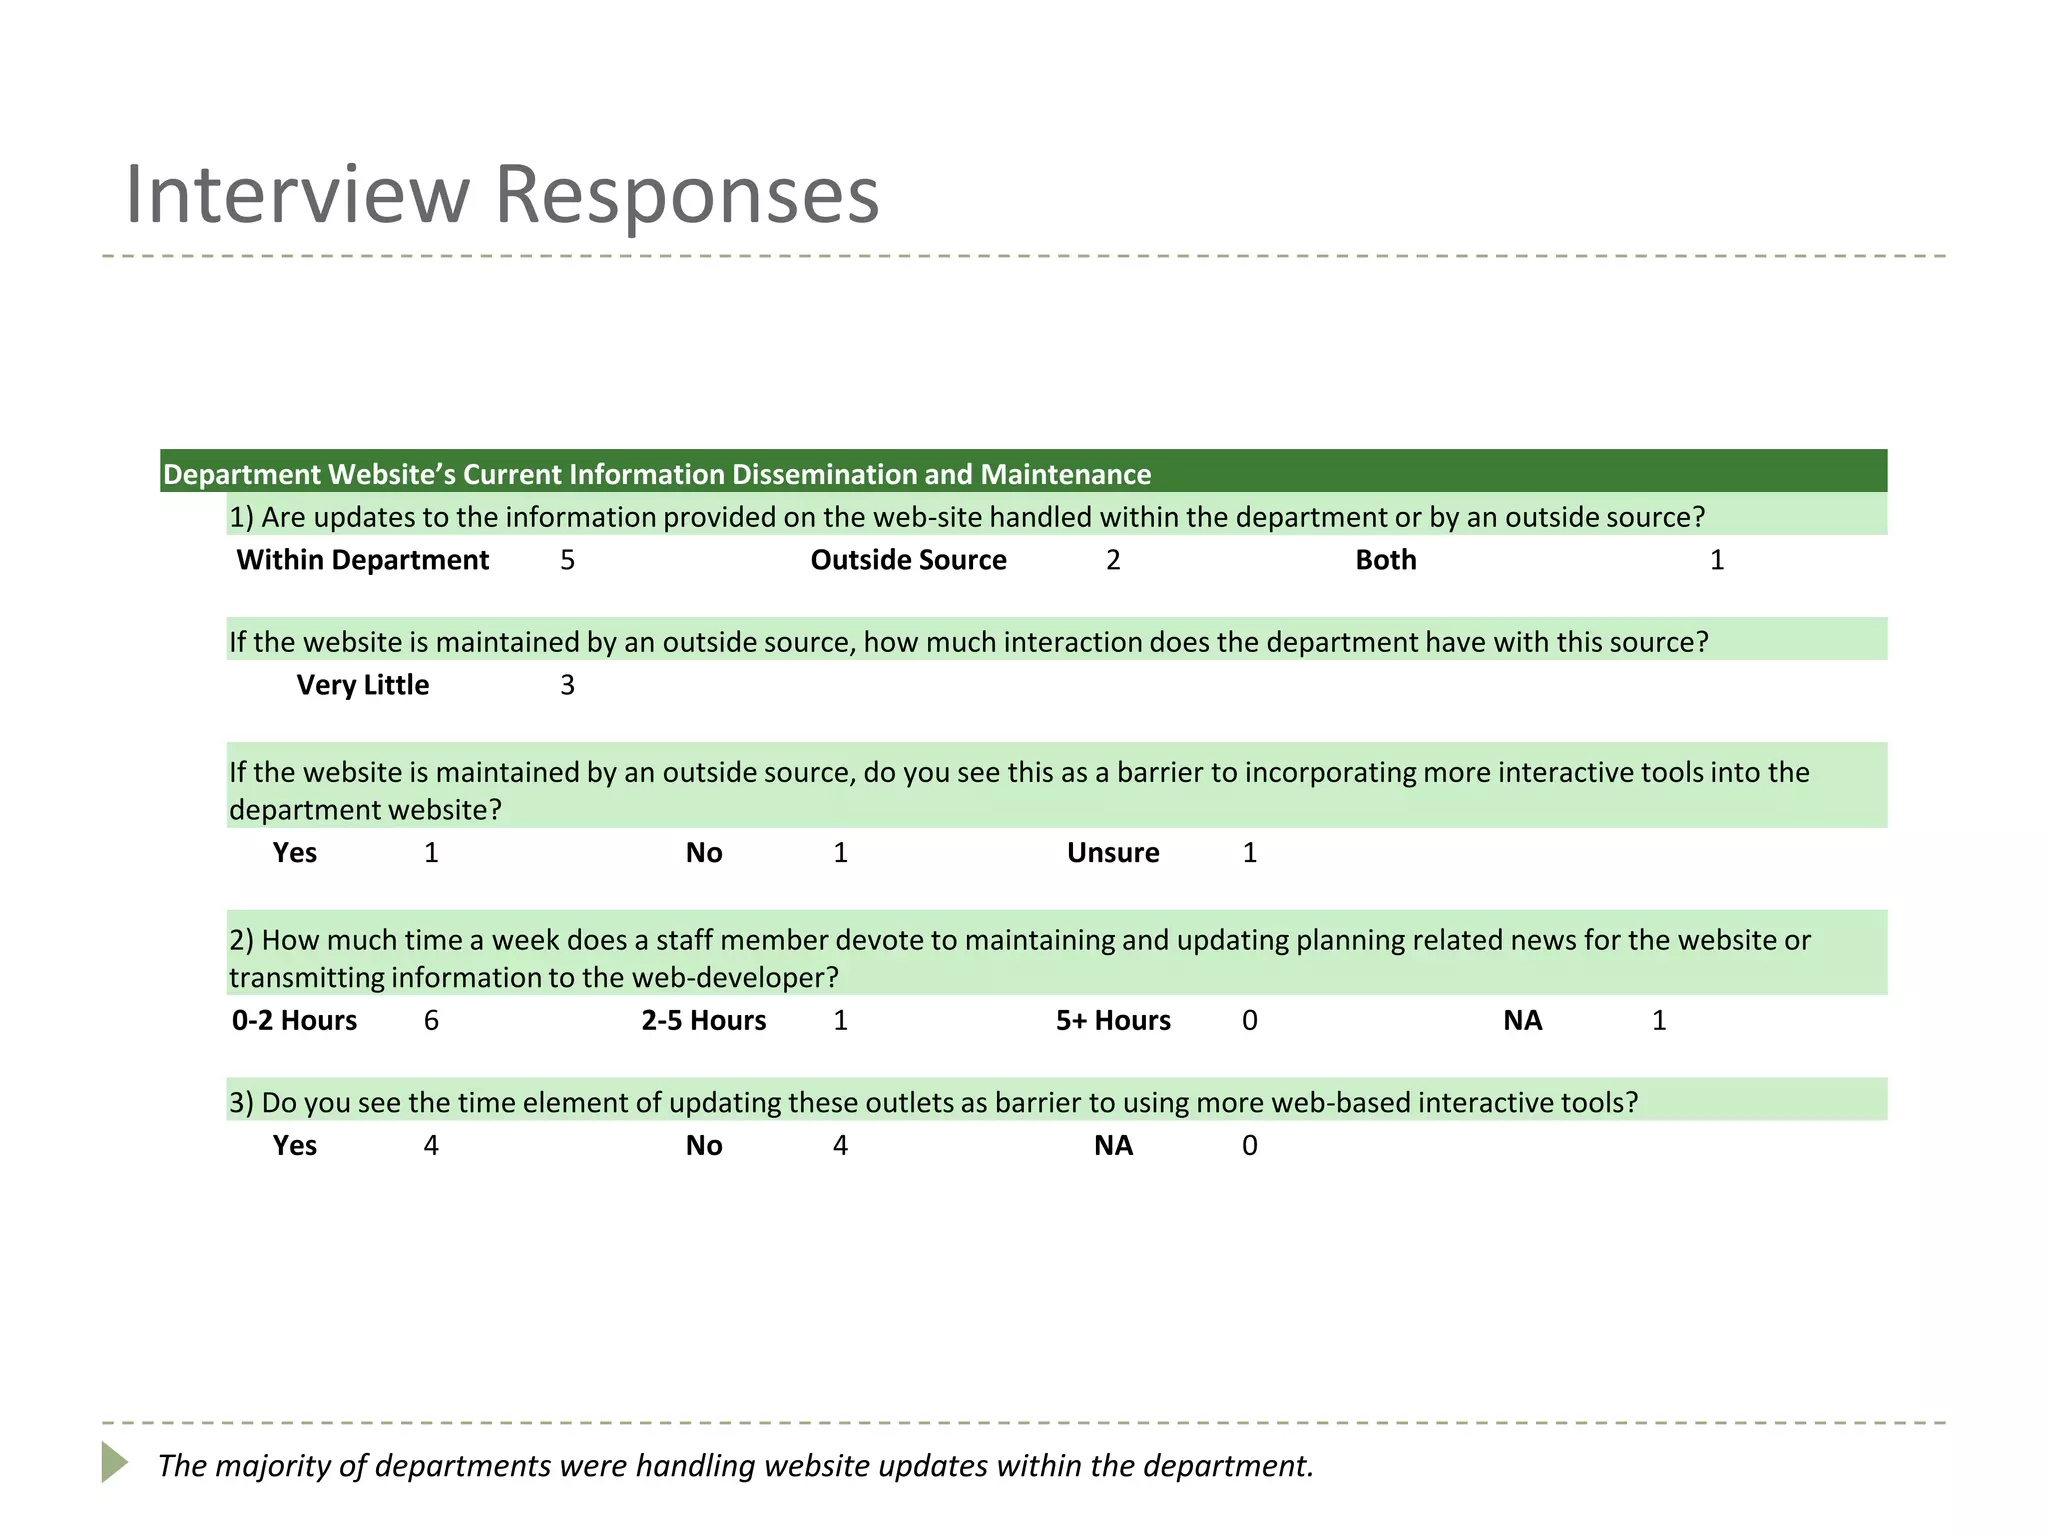
![Interview Responses
External Barriers to Web-based Interactive Tools
1) According to the Pew Research Center Study on Online Government conducted in 2009, “Two in five home broadband users
(39%) prefer online contact when trying to reach government, compared with 23% of home dial-up users.”[1] Do you know how
many residents within your community have broadband access?
50% or Greater 2 Less than 50% 3 Do not know 3
Do you see this as a limiting factor for engaging the public through online tools?
Yes 6 No 2
2) Are there language or disability barriers for residents using the tools on the department’s website?
Language Barriers Disability Barriers
Yes 7 No 1 Yes 0 No 4
Do not know 0 Do not know 4
3) Have you encountered learning curve issues for individuals wishing to use available interactive tools?
Yes 6 No 2 Do not know
Note: Most departments made reference to the fact that their population consisted of a large elderly population when
discussing learning curve issues of interactive tools.](https://image.slidesharecdn.com/wheresthedisconnect-130624203505-phpapp01/75/Where-s-the-disconnect-Analyzing-barriers-to-web-based-e-participation-tools-for-planning-22-2048.jpg)