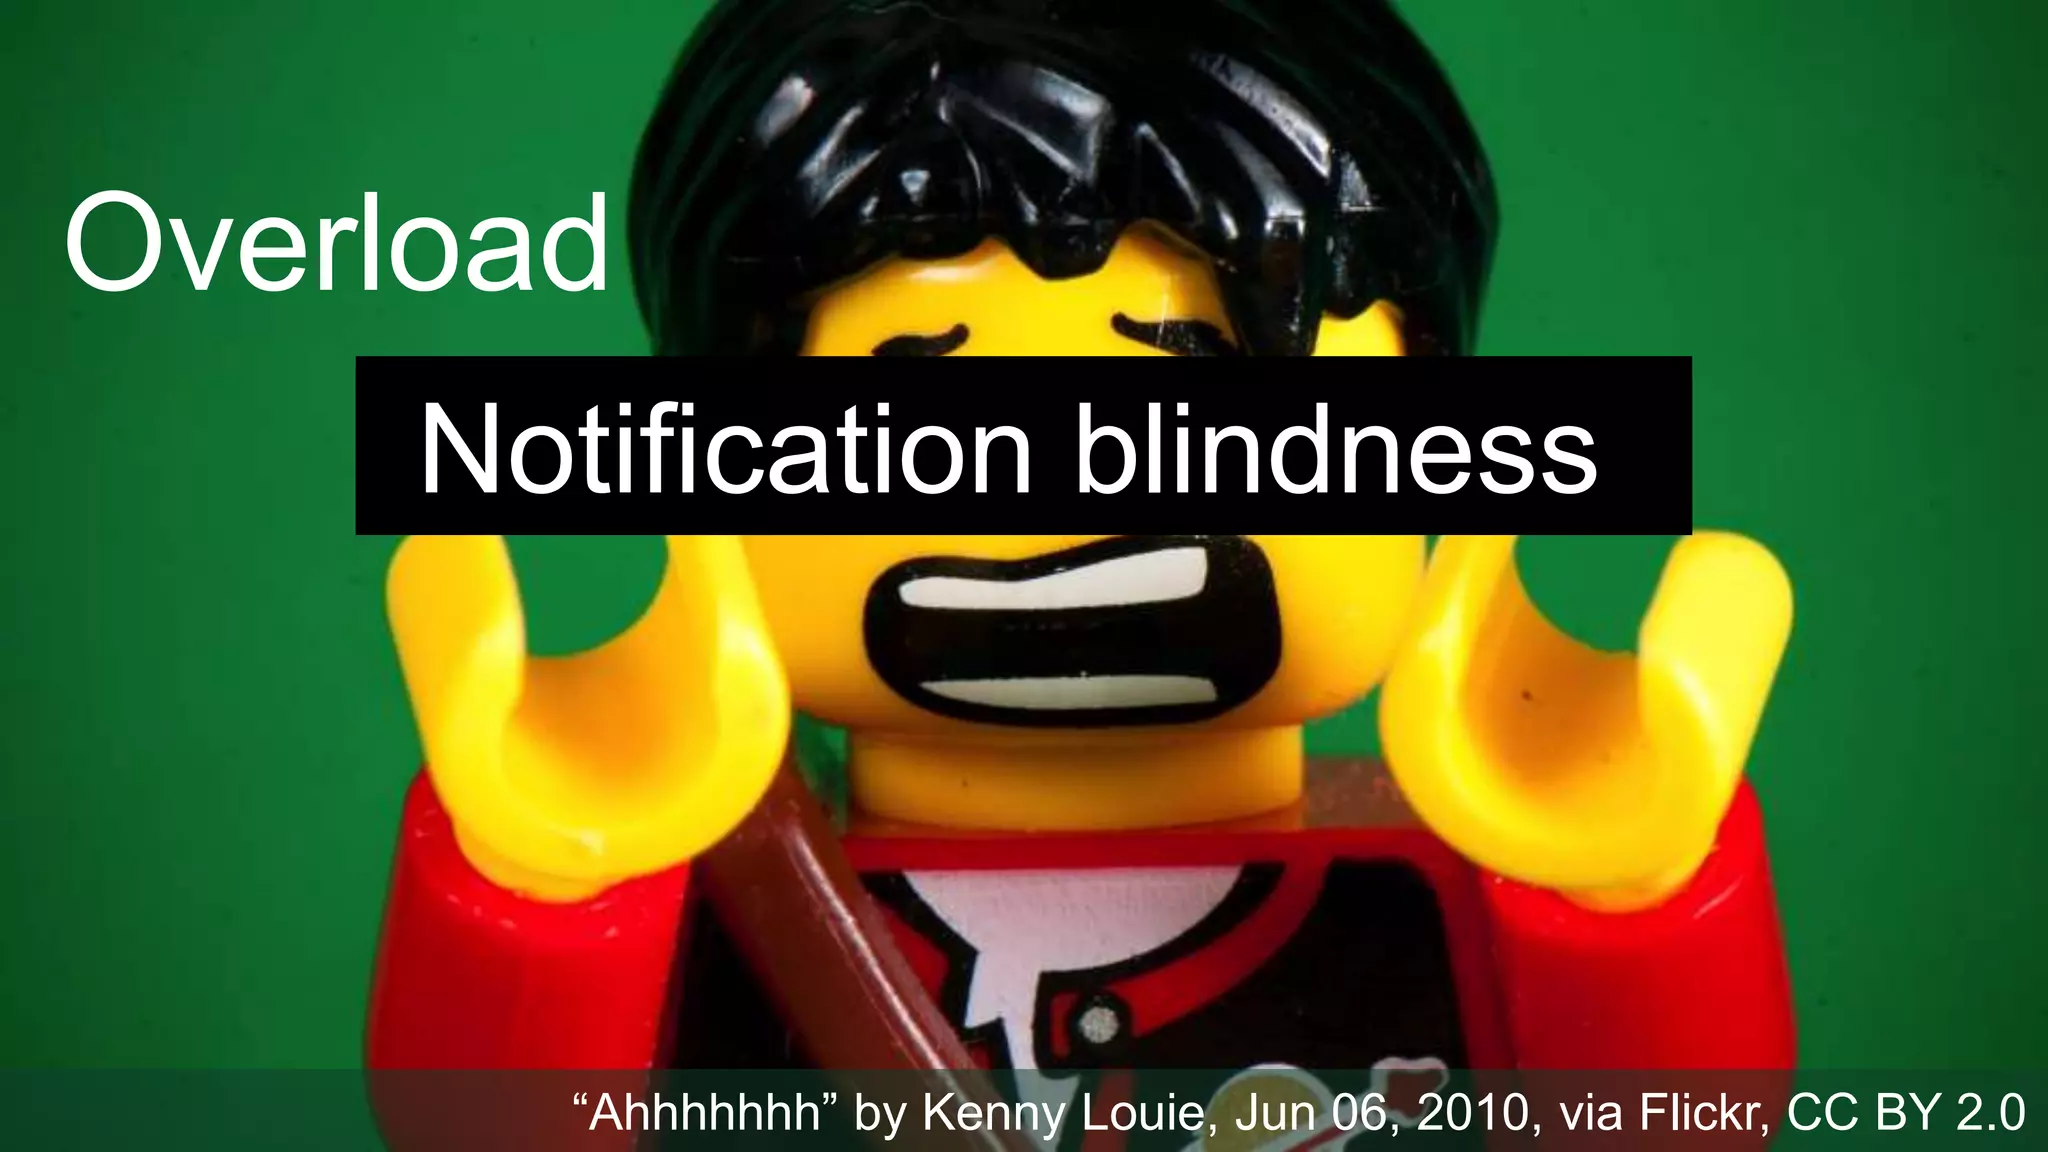
Downloaded 23 times

![‚Attention is a limited resource—a person
has only so much of it ‘
[Matthew B. Crawford]
Attention Economy: treating human
attention as a scarce commodity
[Davenport and Beck, 2001]
times square night 2013. chensiyuan. Apr 16, 2013 via Wikipedia. CC BY-SA 4.0](https://image.slidesharecdn.com/whenattentionisnotscarce-slideshare-150911050439-lva1-app6892/75/When-Attention-is-not-Scarce-Detecting-Boredom-from-Mobile-Phone-Usage-8-2048.jpg)

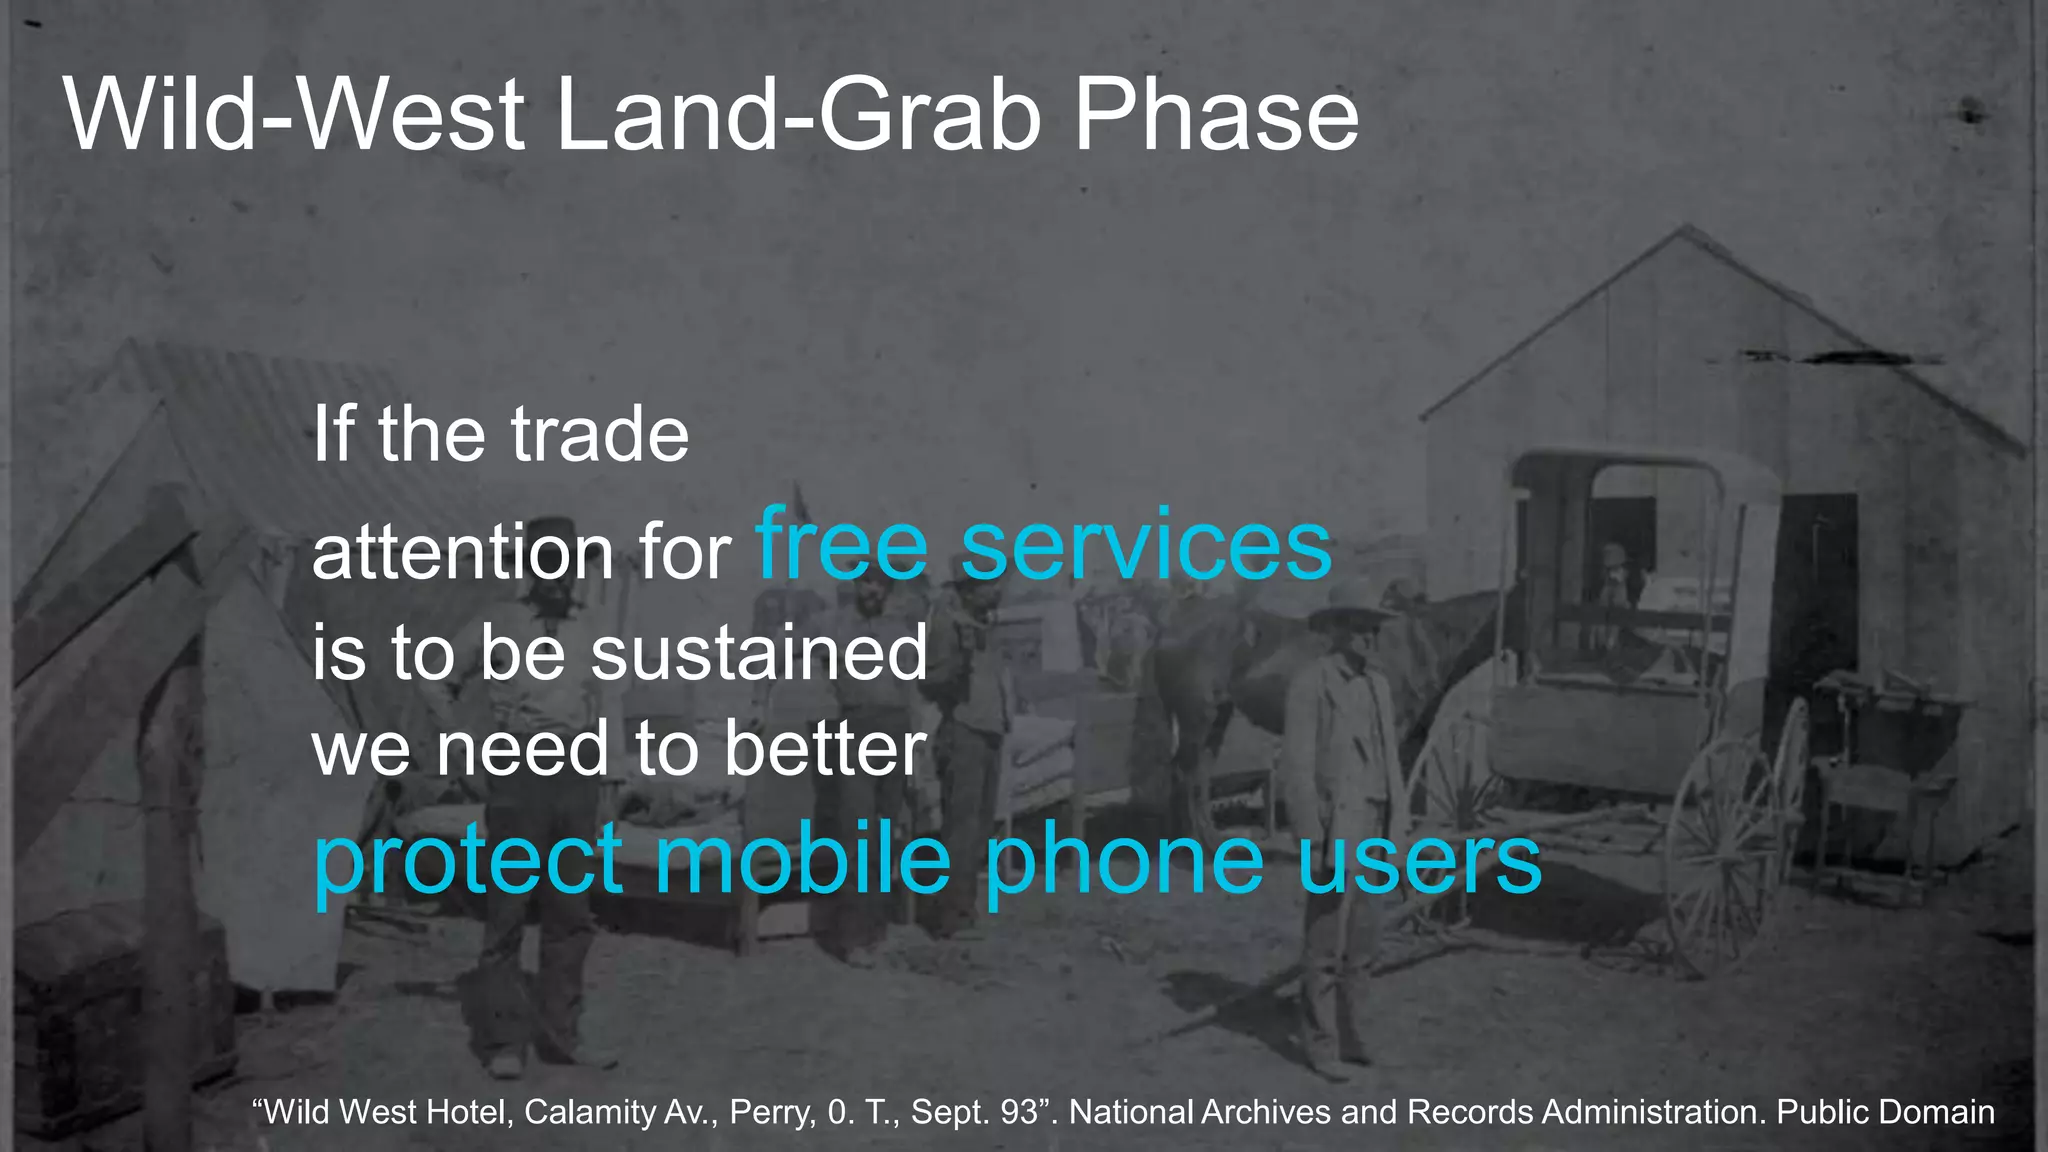

![Attention is not always scarce
Show them this photo if someone said technology … . Adam Rifkin. May 21, 2014 via Flickr. CC BY
Boredom displeasure caused by “lack of stimulation”
[Fenichel, 1951]
“a bored person is not just someone who does not have anything
to do; it’s someone who is actively looking for stimulation”
[Eastwood, 2002]](https://image.slidesharecdn.com/whenattentionisnotscarce-slideshare-150911050439-lva1-app6892/75/When-Attention-is-not-Scarce-Detecting-Boredom-from-Mobile-Phone-Usage-16-2048.jpg)
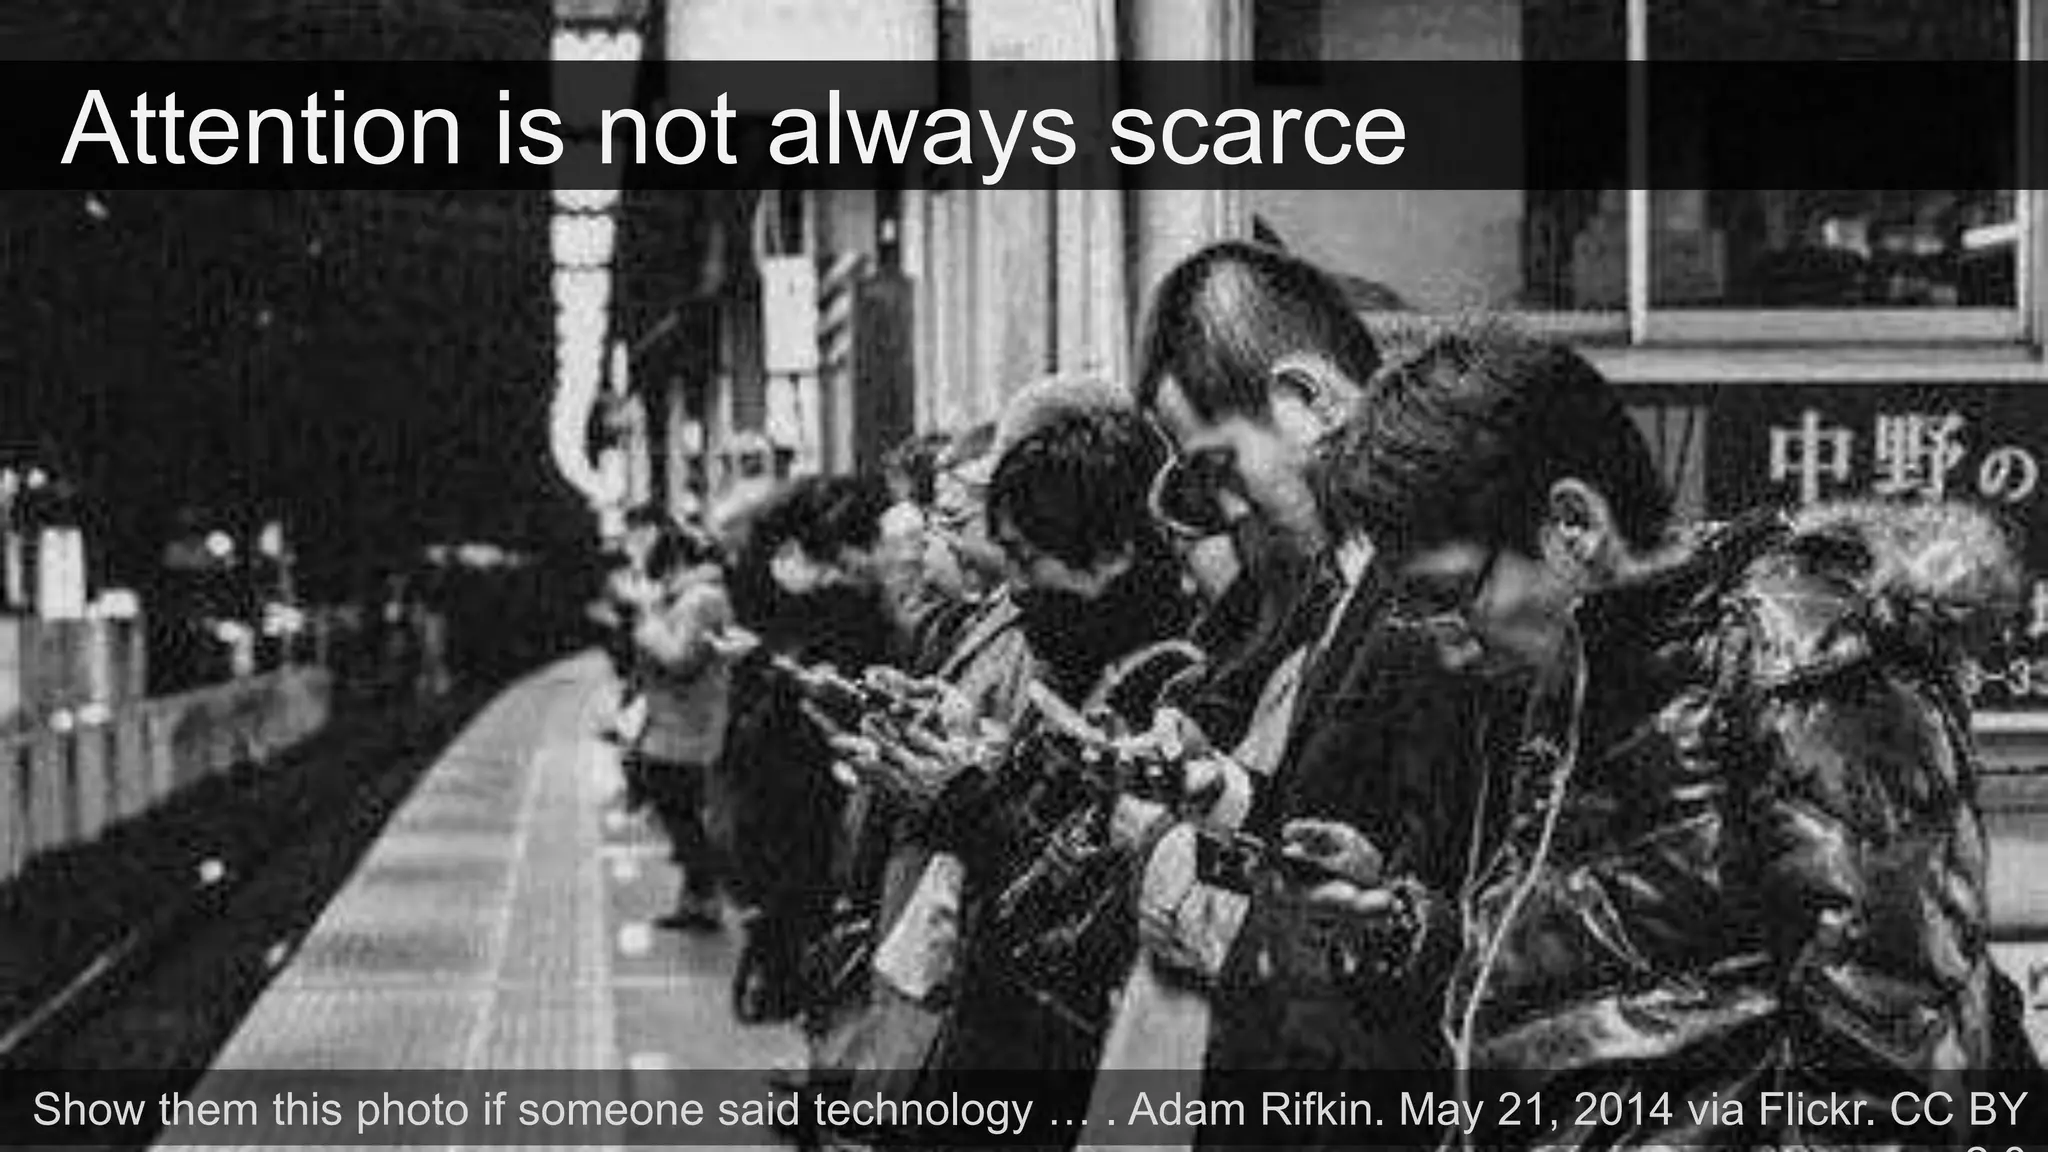
![Attention is not always scarce
Show them this photo if someone said technology … . Adam Rifkin. May 21, 2014 via Flickr. CC BY
Boredom displeasure caused by “lack of stimulation”
[Fenichel, 1951]
“a bored person is not just someone who does not have anything
to do; it’s someone who is actively looking for stimulation”
[Eastwood, 2002]
Mobile phones are a commonly used tool to kill time when bored
[Brown et al. 2014]](https://image.slidesharecdn.com/whenattentionisnotscarce-slideshare-150911050439-lva1-app6892/75/When-Attention-is-not-Scarce-Detecting-Boredom-from-Mobile-Phone-Usage-17-2048.jpg)

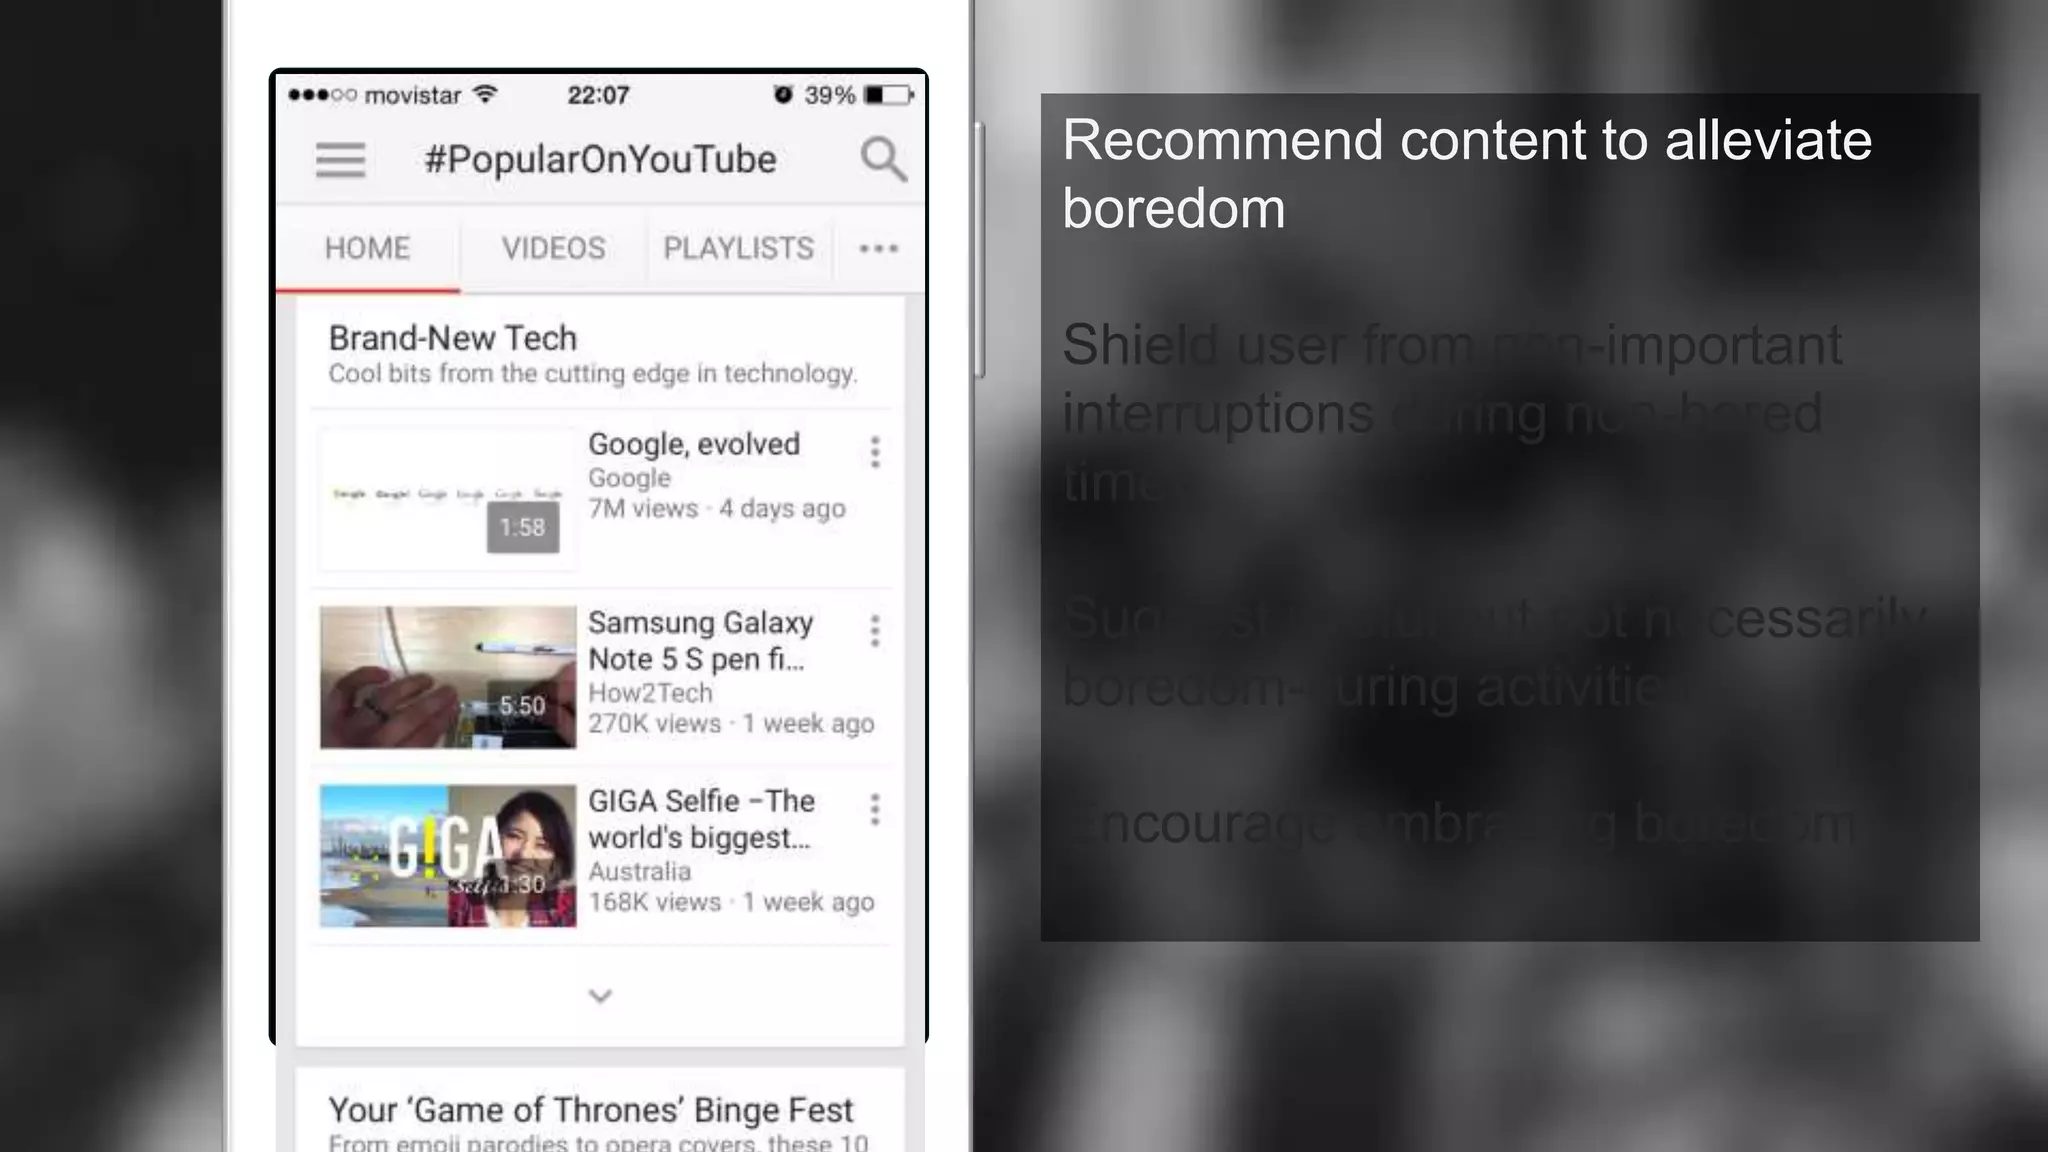
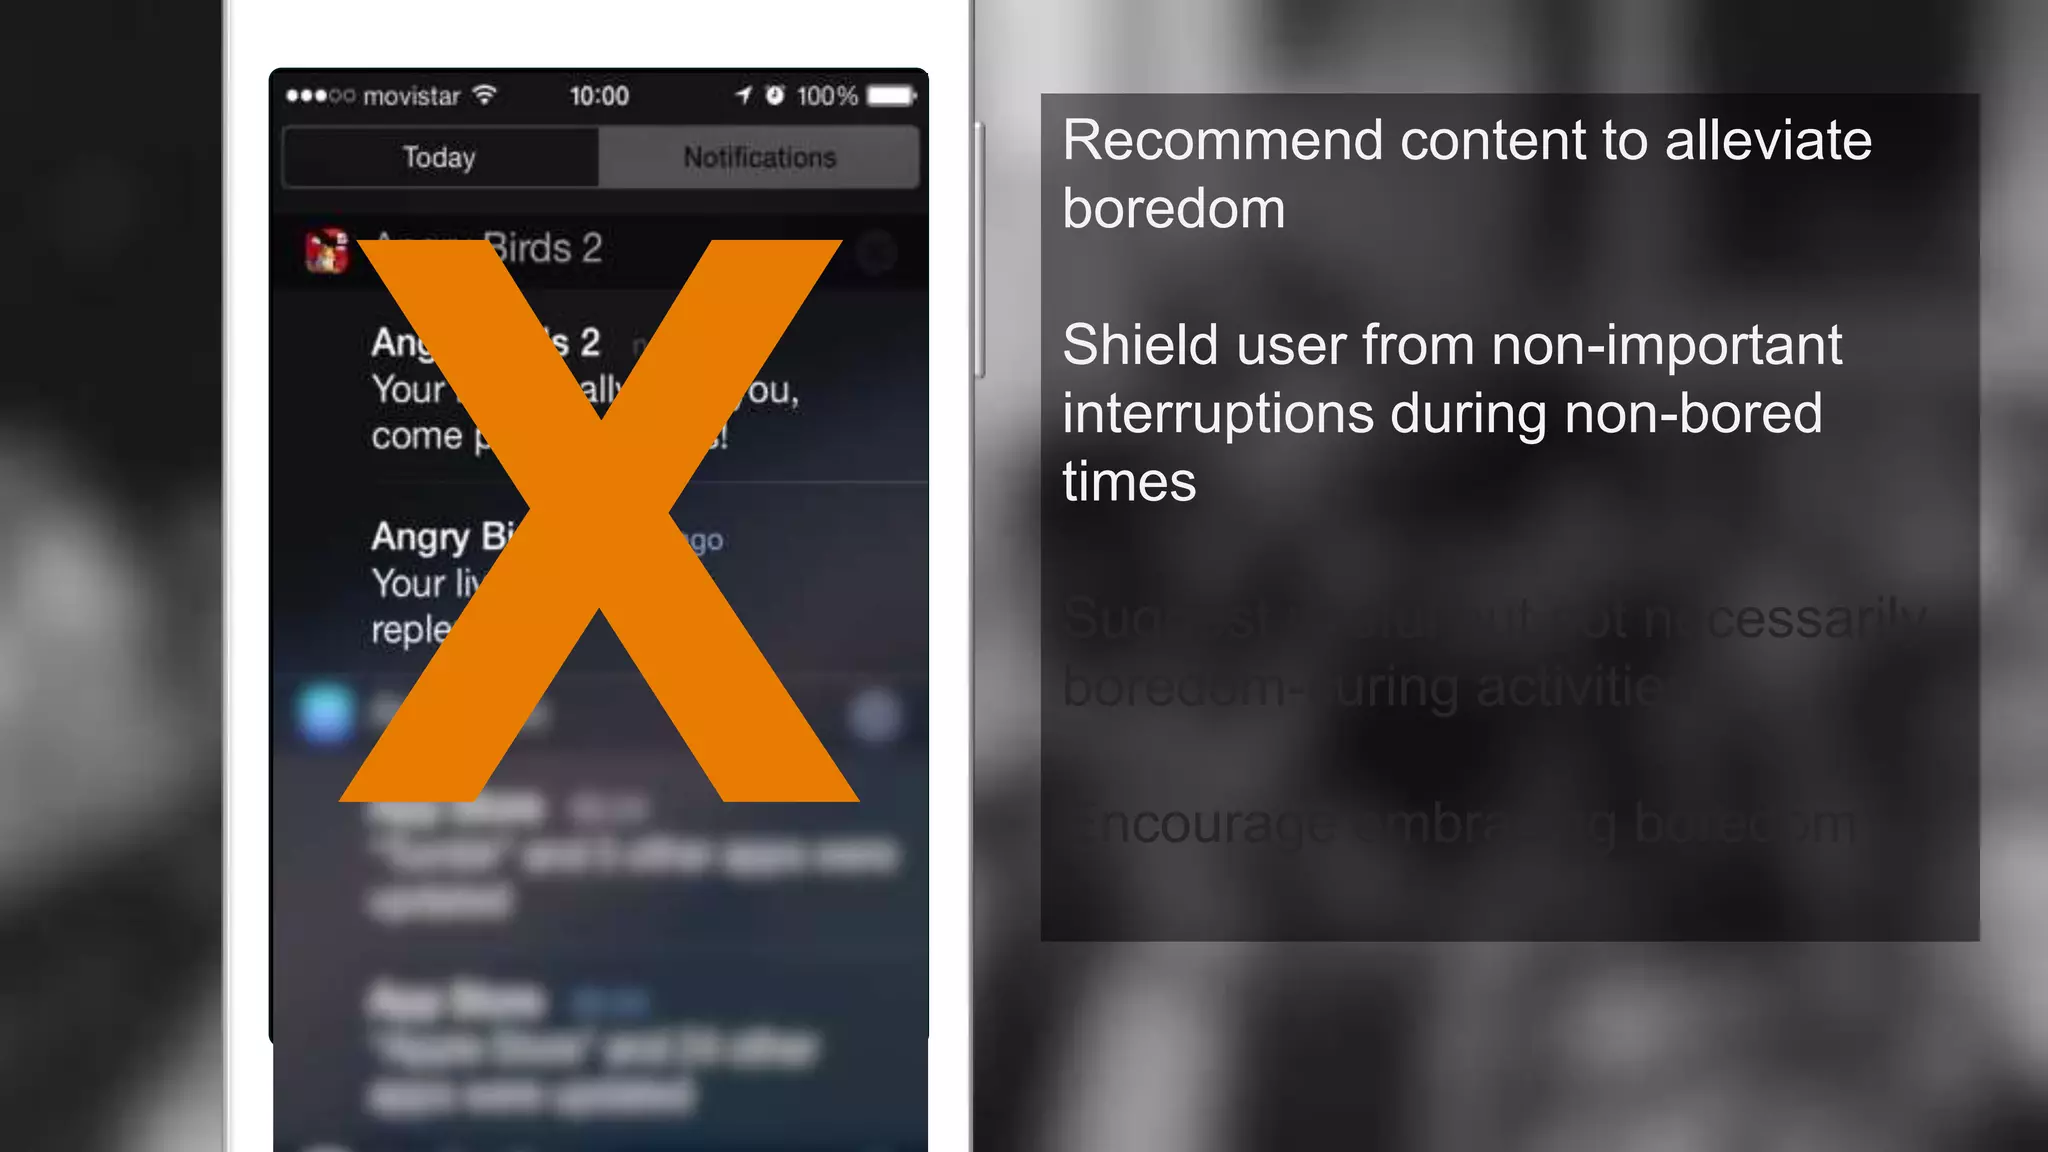
![Attention is not always scarce
Mobile phones are a commonly used tool to
fill or kill time when bored [Brown et al. 2014]
Show them this photo if someone said technology … . Adam Rifkin. May 21, 2014 via Flickr. CC BY
Boredom displeasure caused by “lack of stimulation”
[Fenichel, 1951]
“a bored person is not just someone who does not have anything
to do; it’s someone who is actively looking for stimulation”
[Eastwood, 2002]
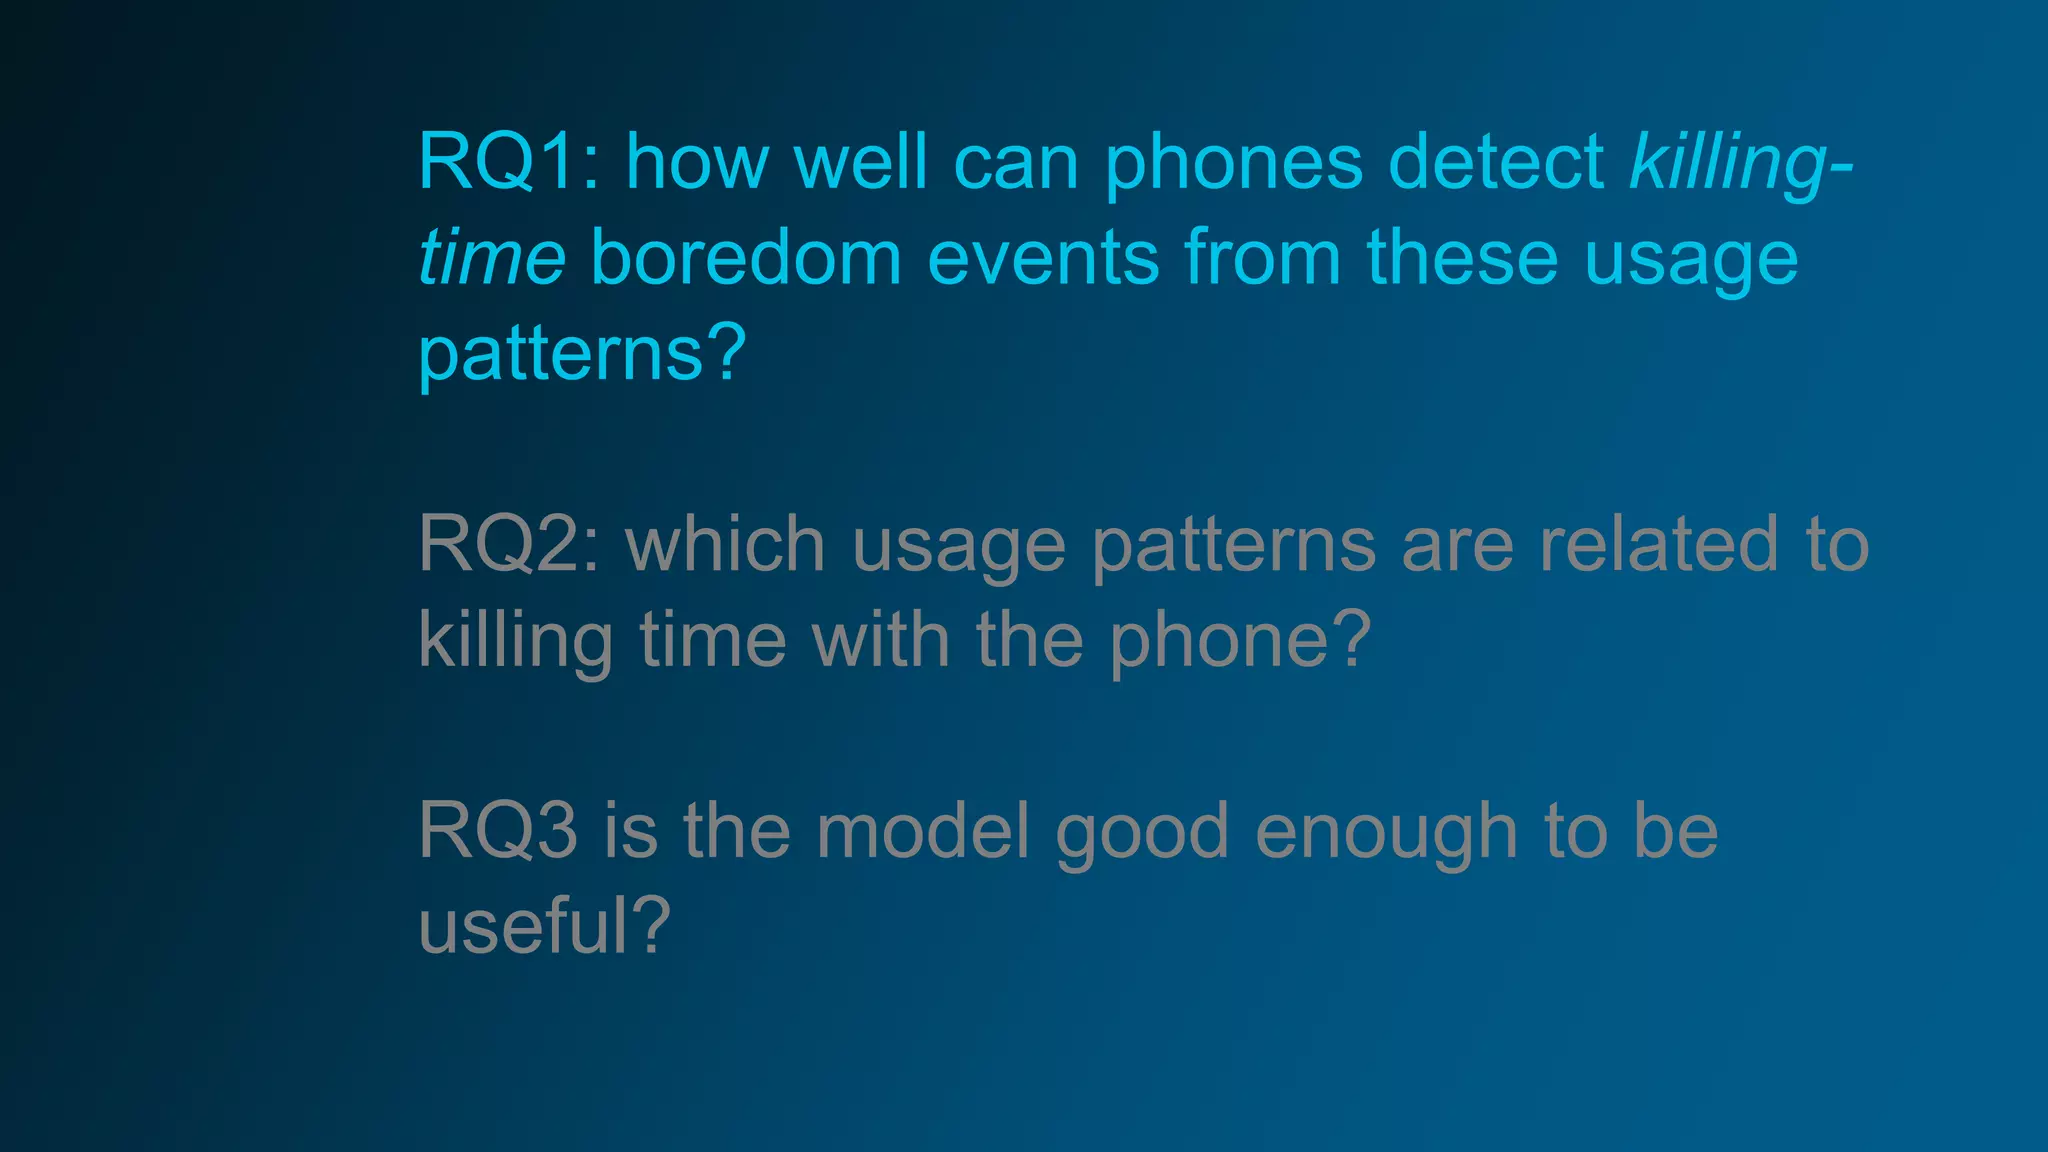
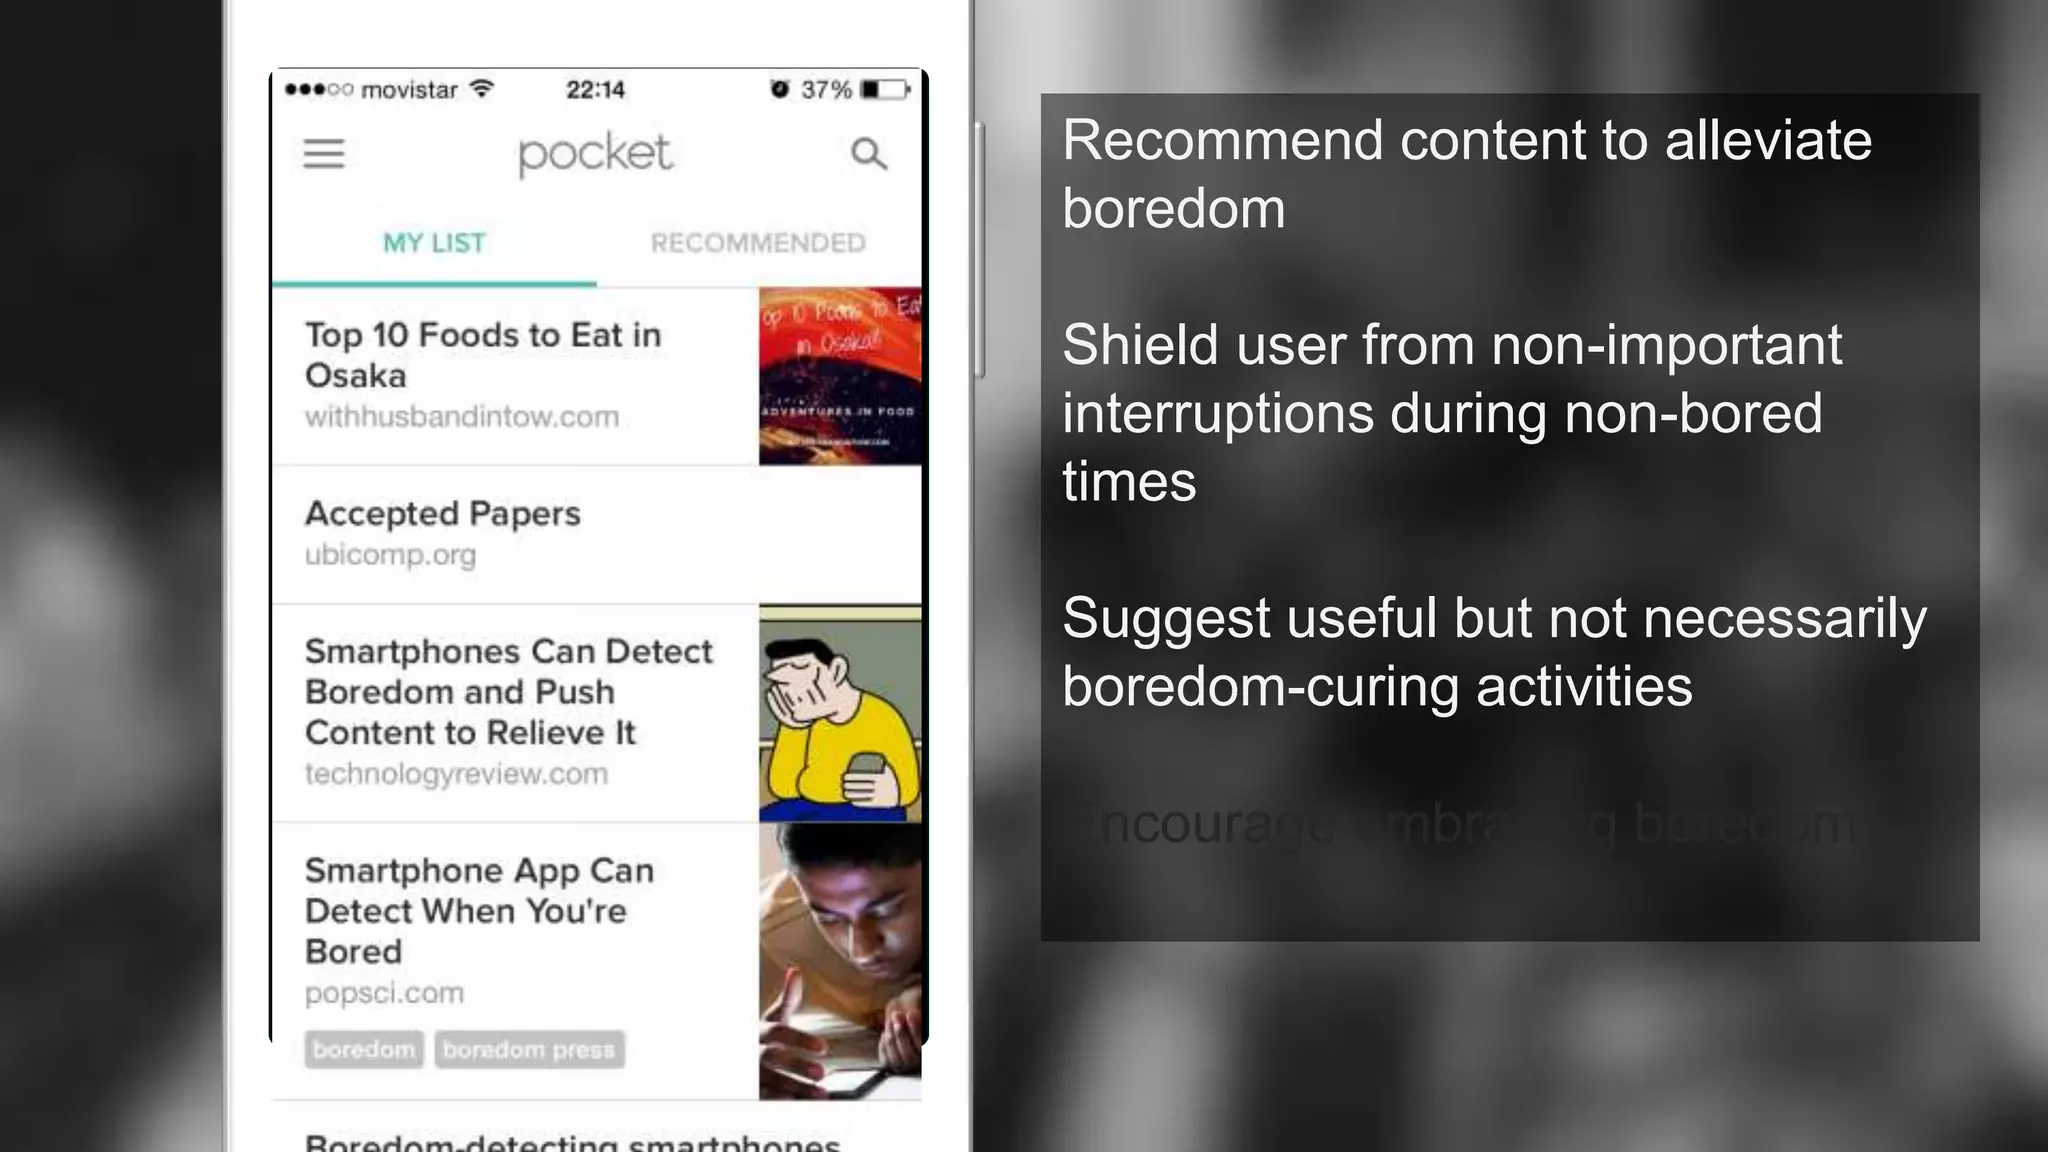
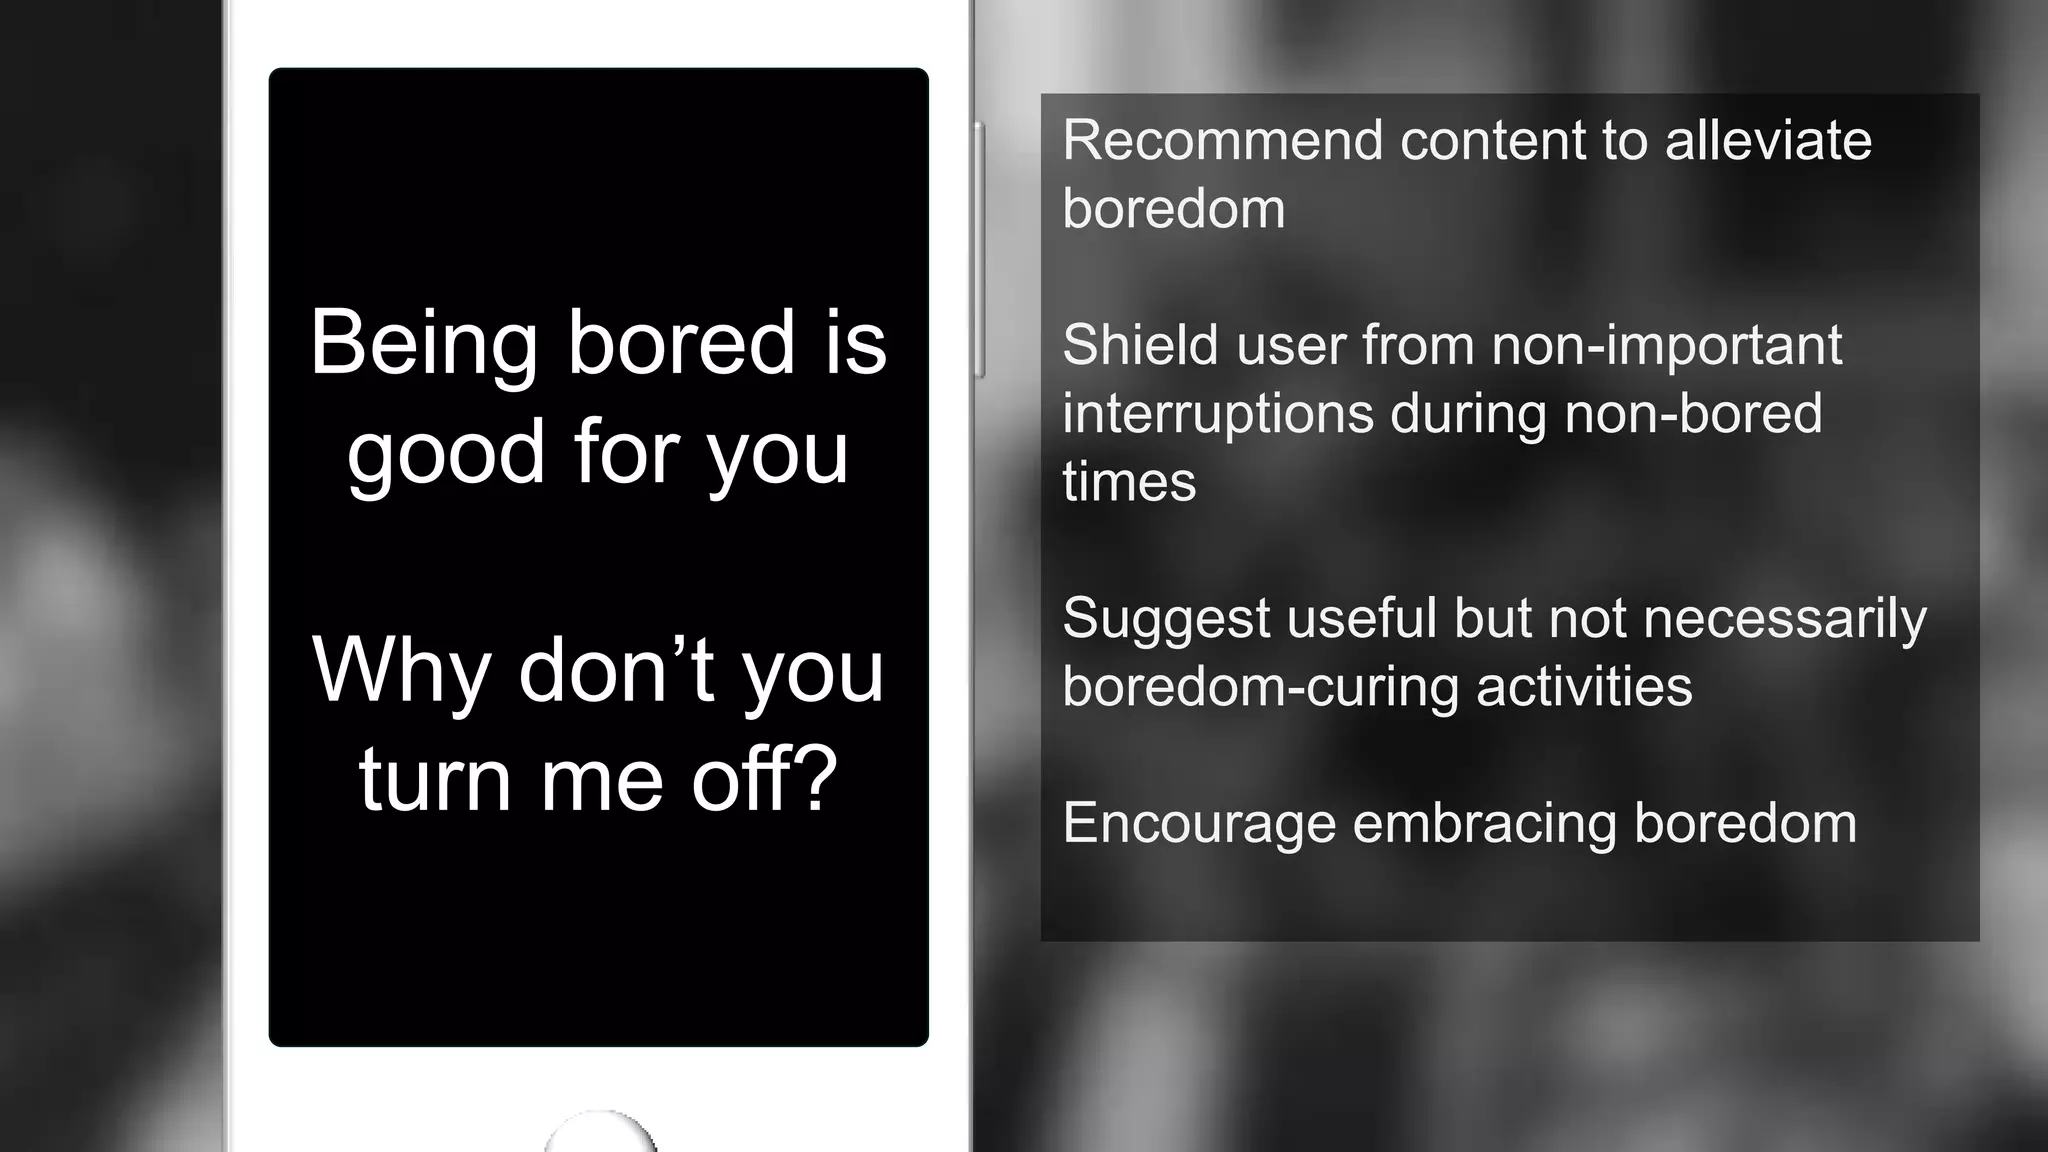
If phones knew when their users are killing time
maybe they could suggest them to make better use
of the moment](https://image.slidesharecdn.com/whenattentionisnotscarce-slideshare-150911050439-lva1-app6892/75/When-Attention-is-not-Scarce-Detecting-Boredom-from-Mobile-Phone-Usage-22-2048.jpg)
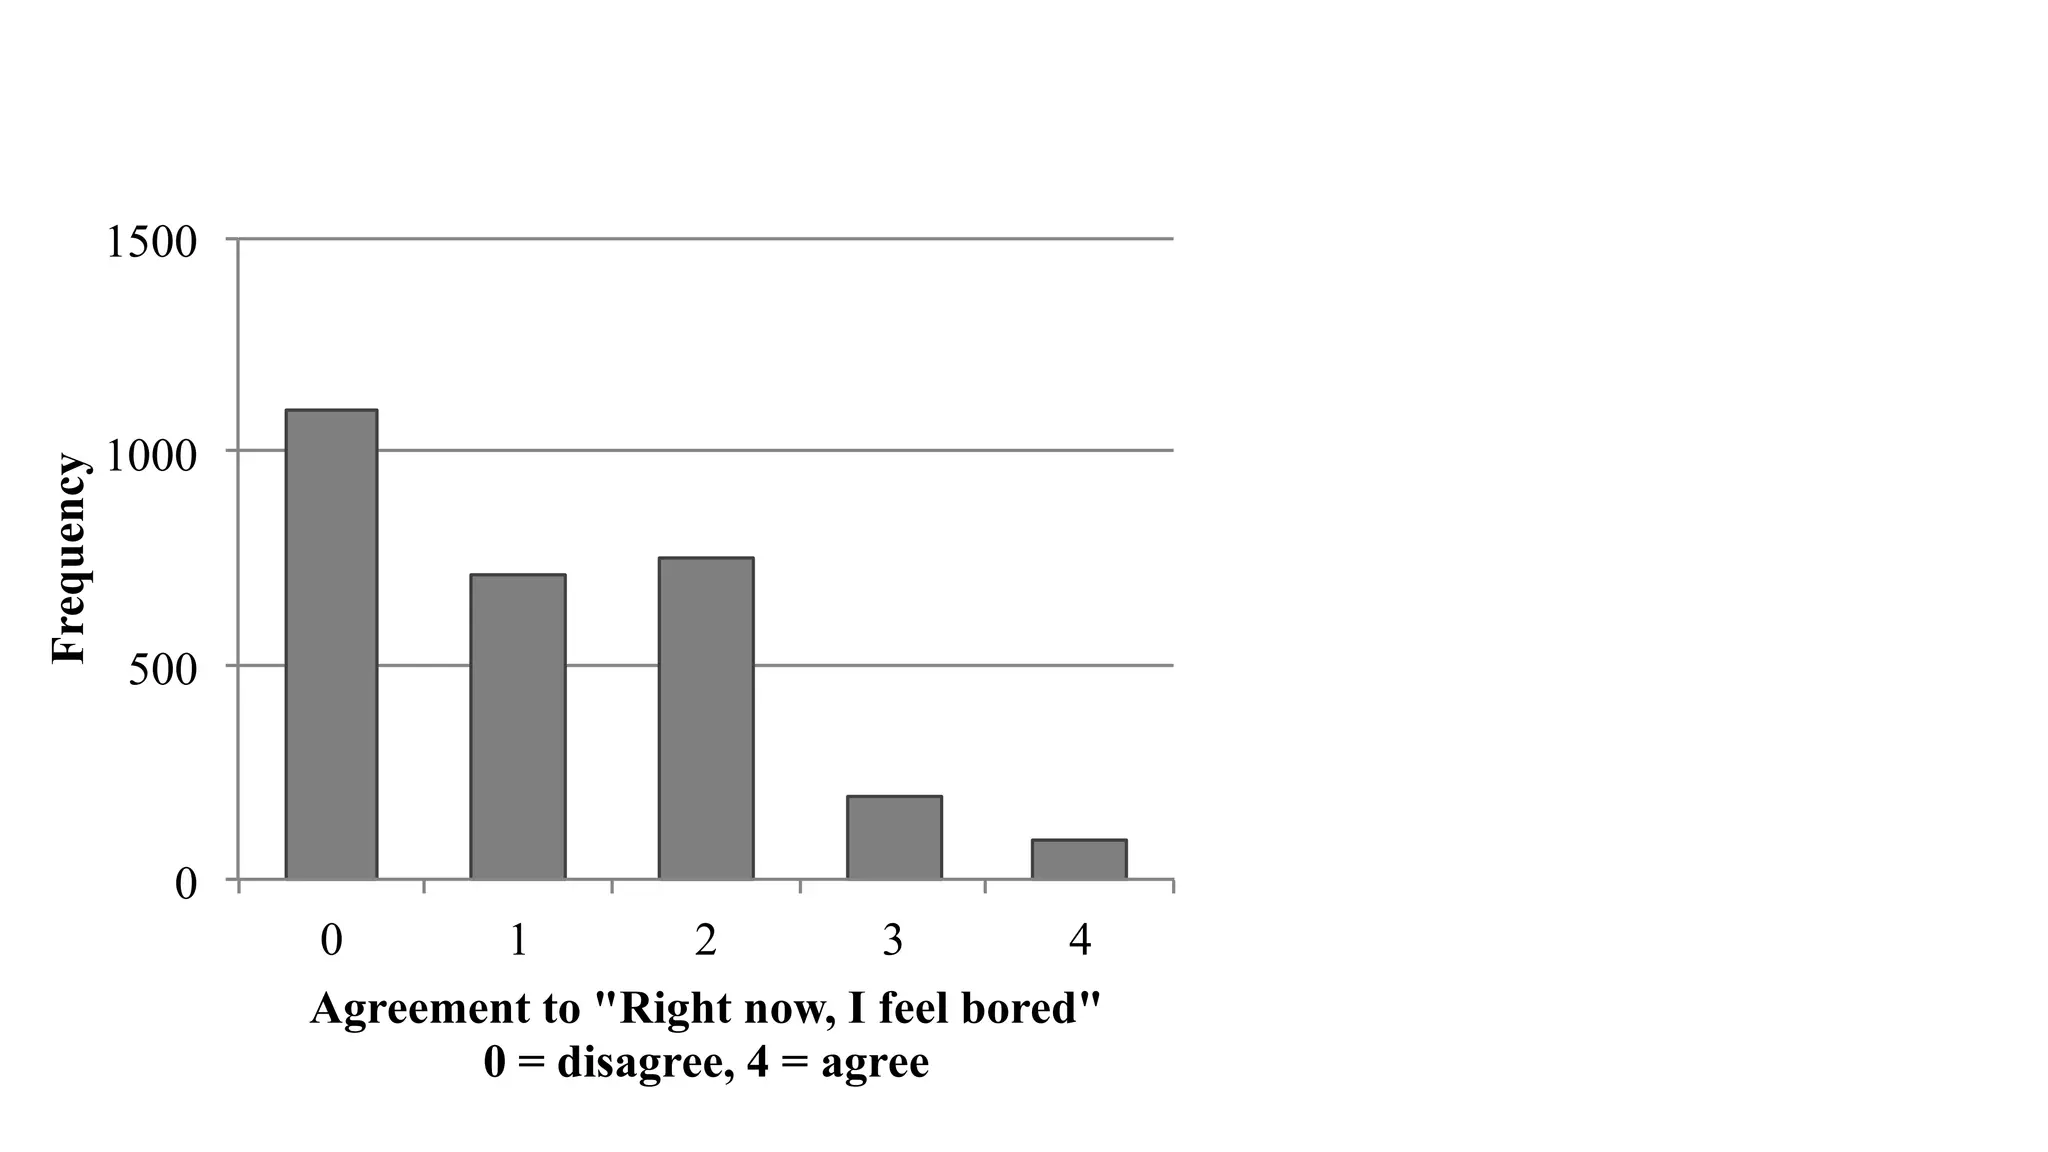
![Experience Sampling
“Right now, I feel bored”
[5-point Likert scale]
Min. 6 times per day
Preferably triggered when phone in use
Borapp – Experience Sampling](https://image.slidesharecdn.com/whenattentionisnotscarce-slideshare-150911050439-lva1-app6892/75/When-Attention-is-not-Scarce-Detecting-Boredom-from-Mobile-Phone-Usage-25-2048.jpg)
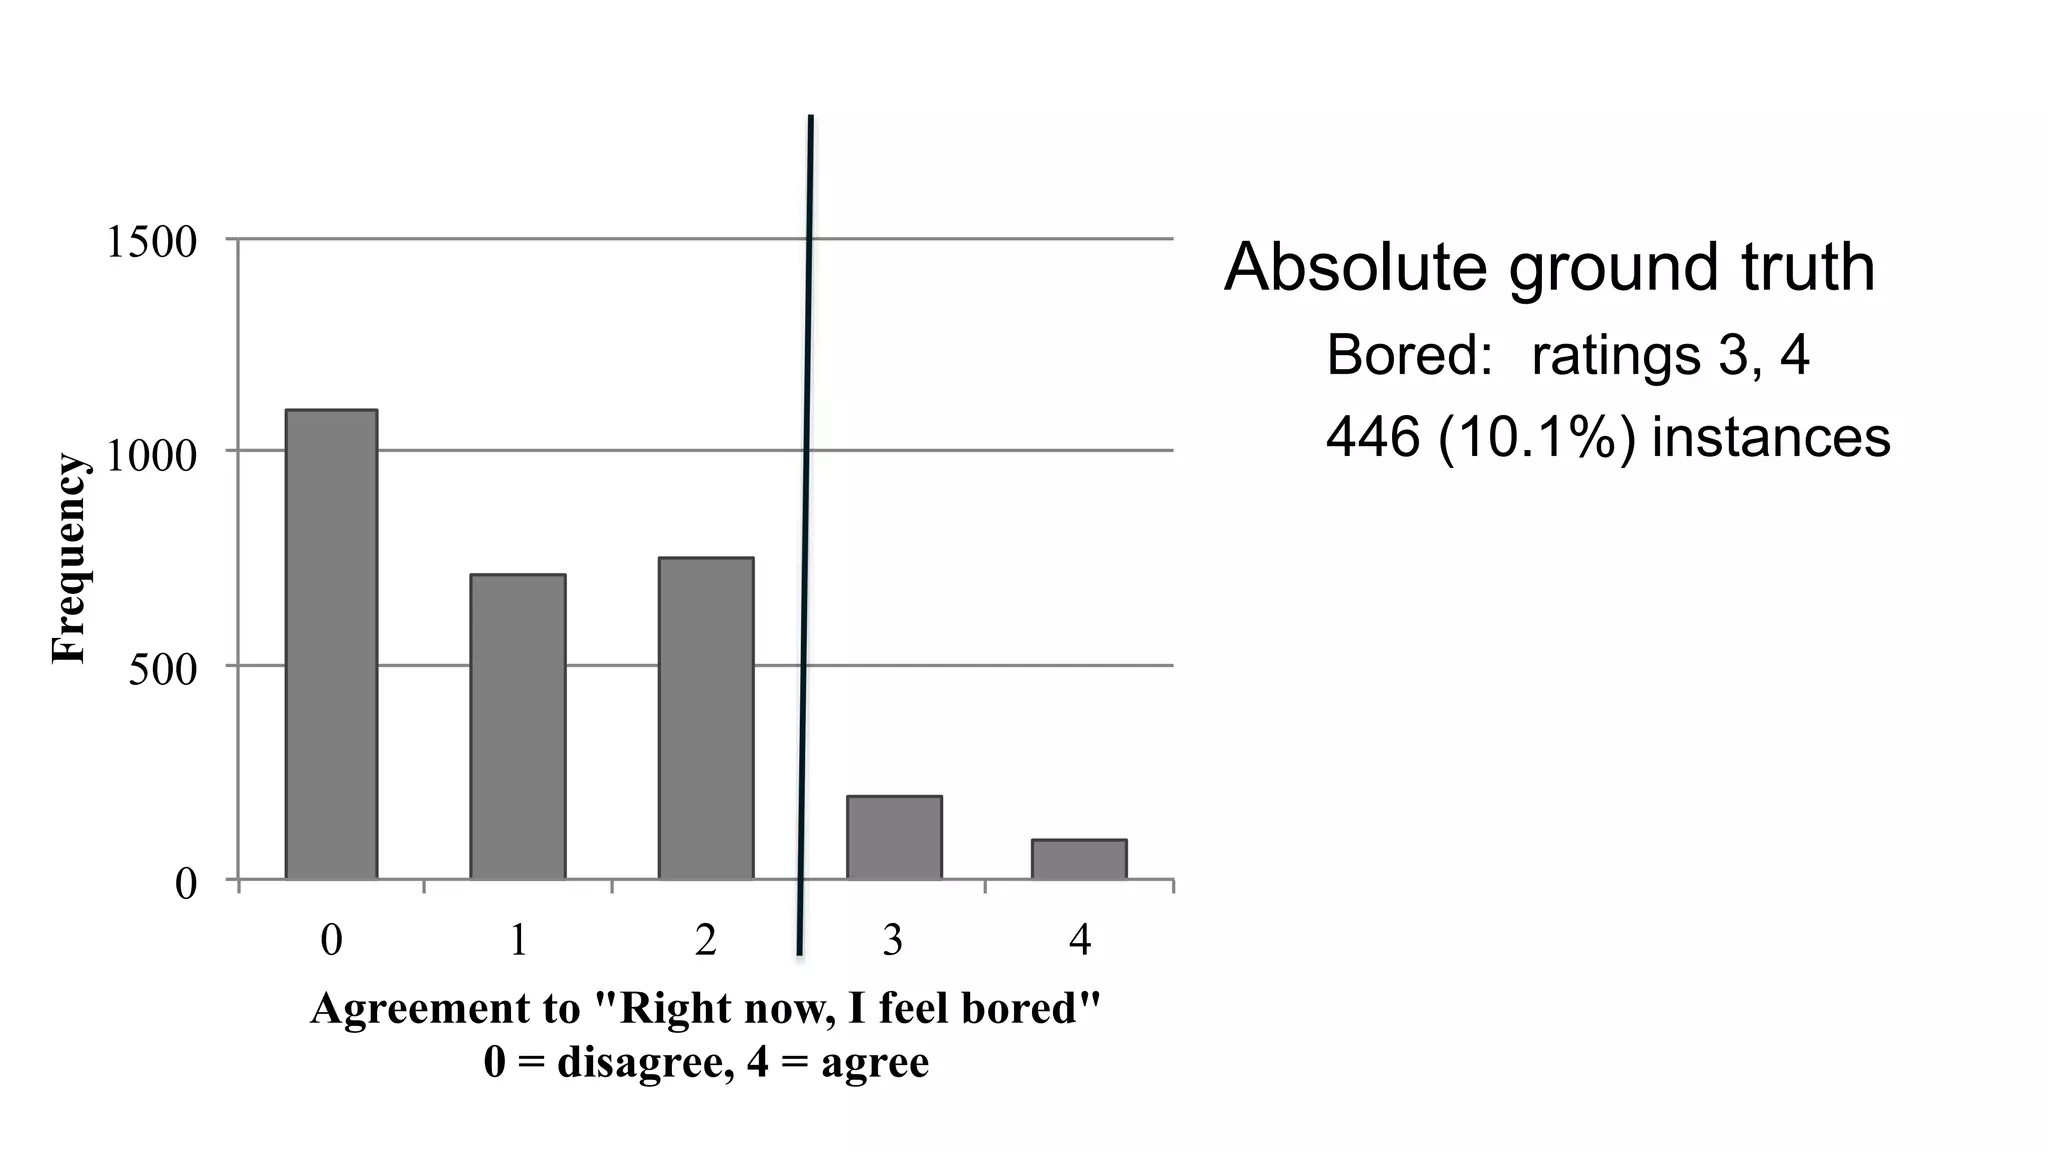
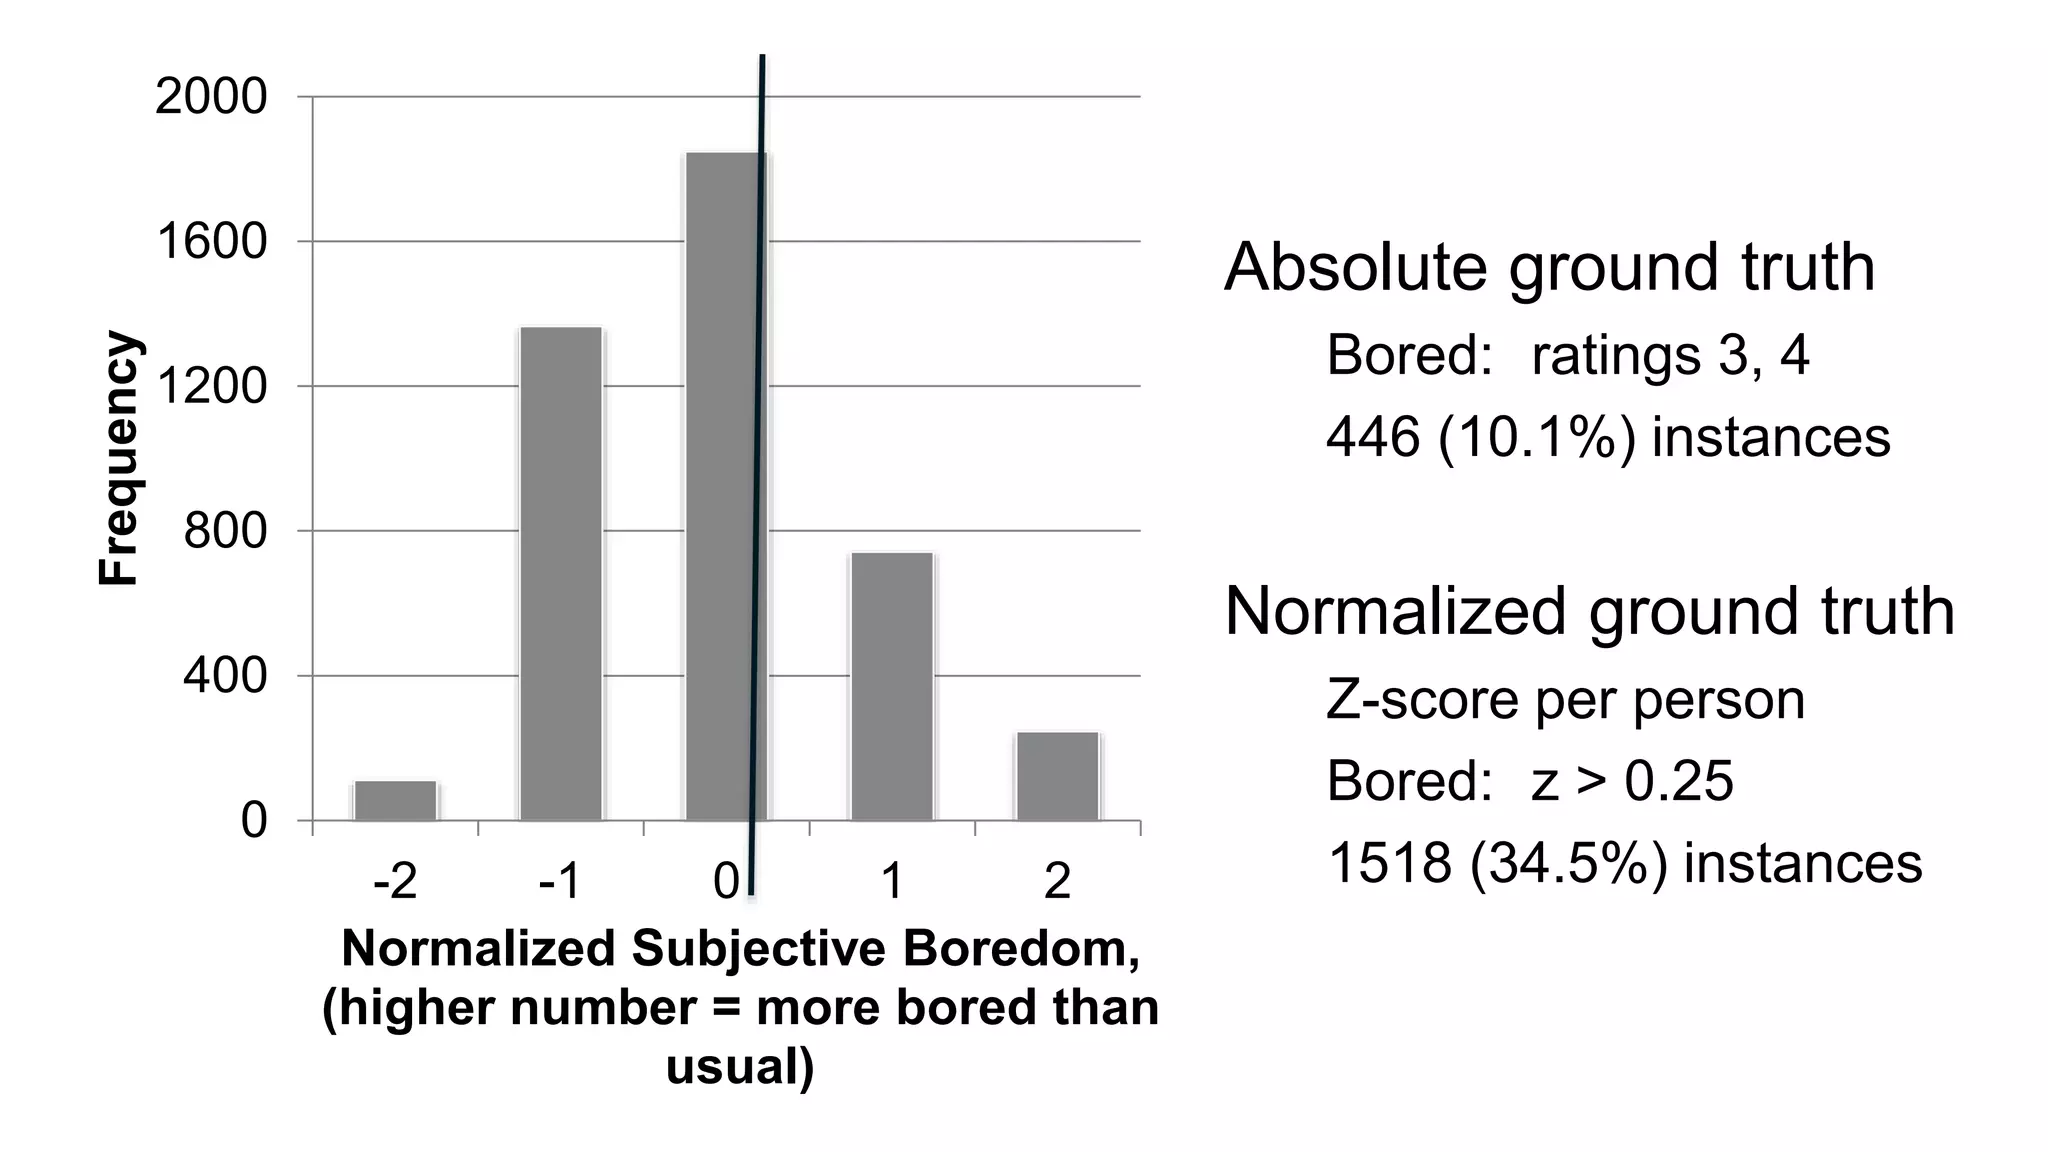
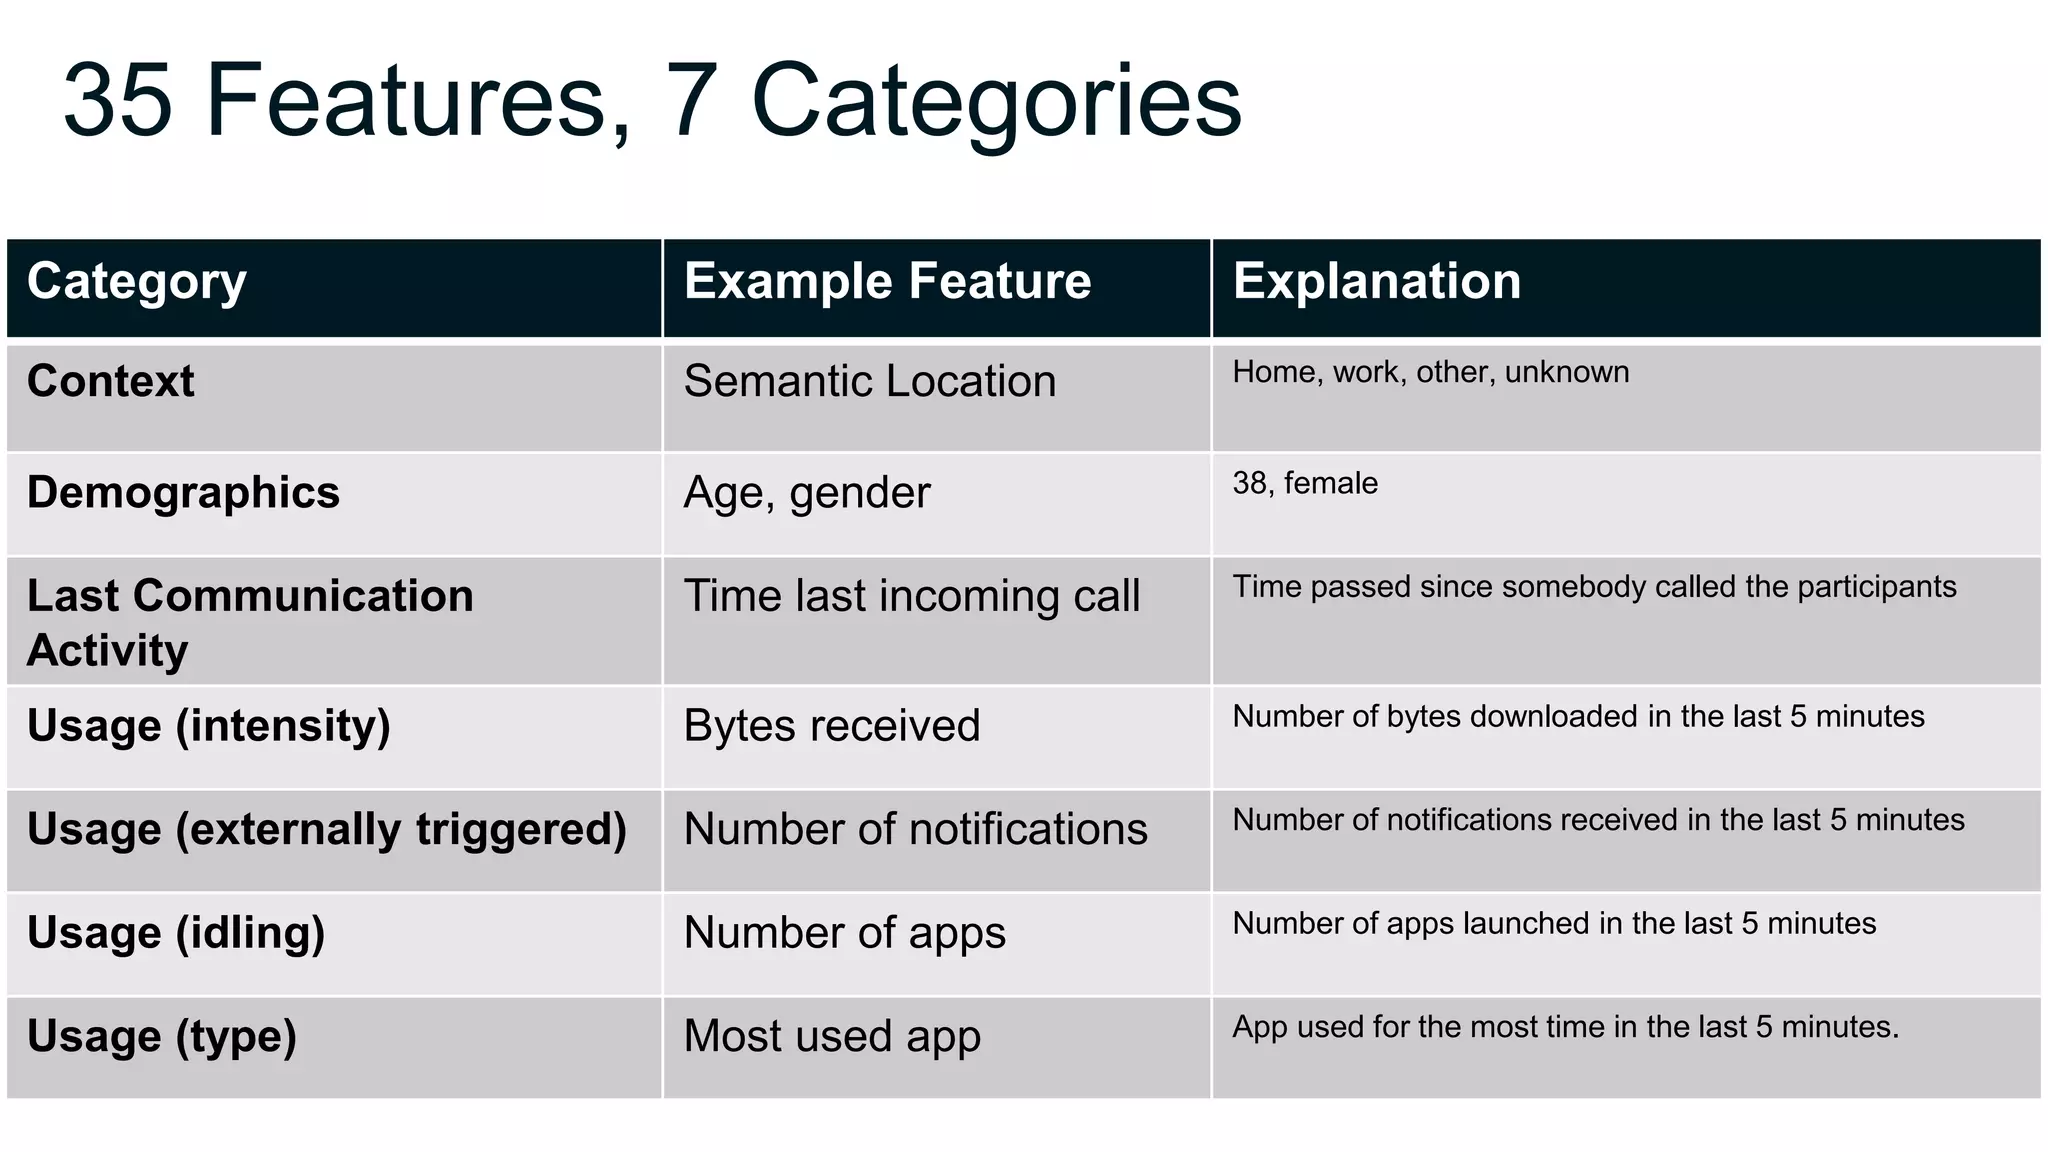
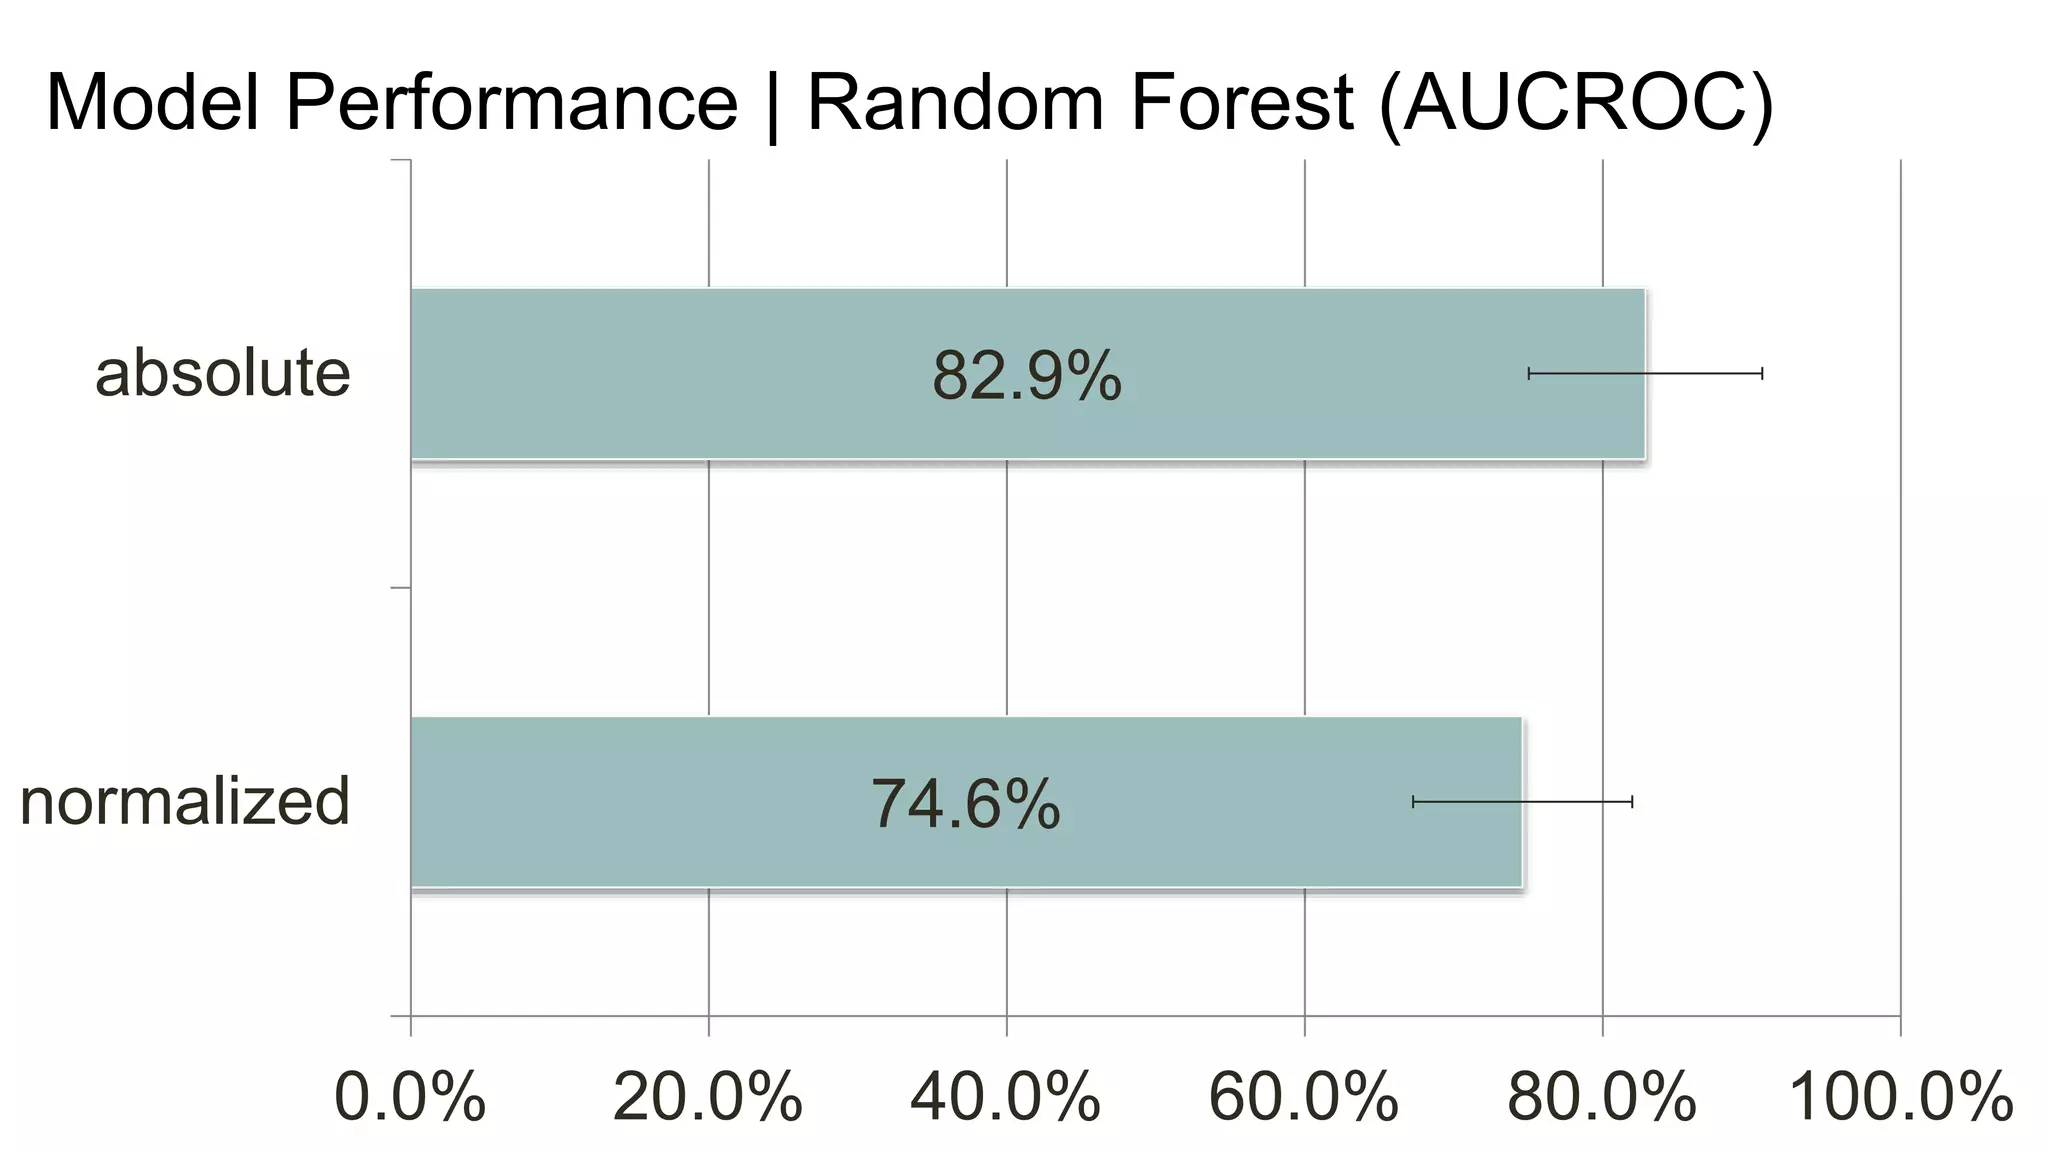
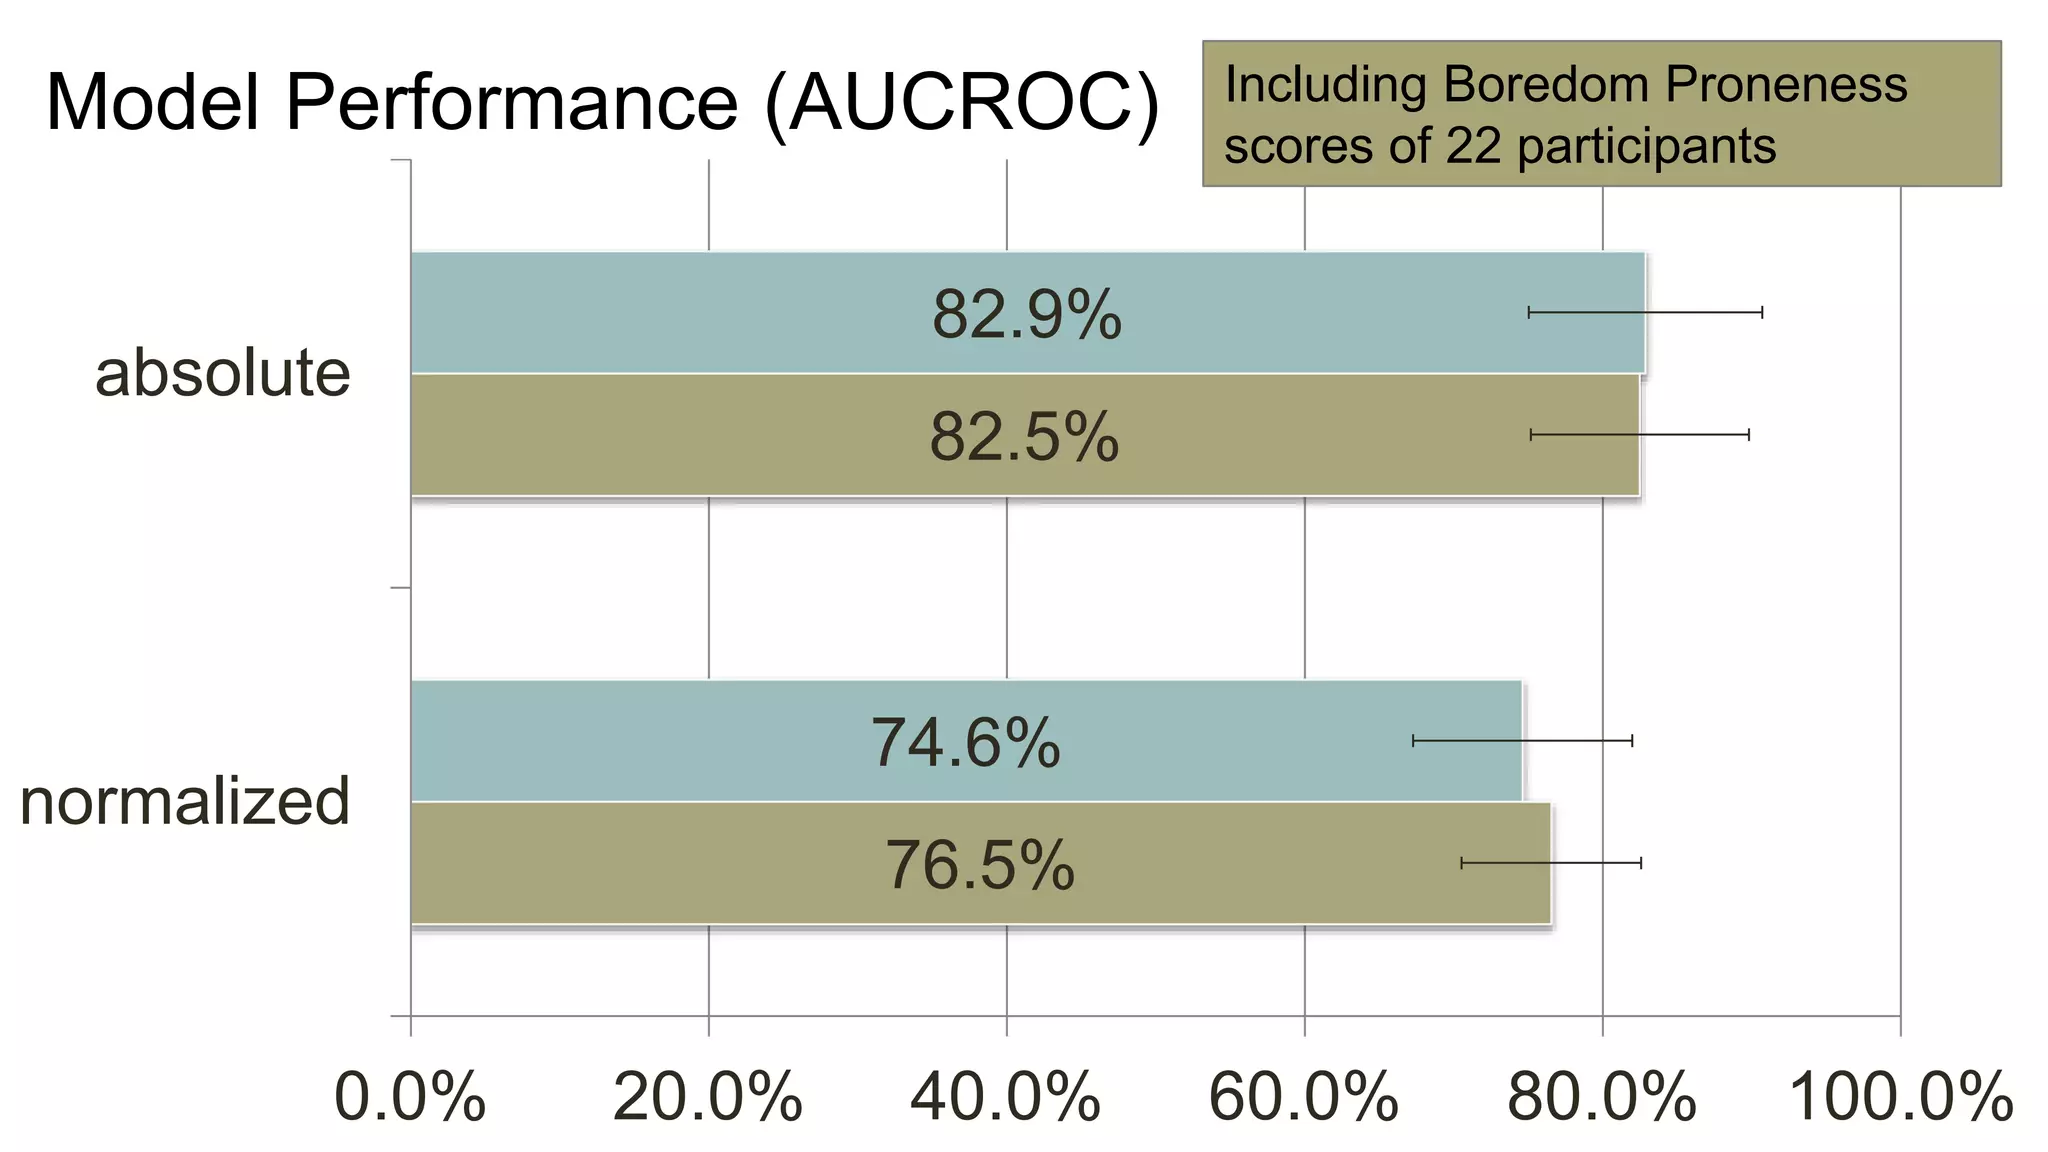
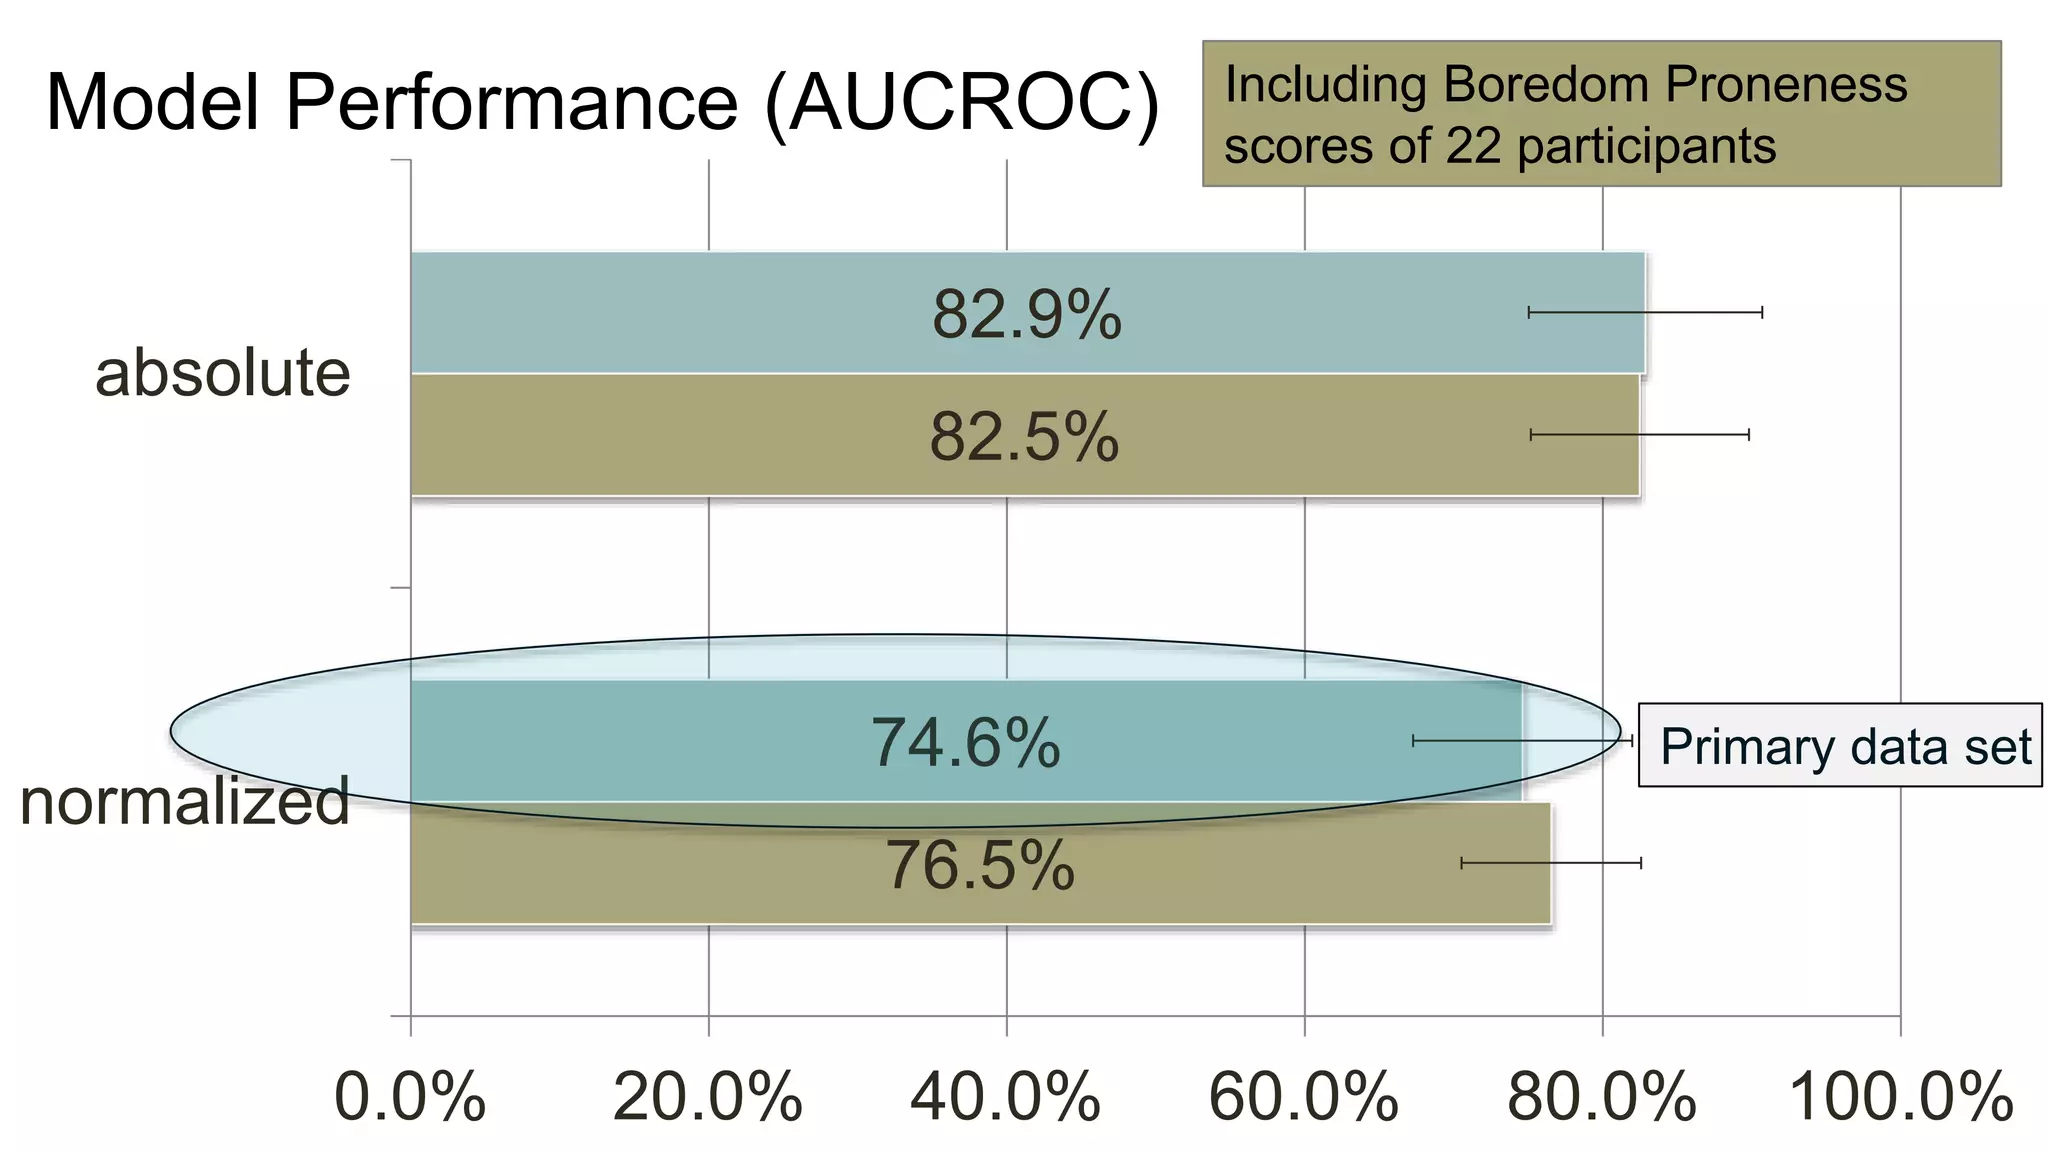
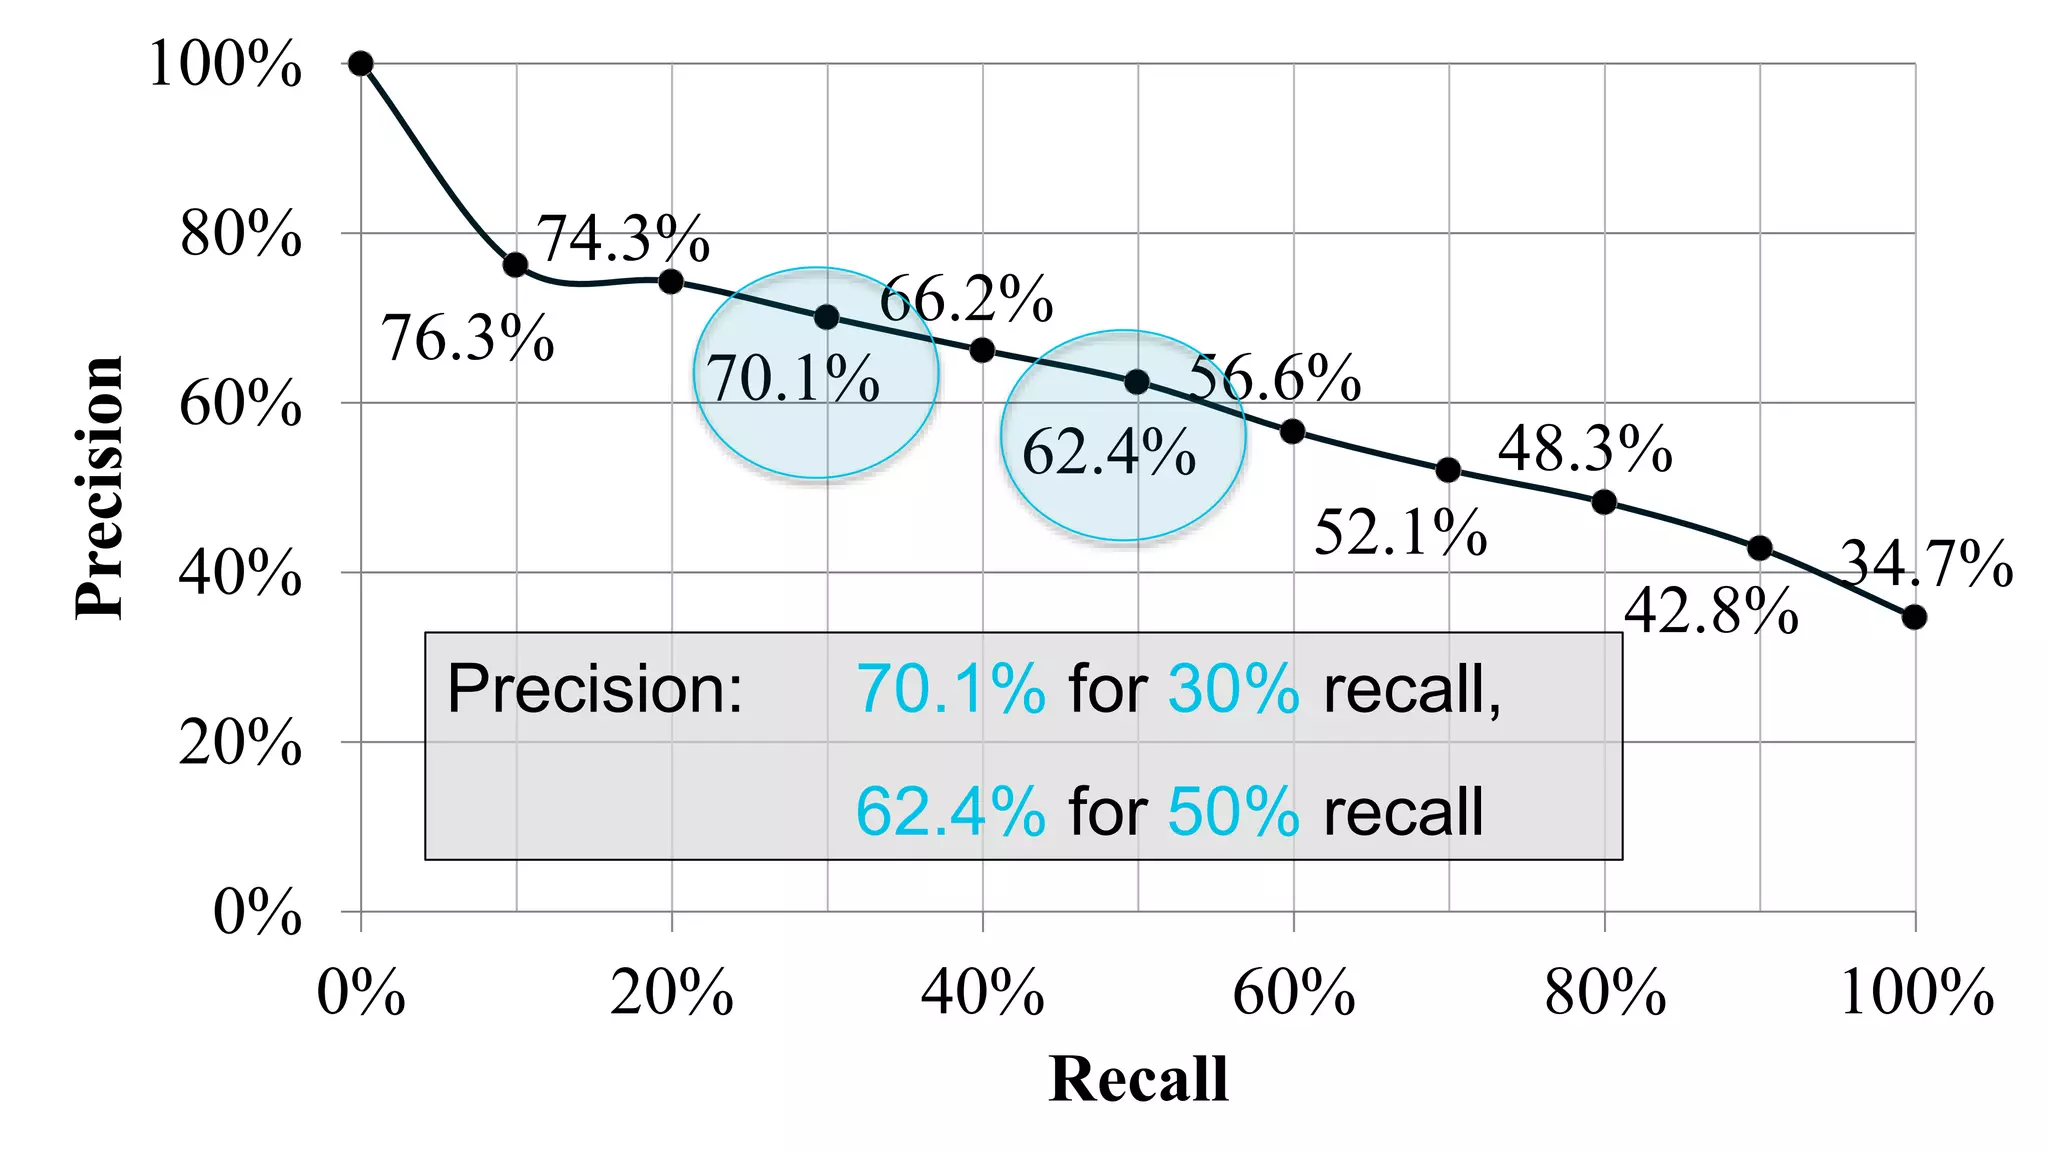
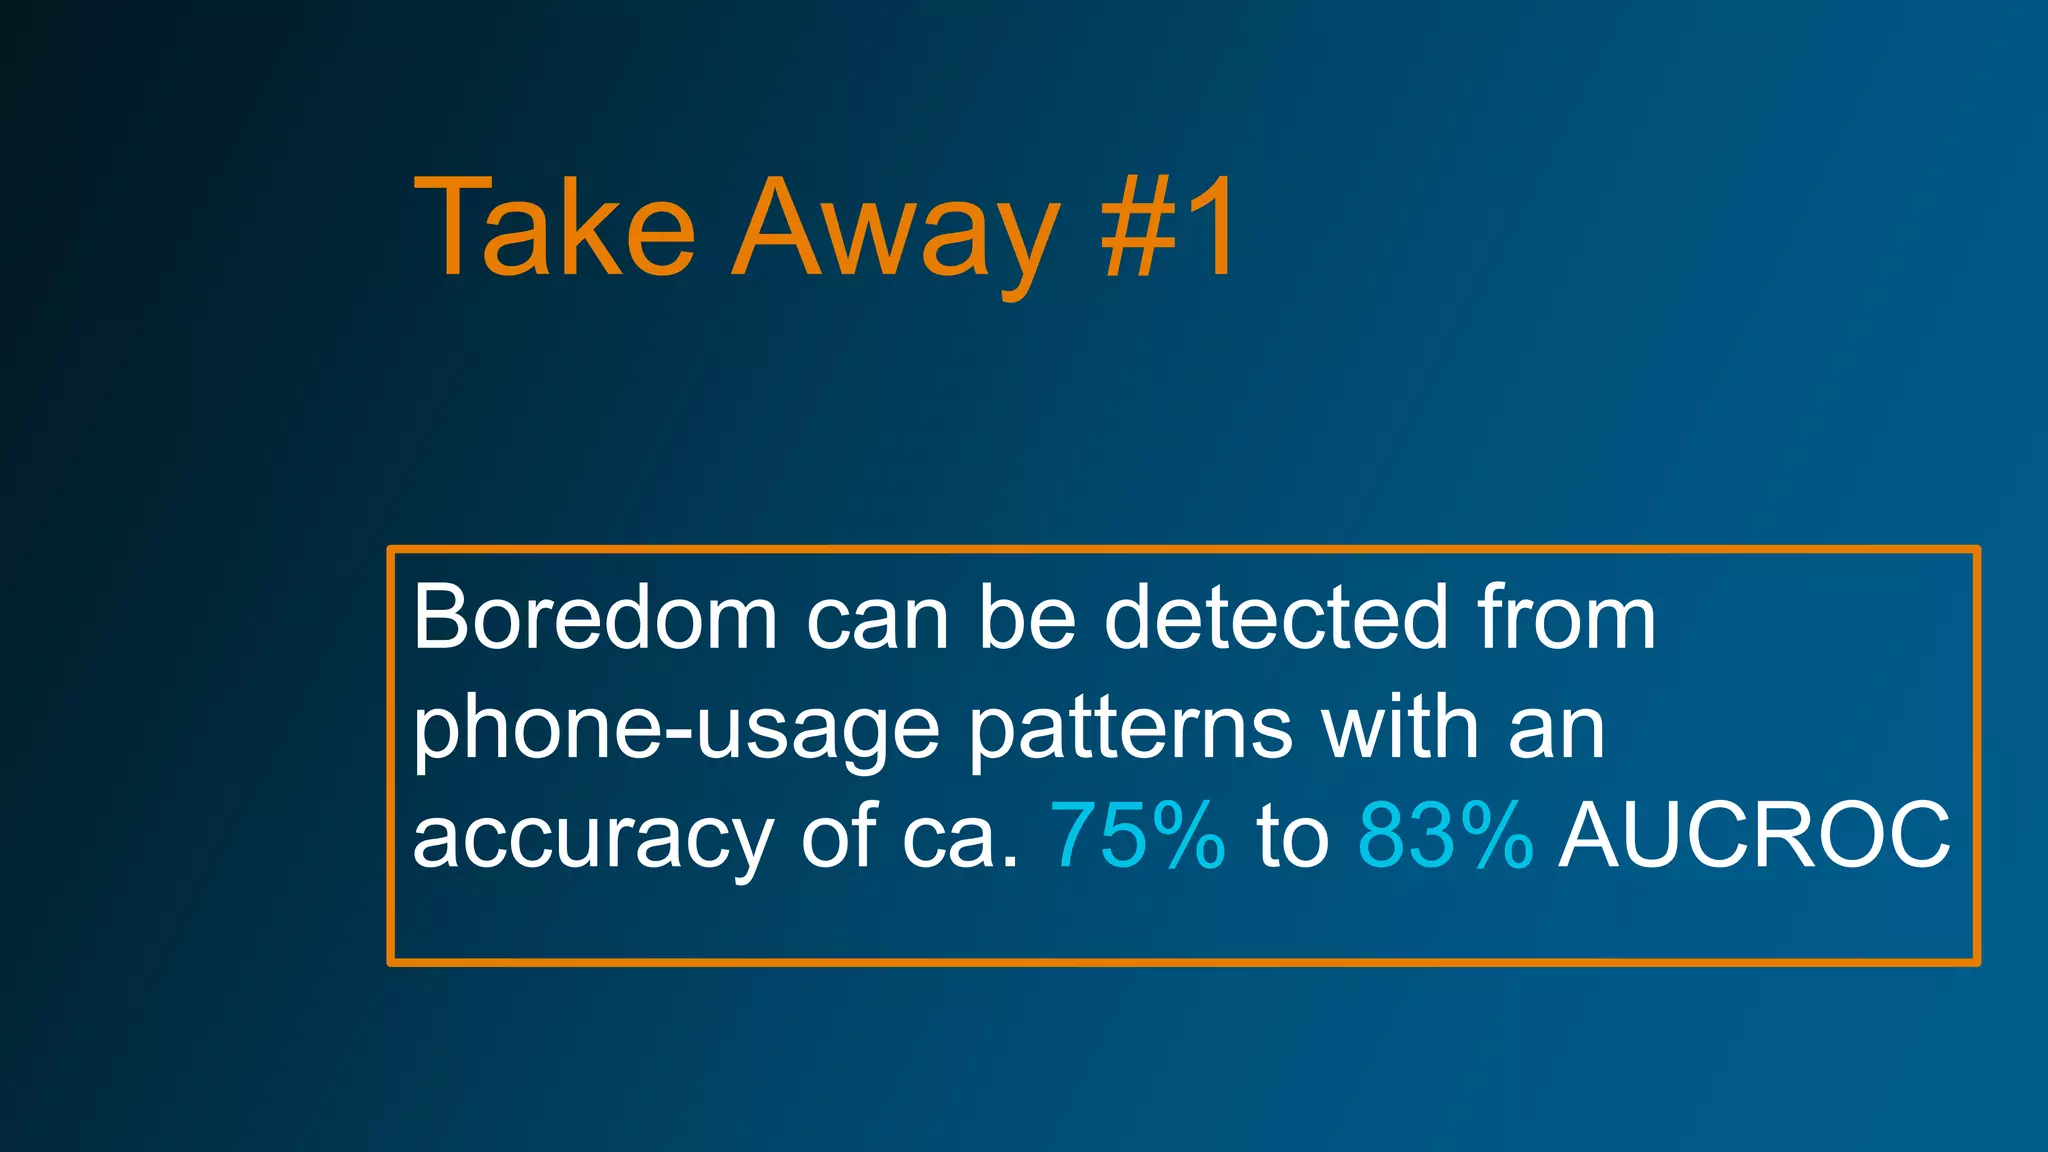
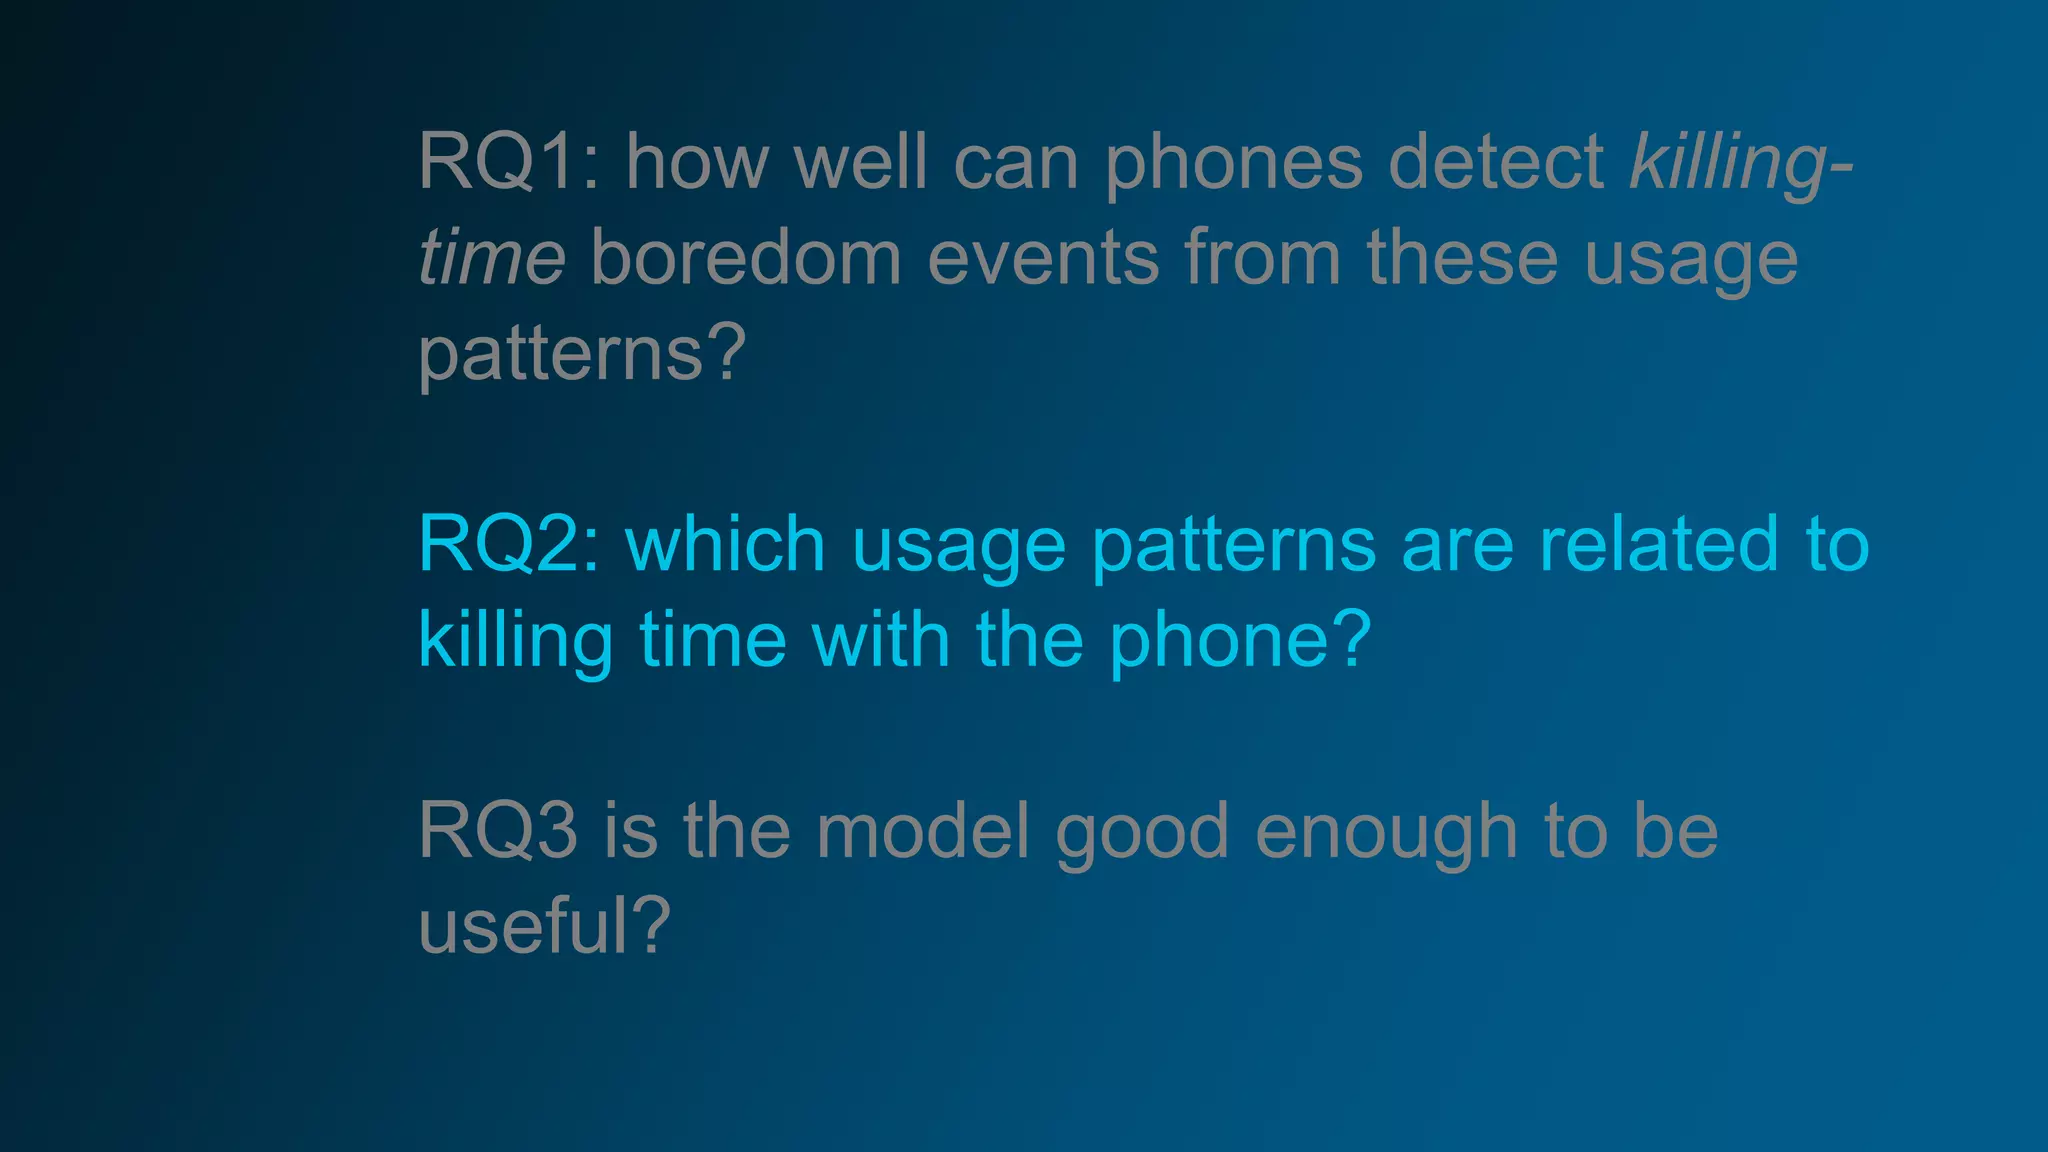
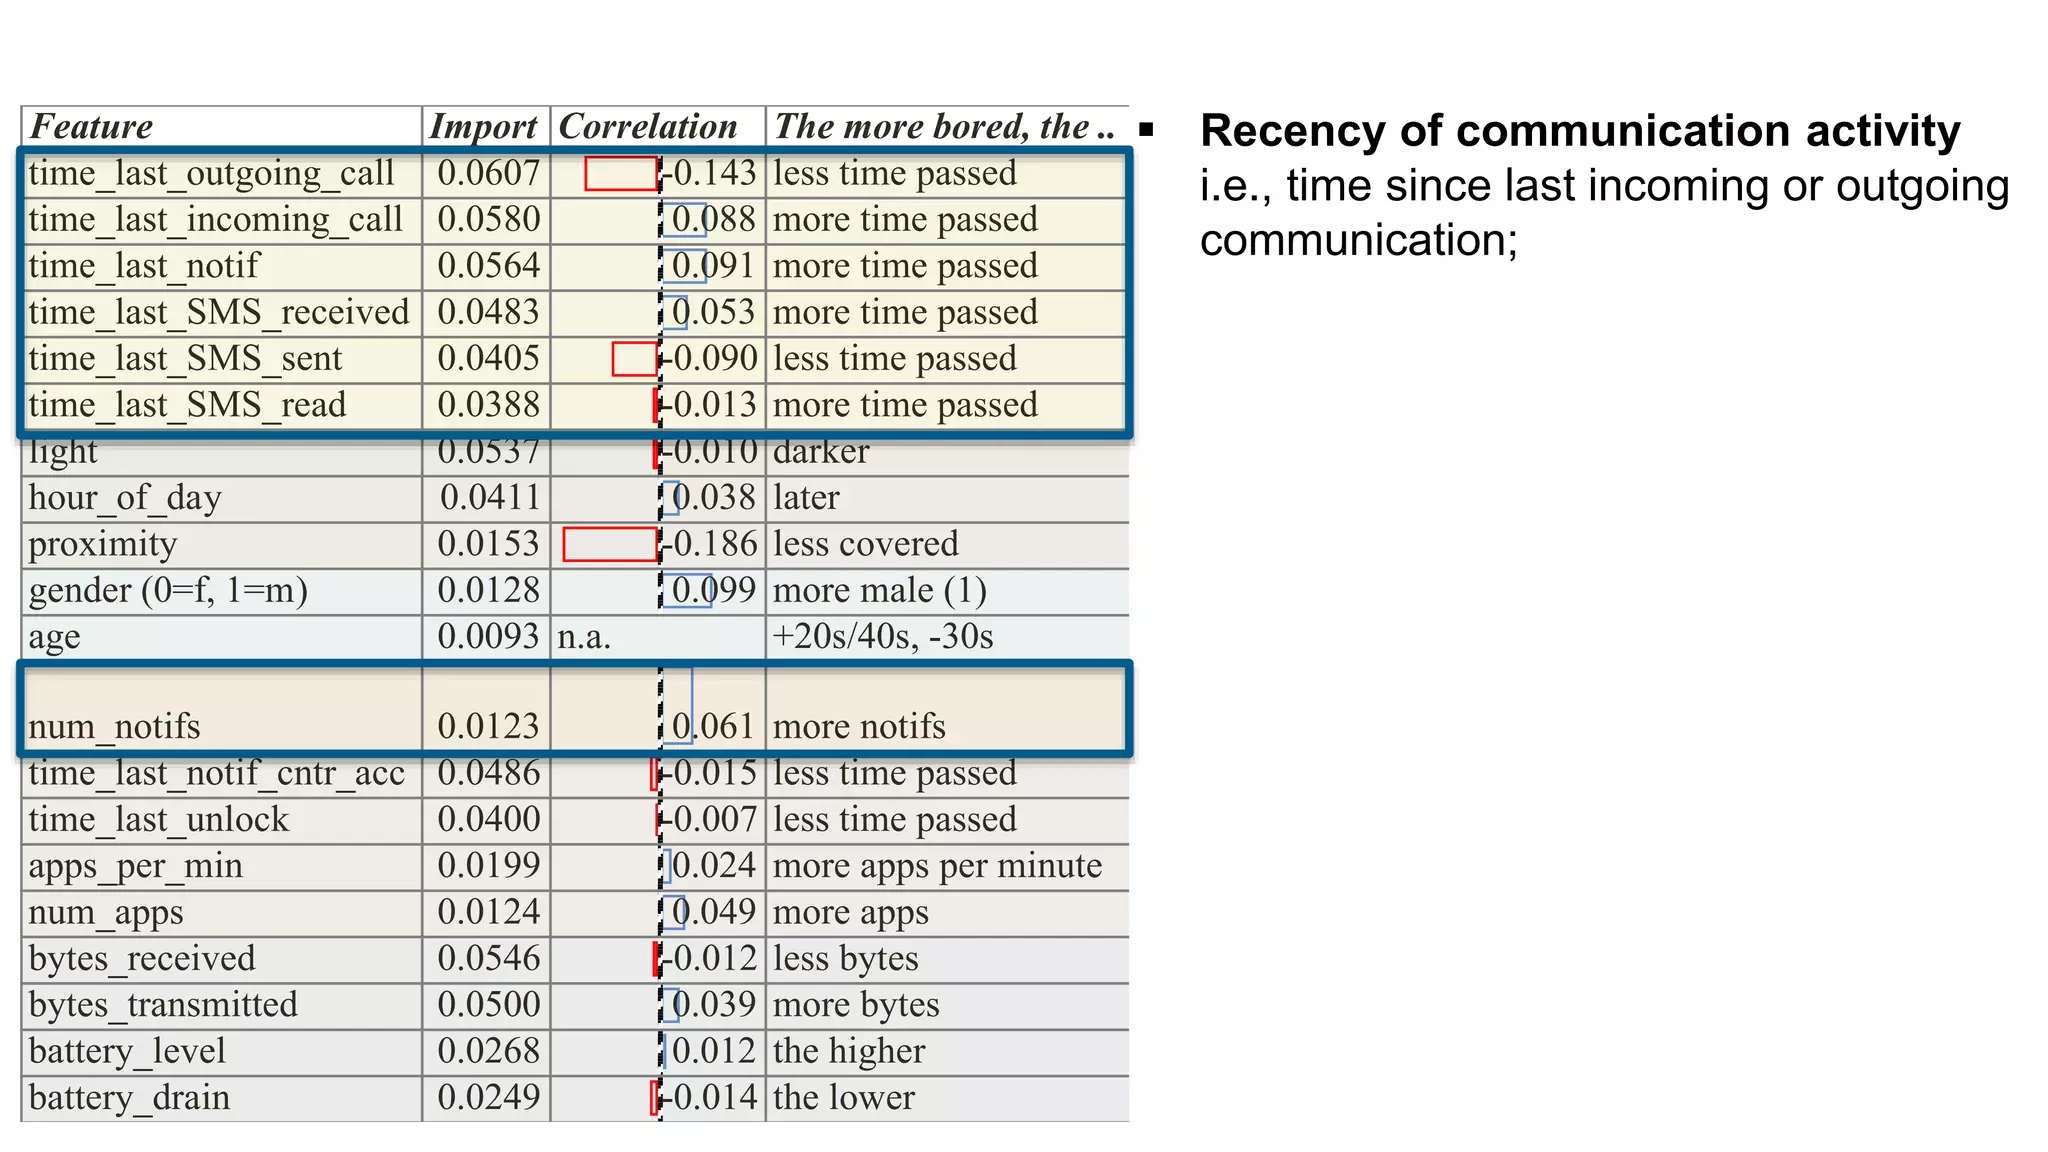
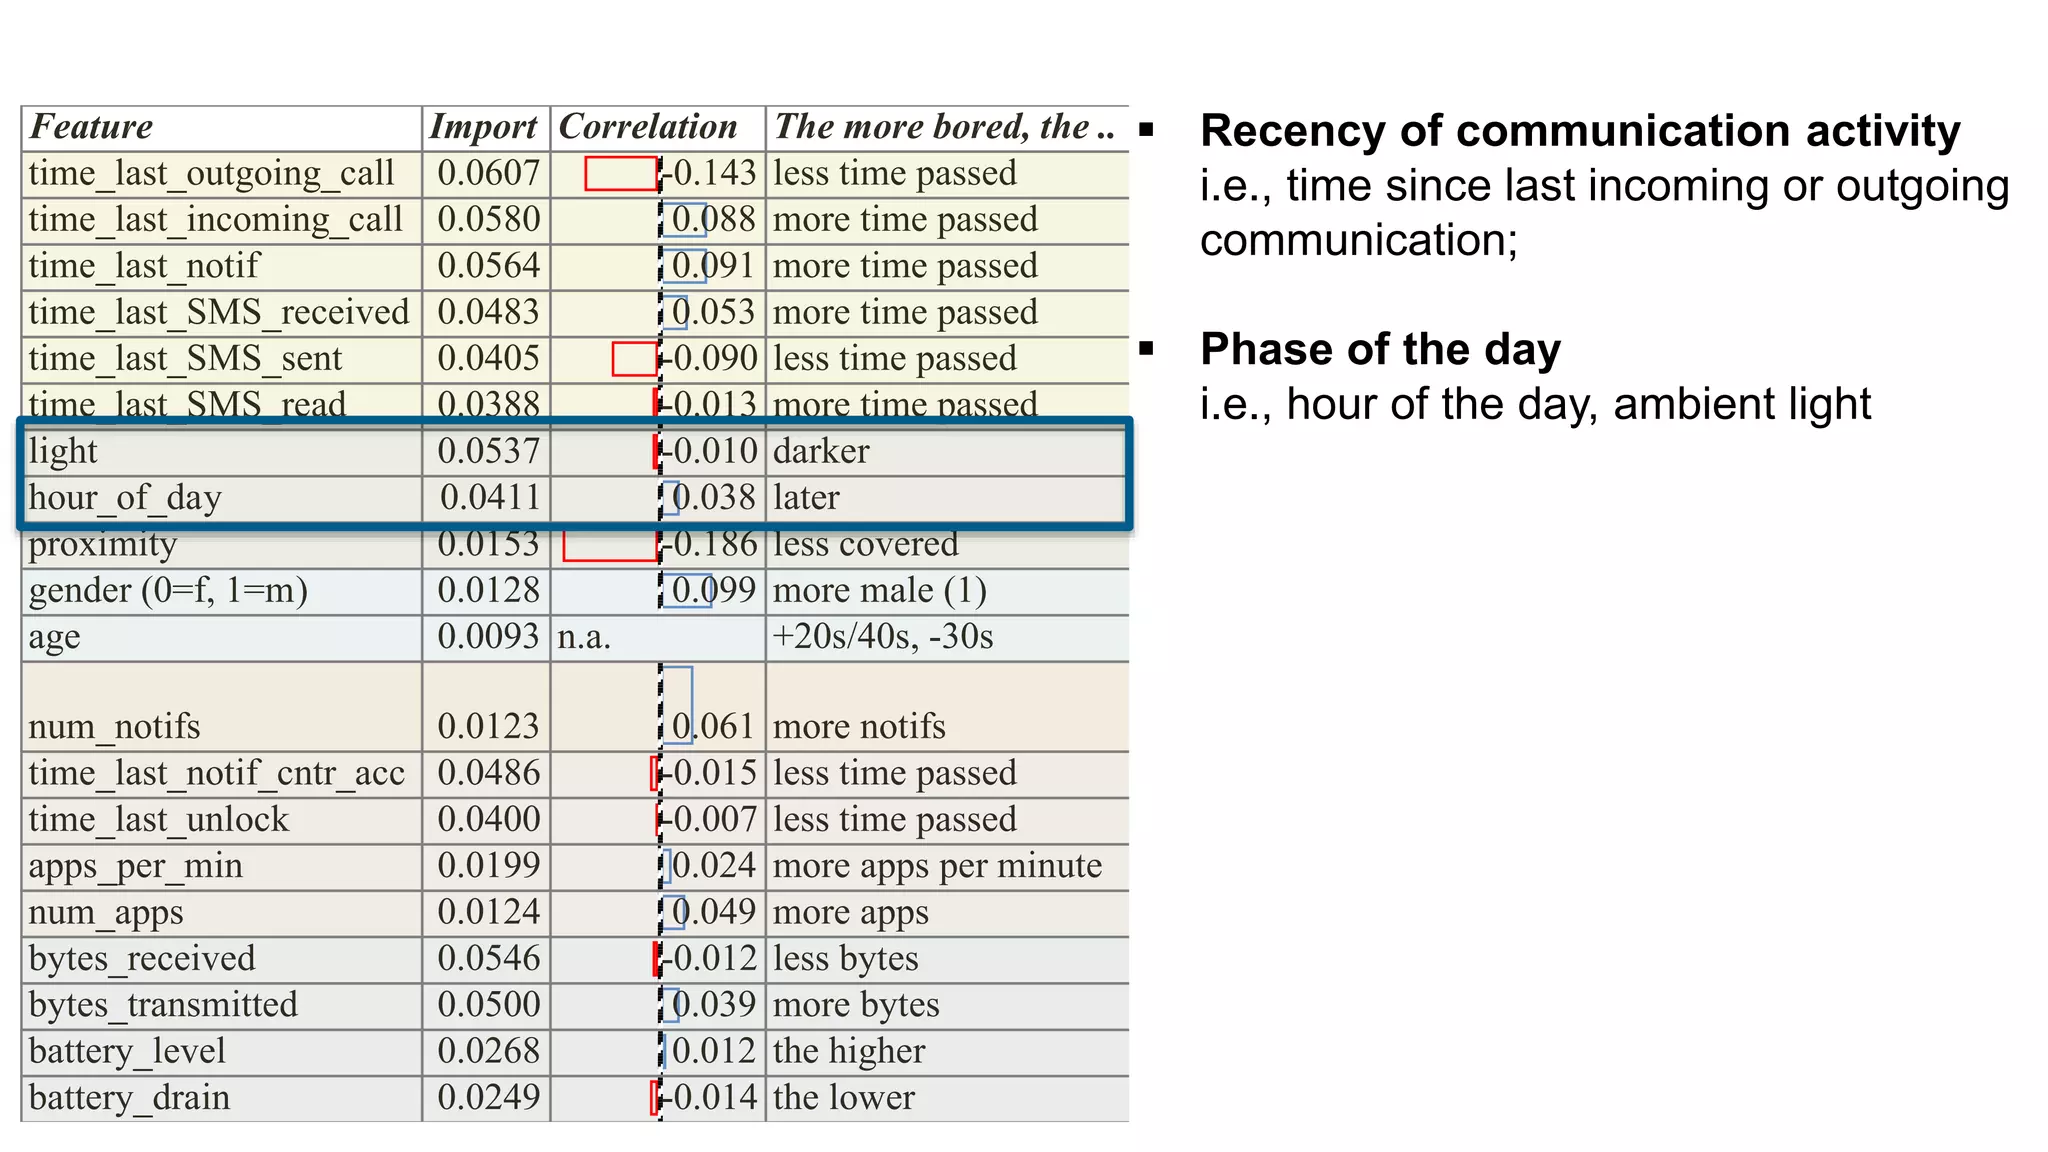
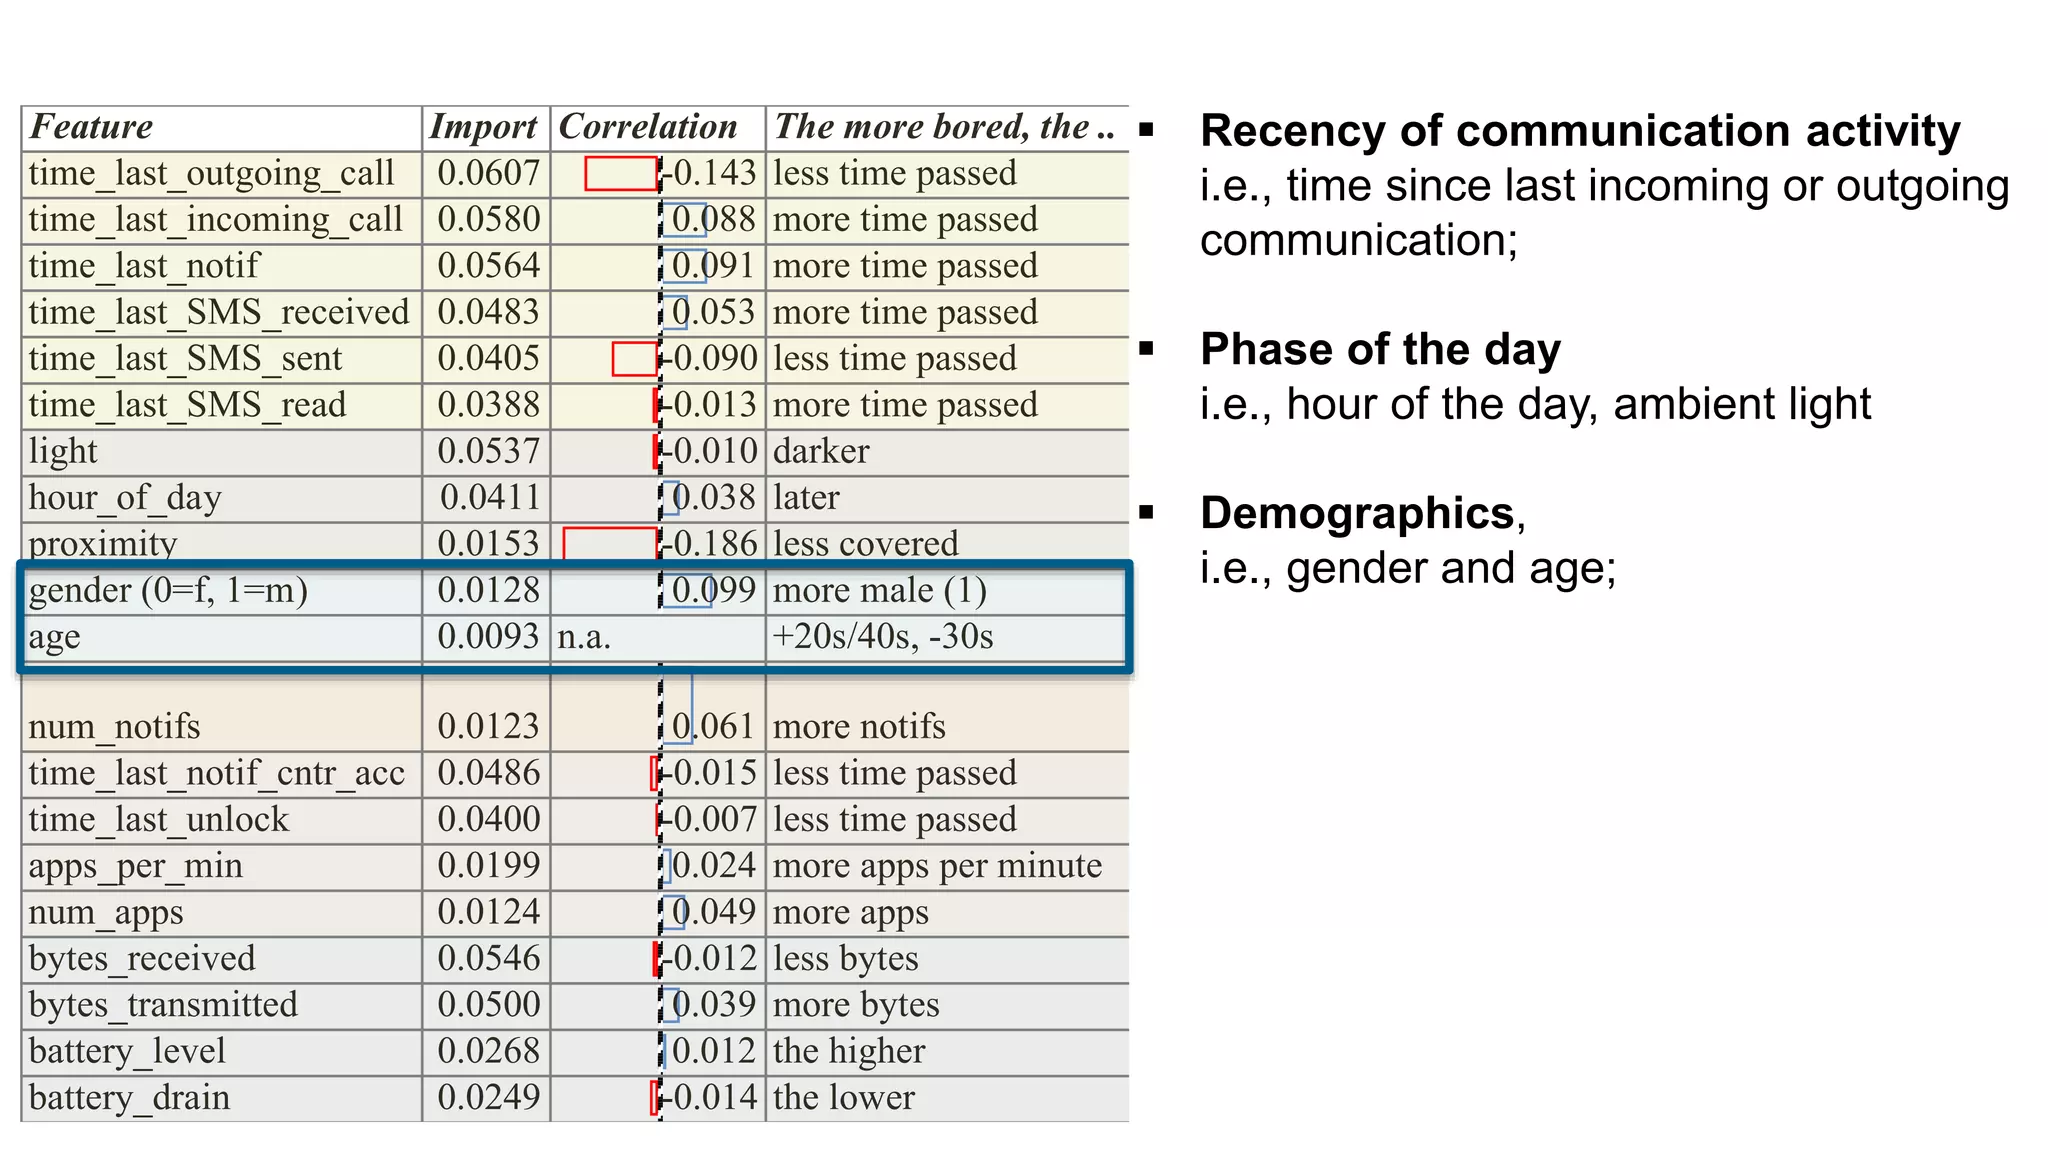

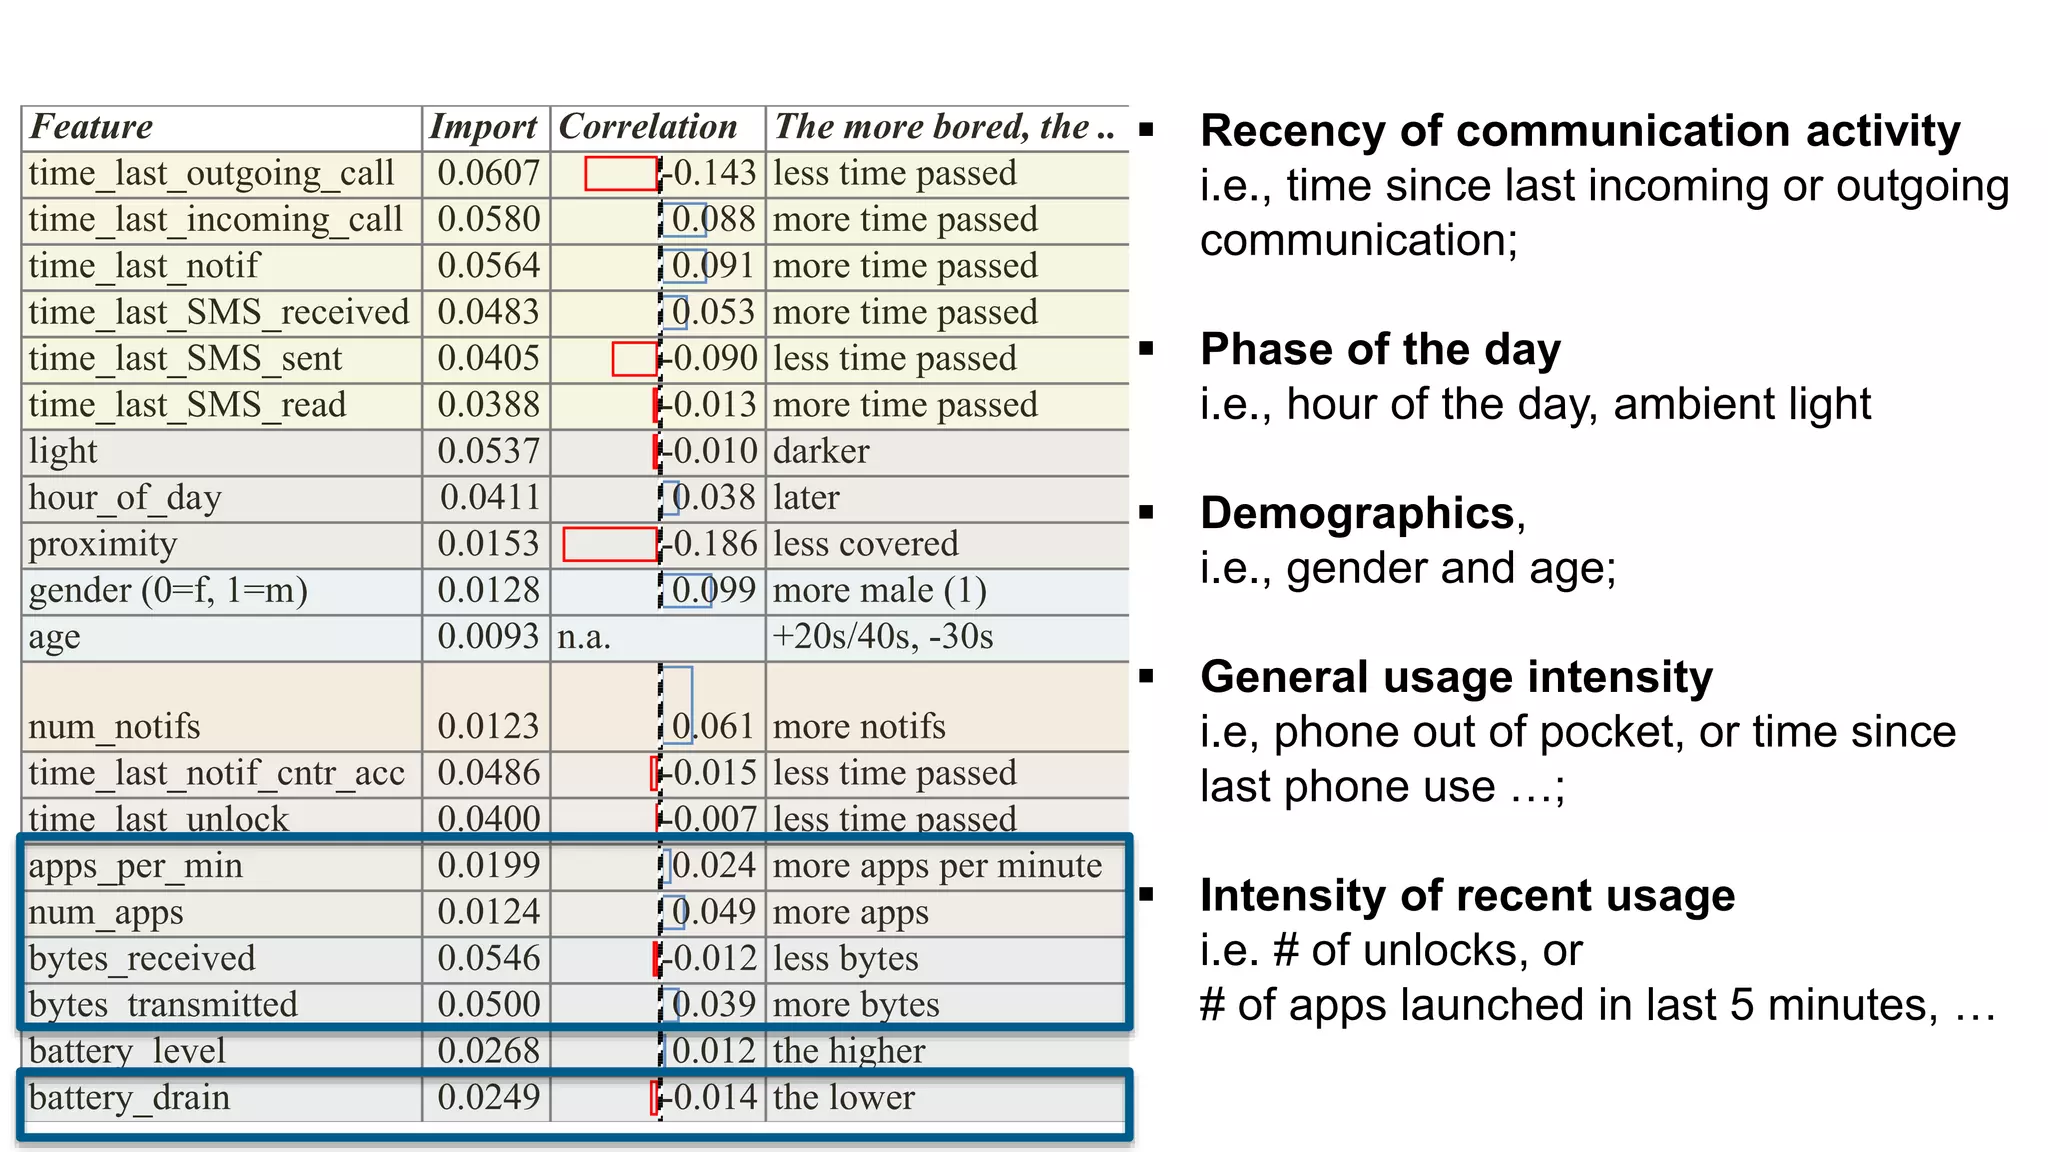
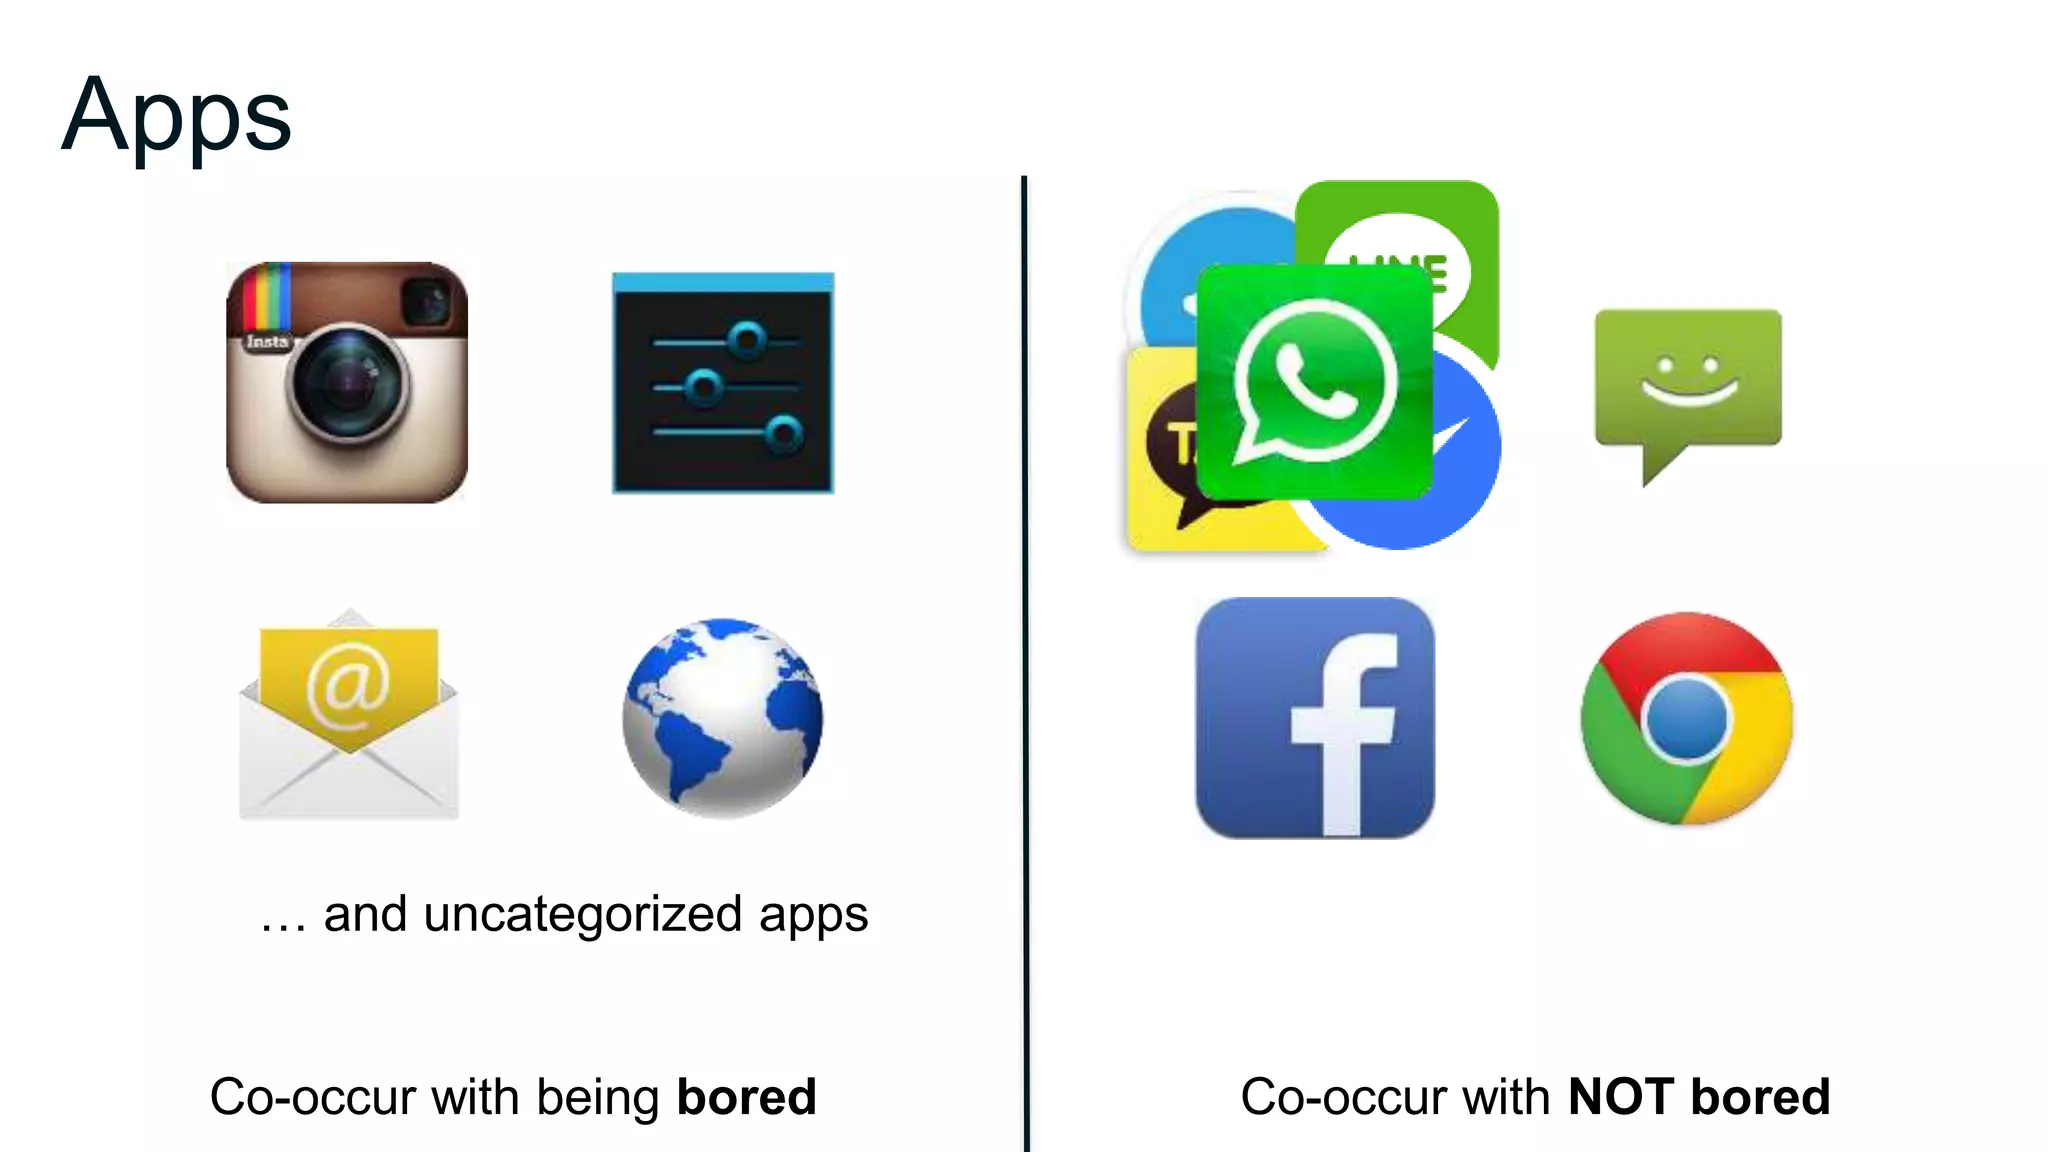
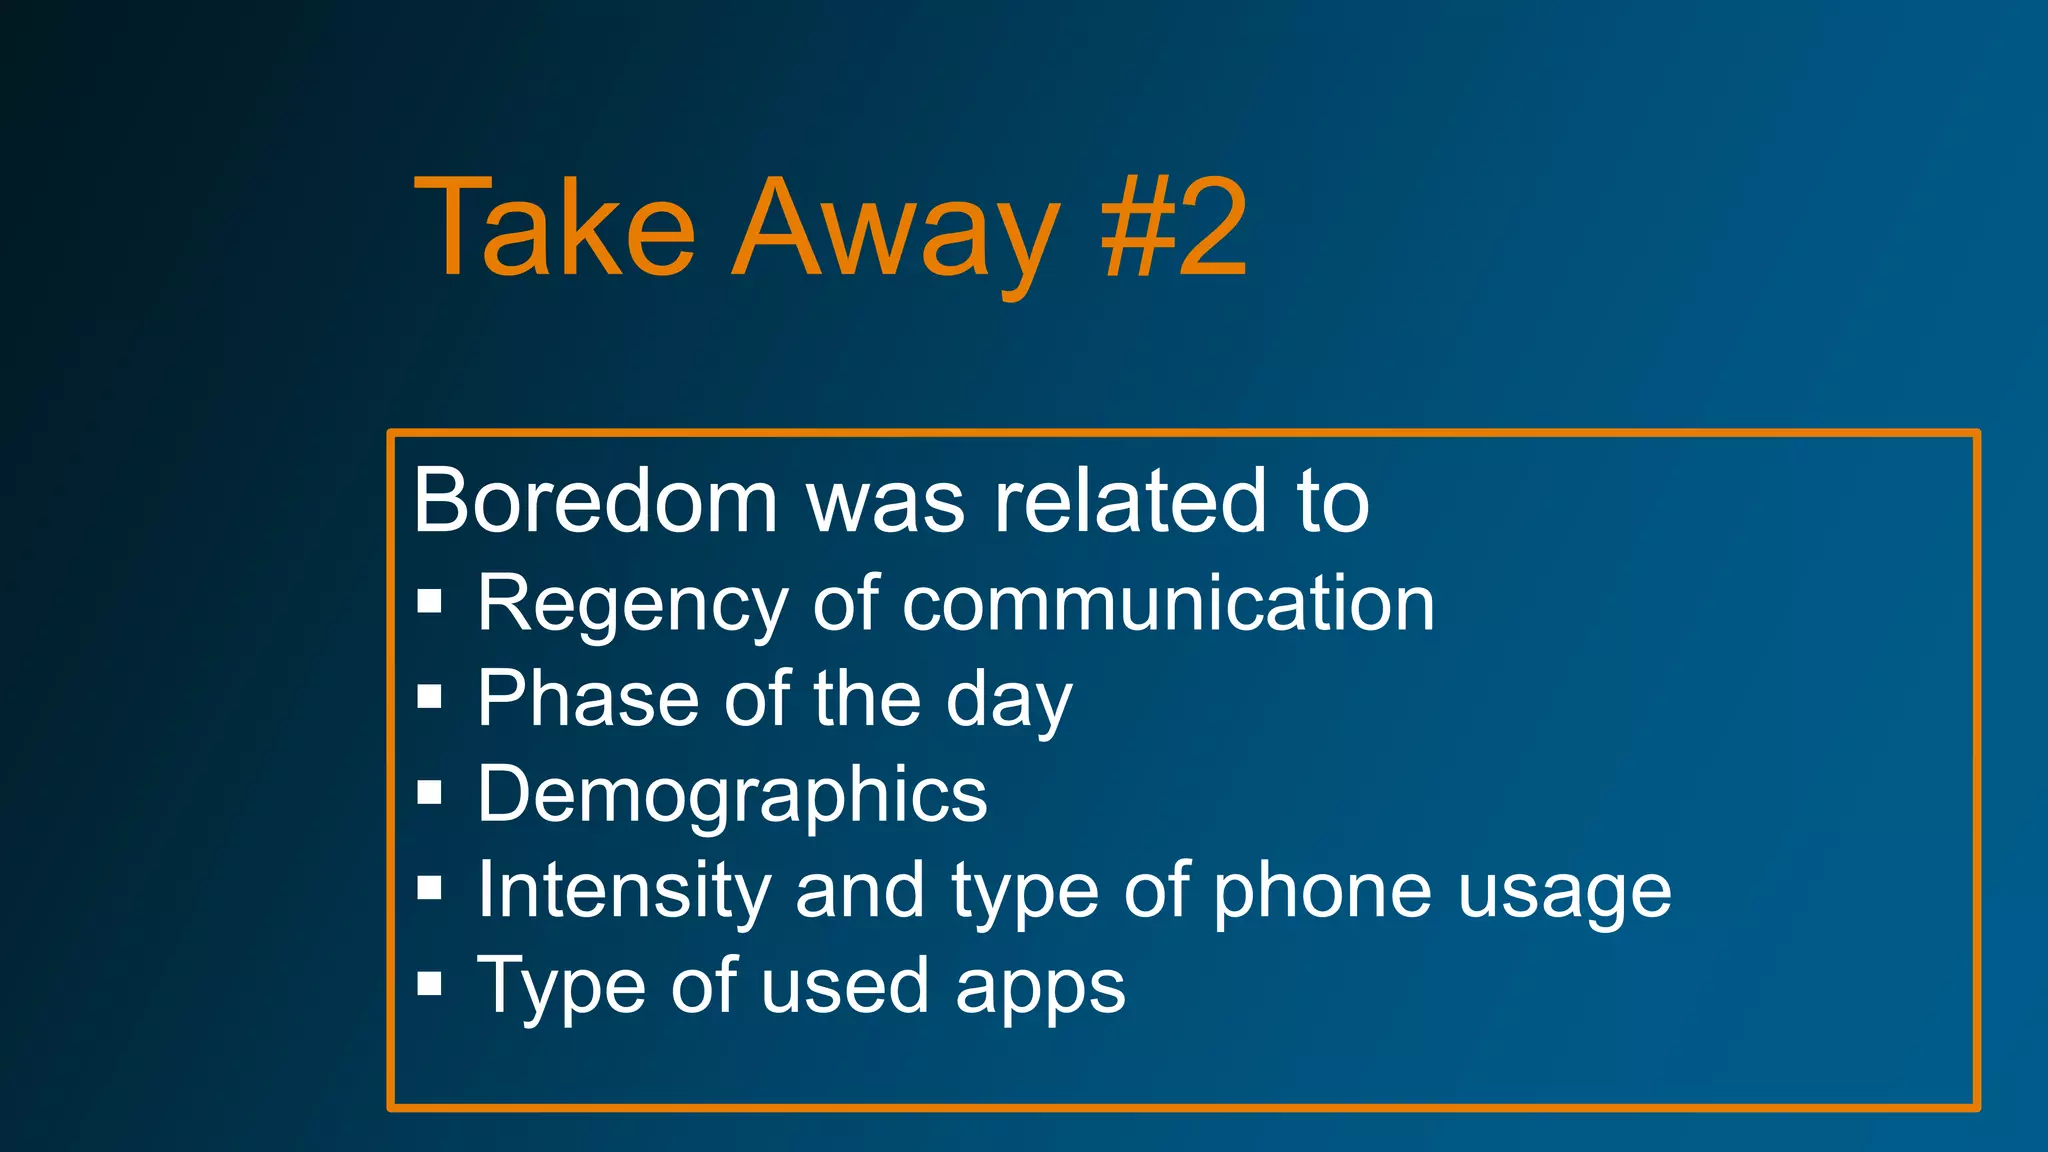
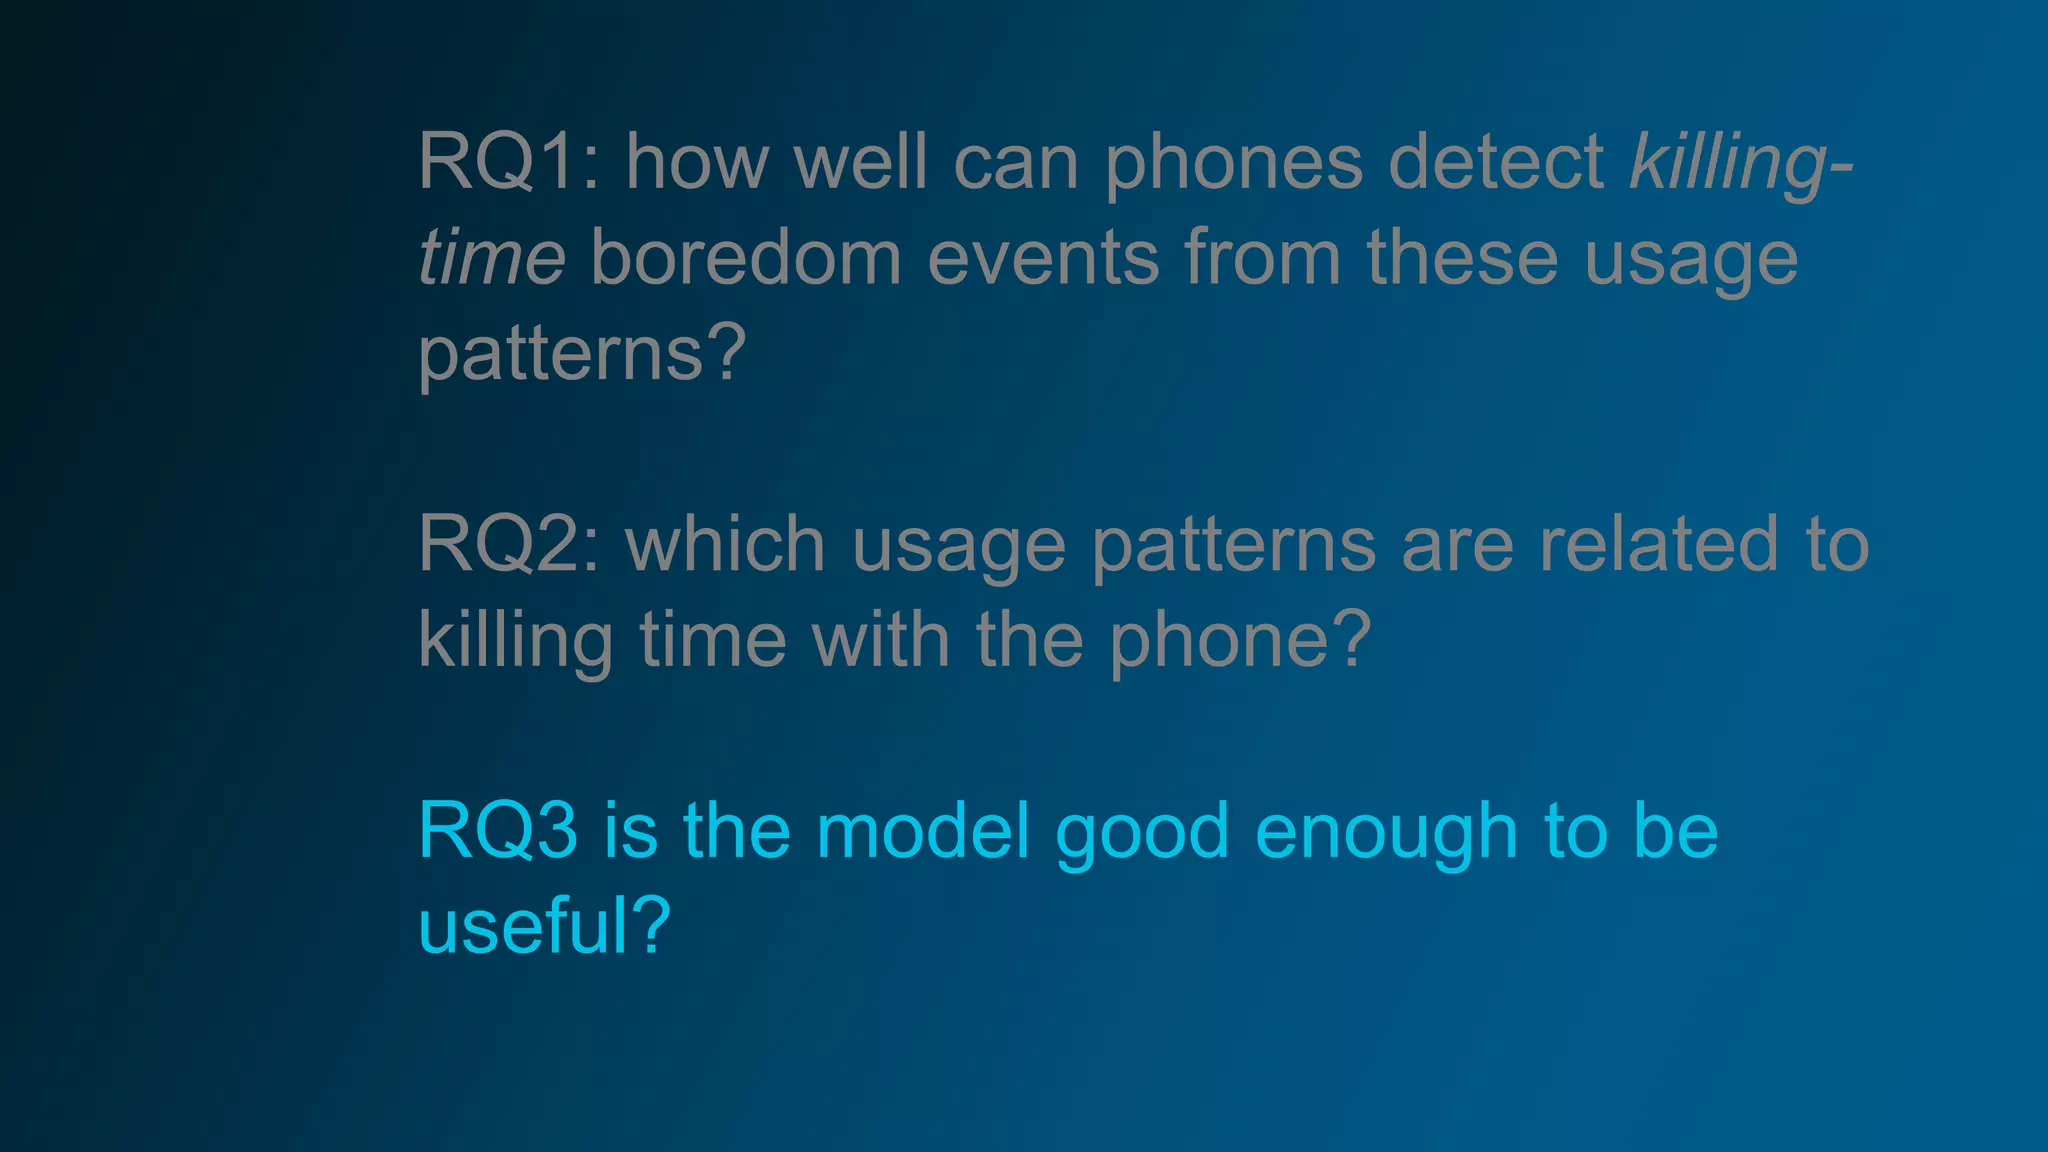
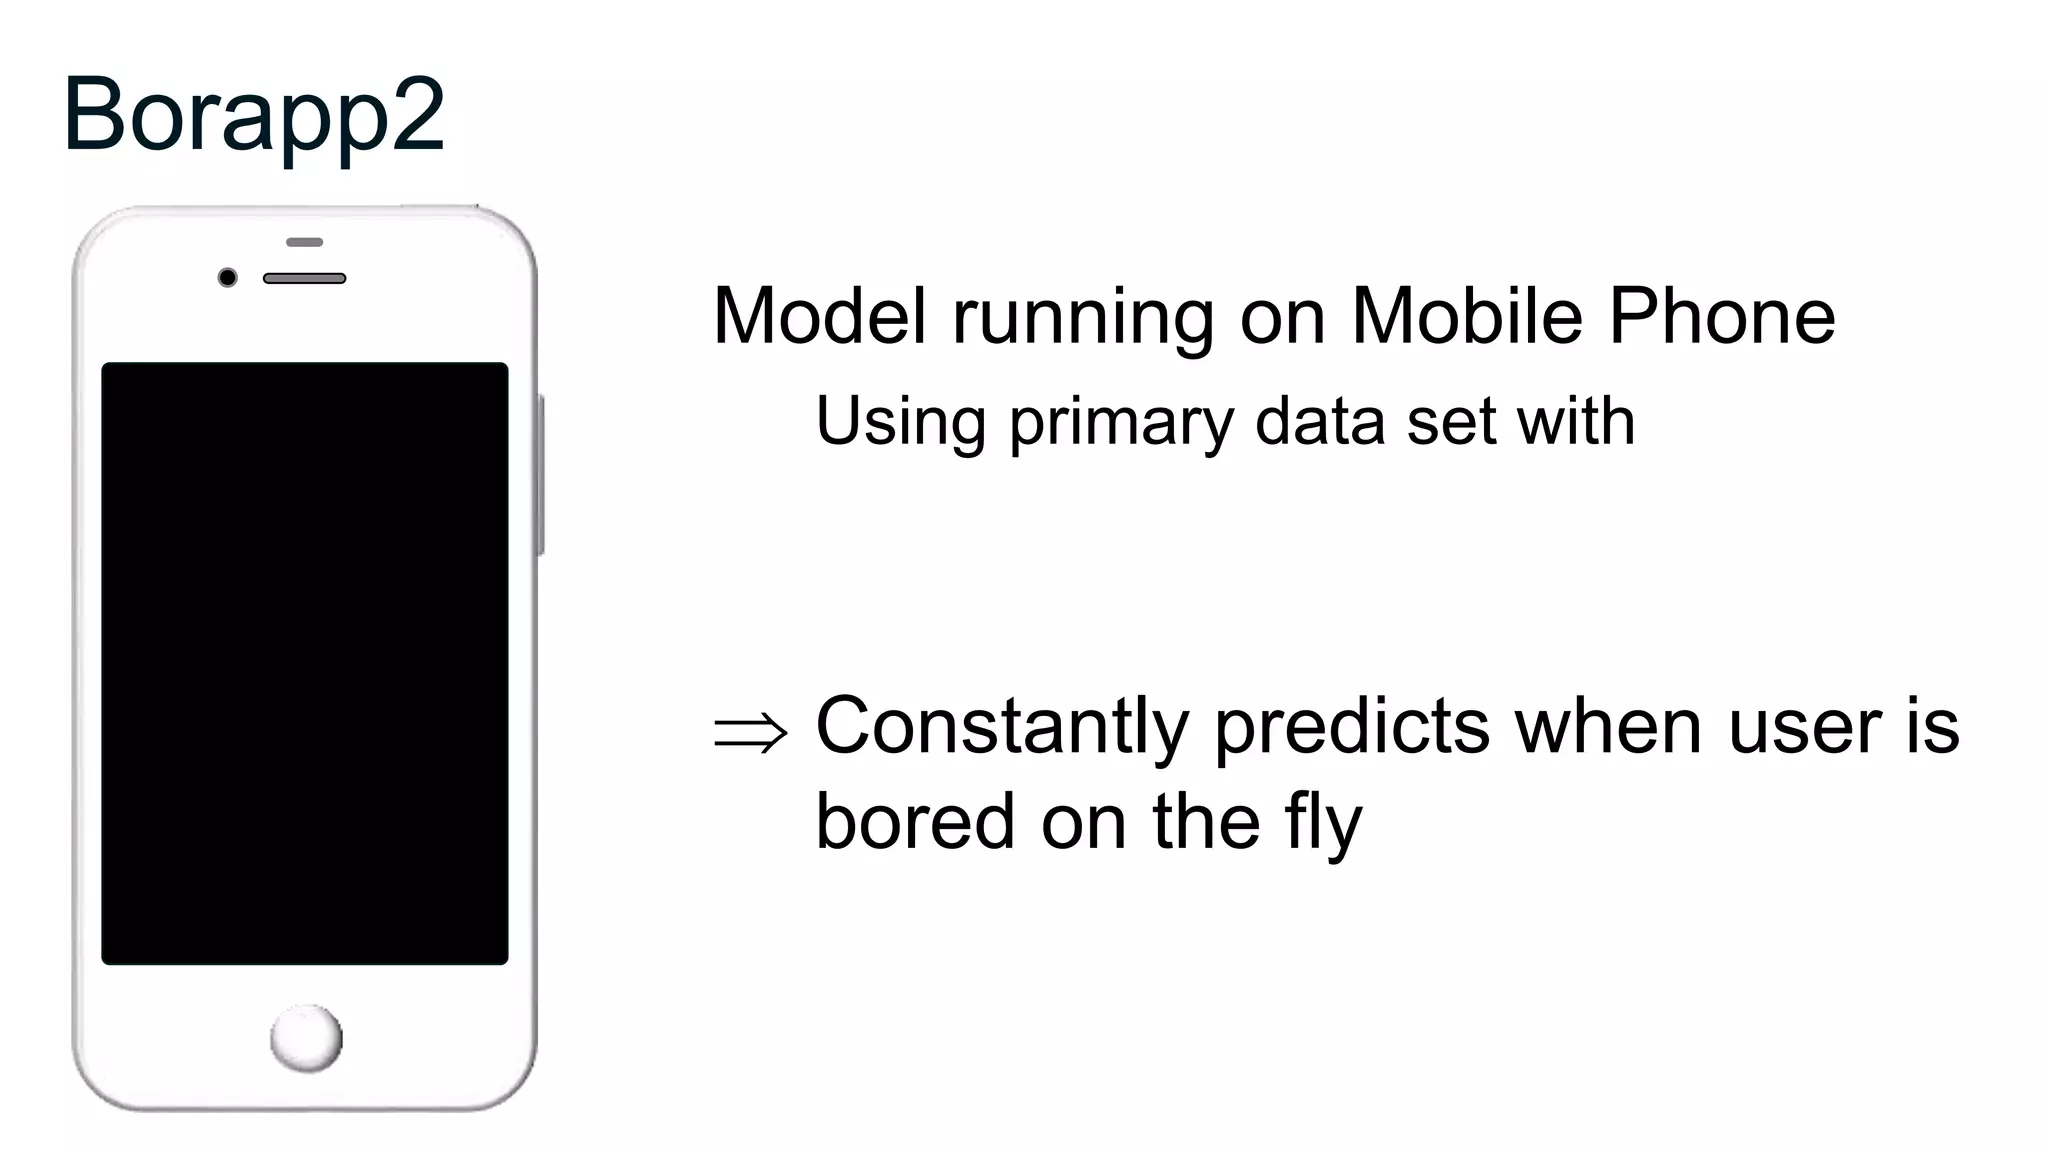

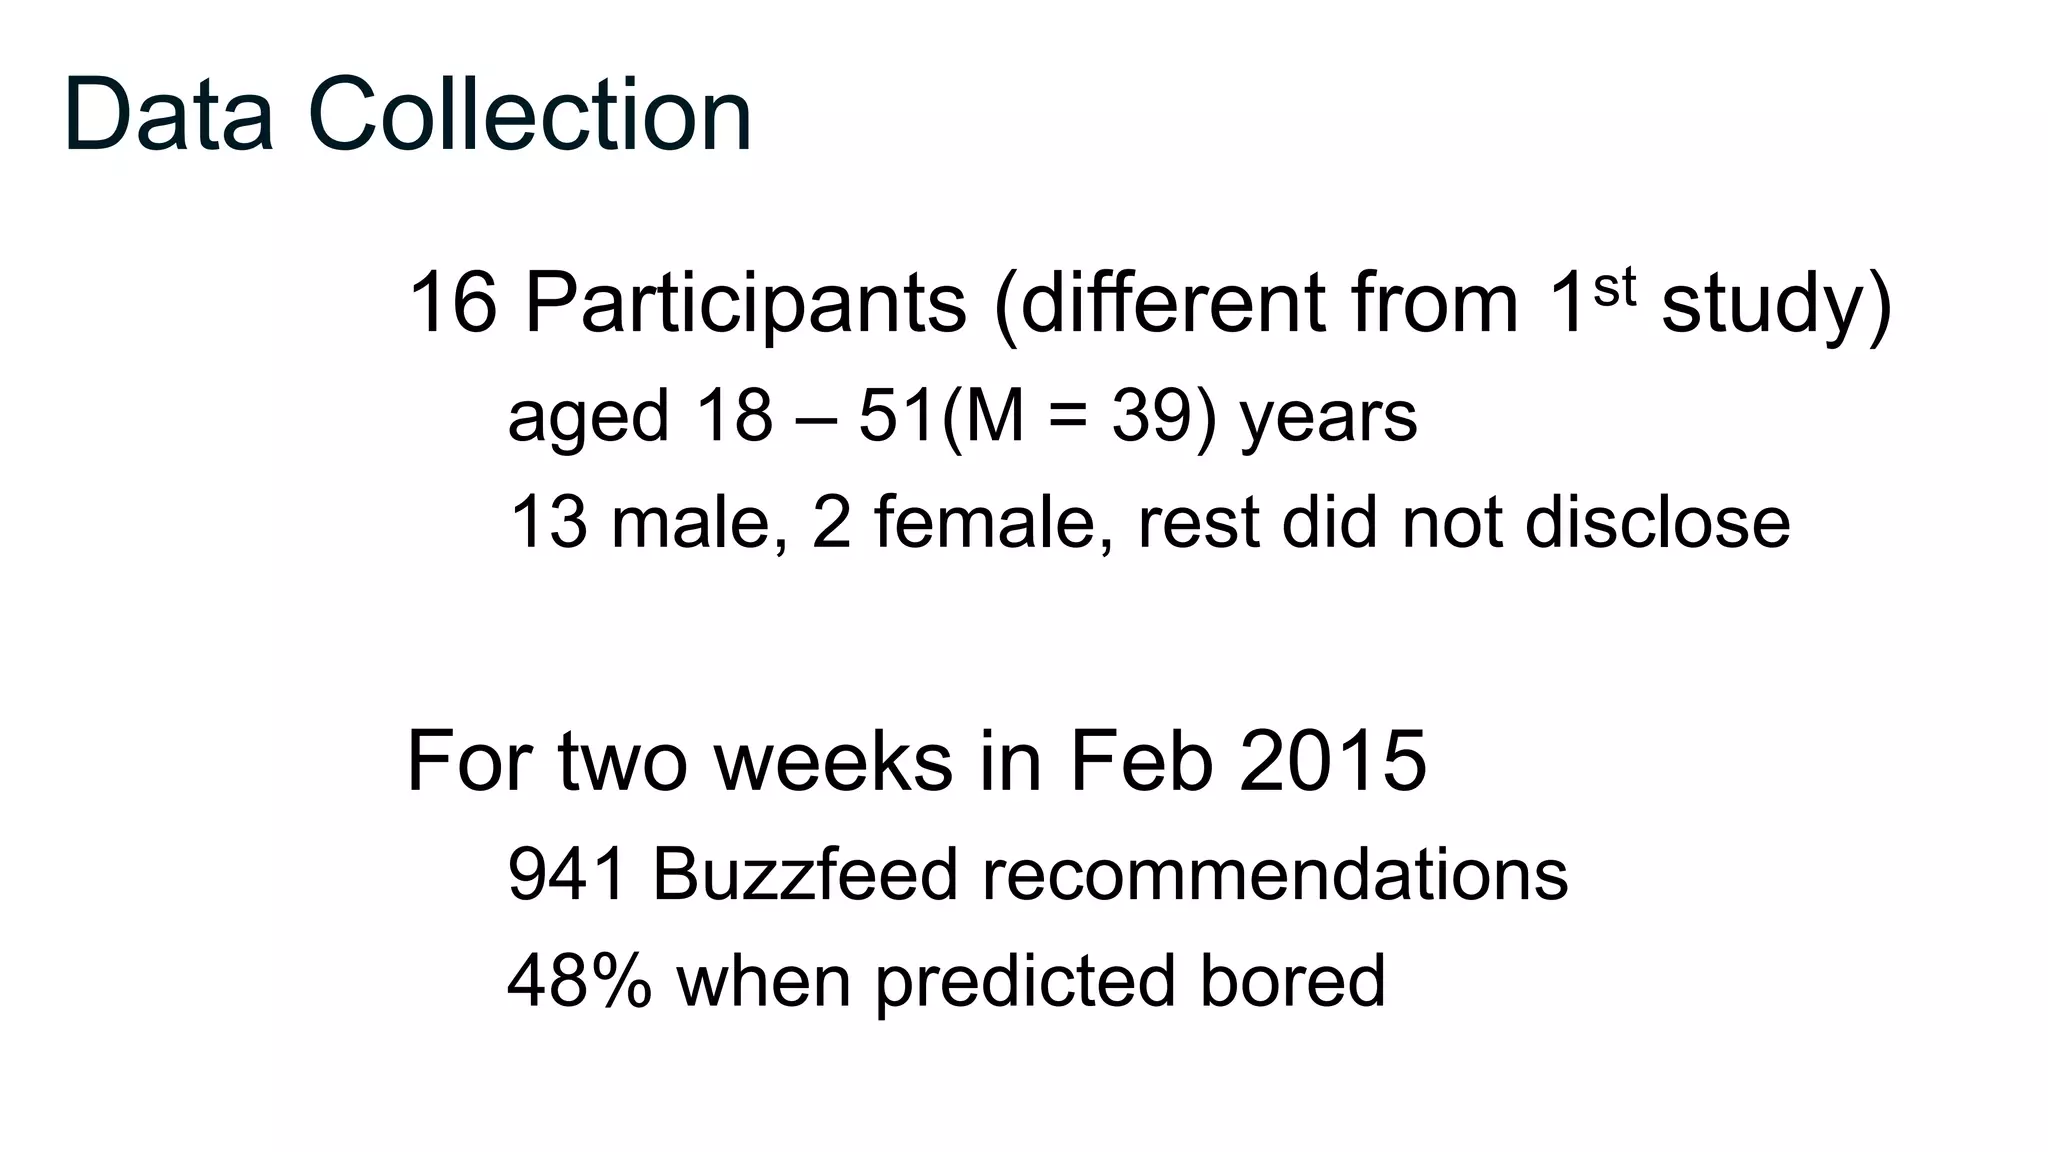
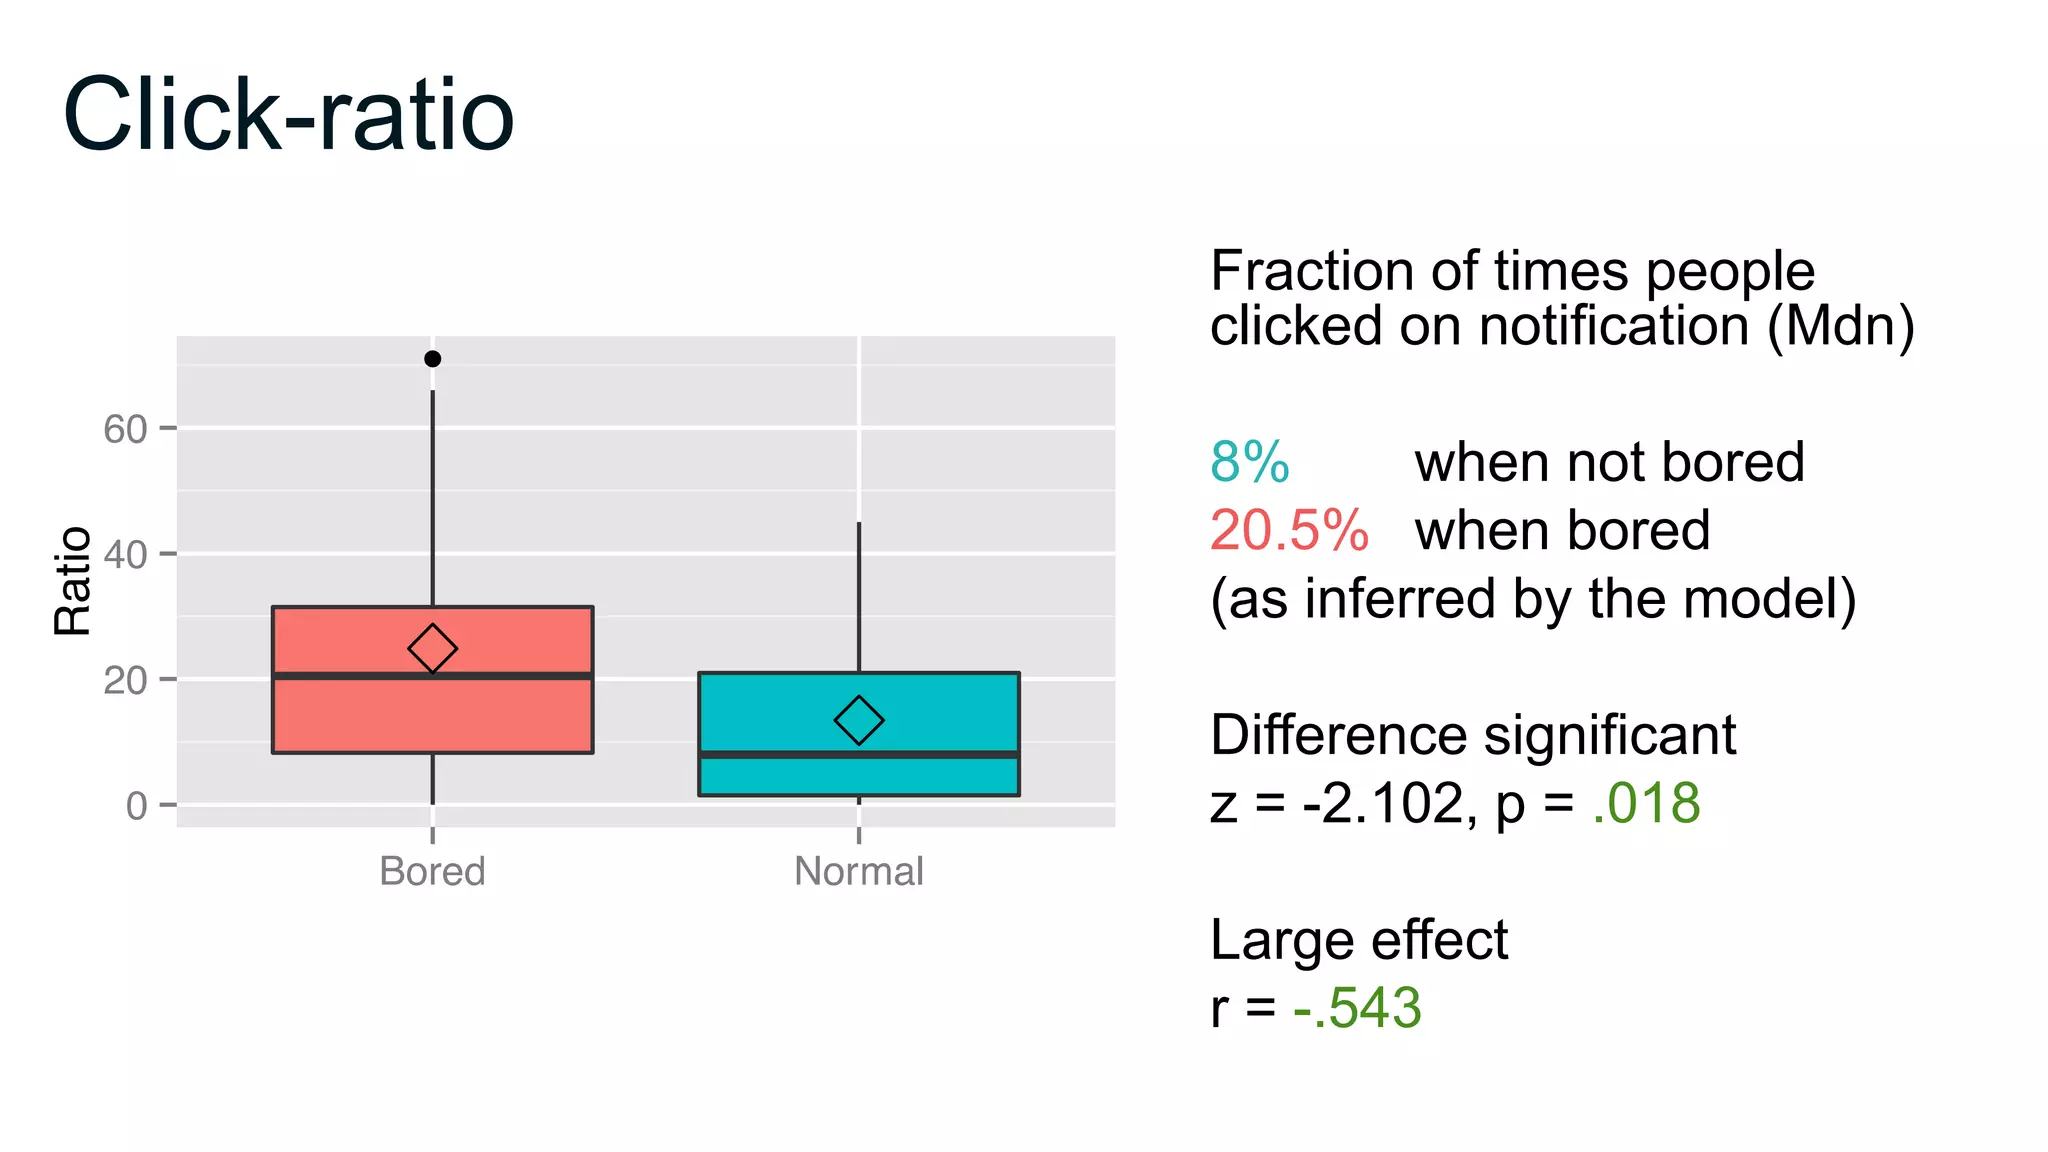
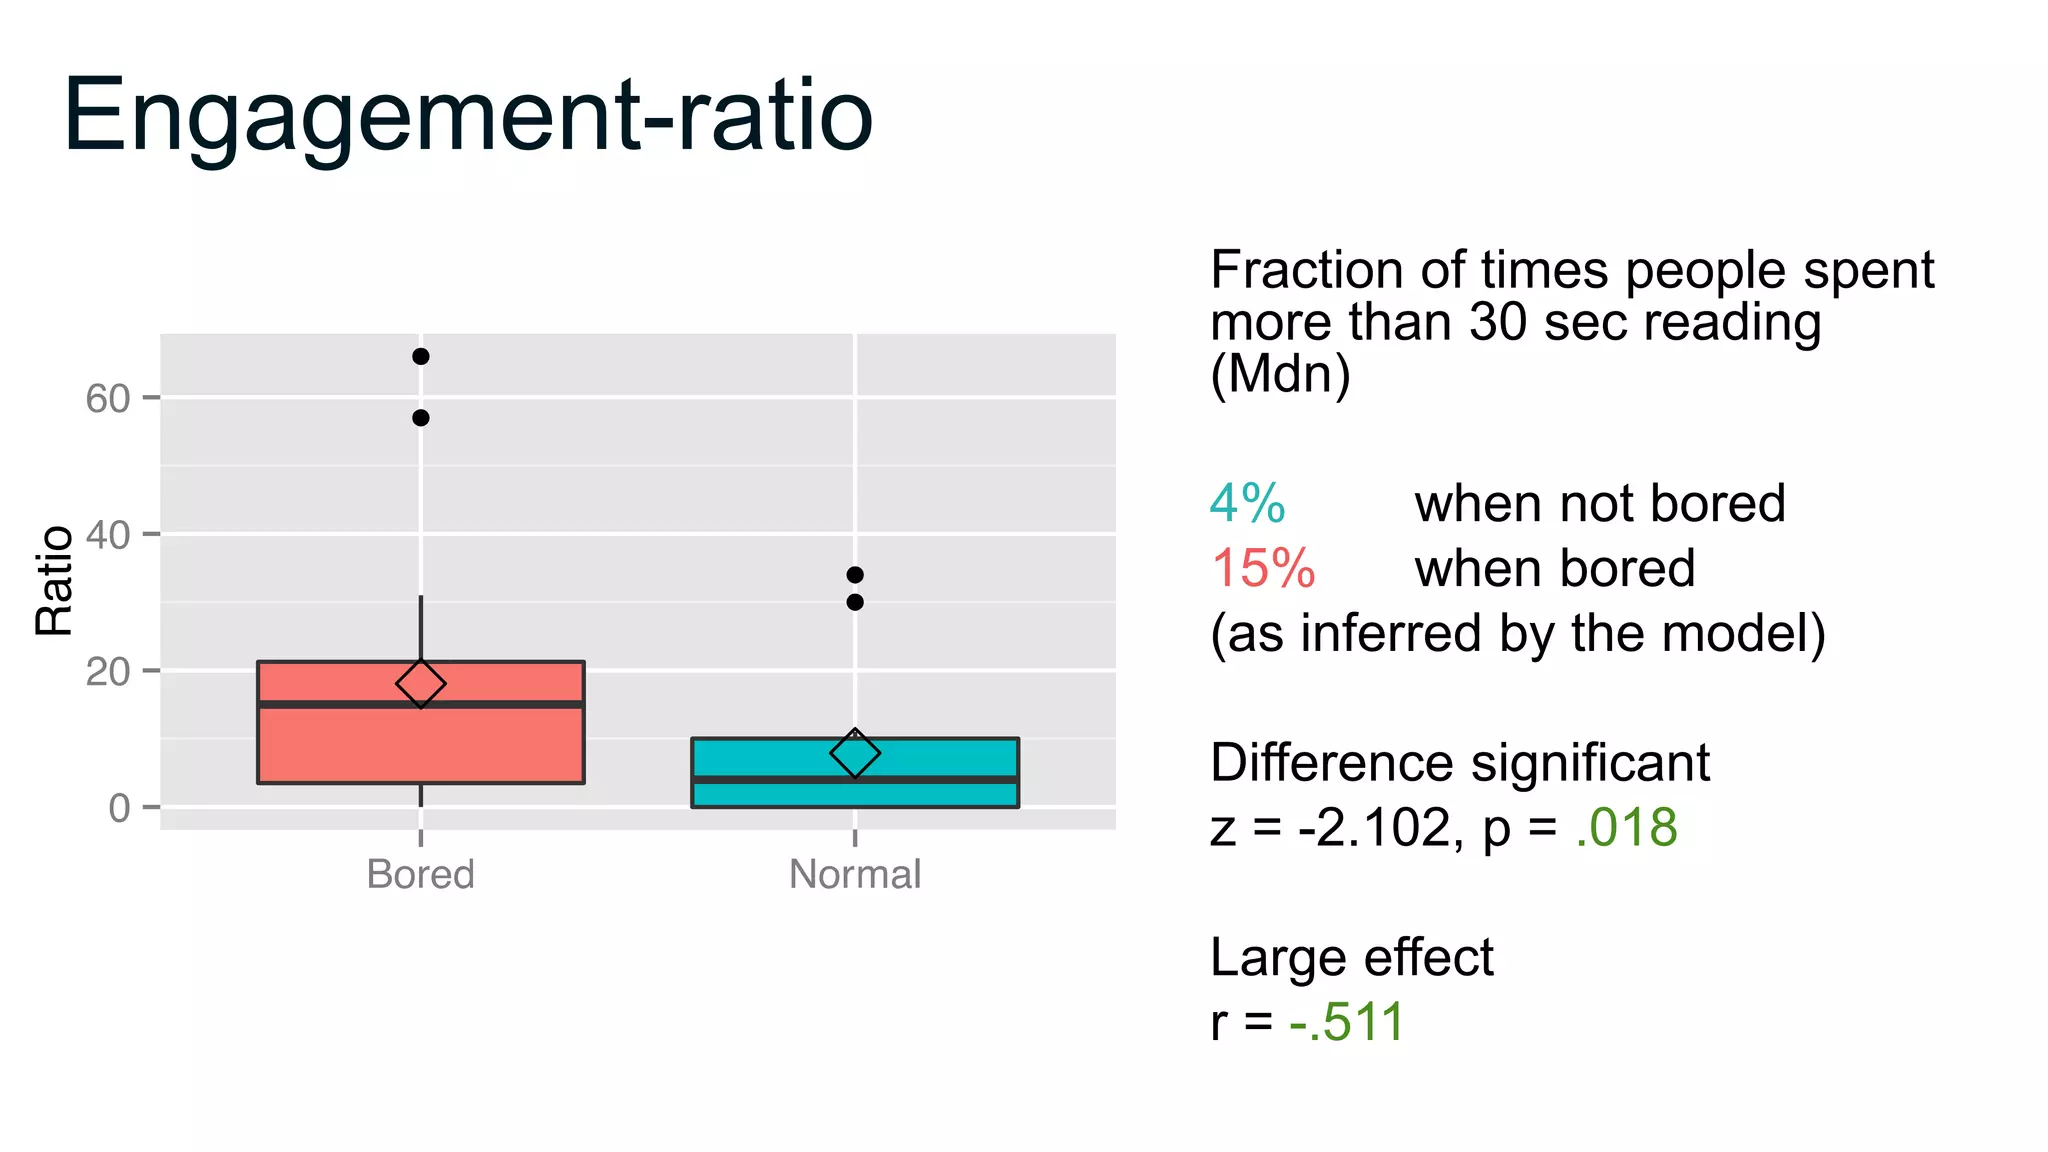
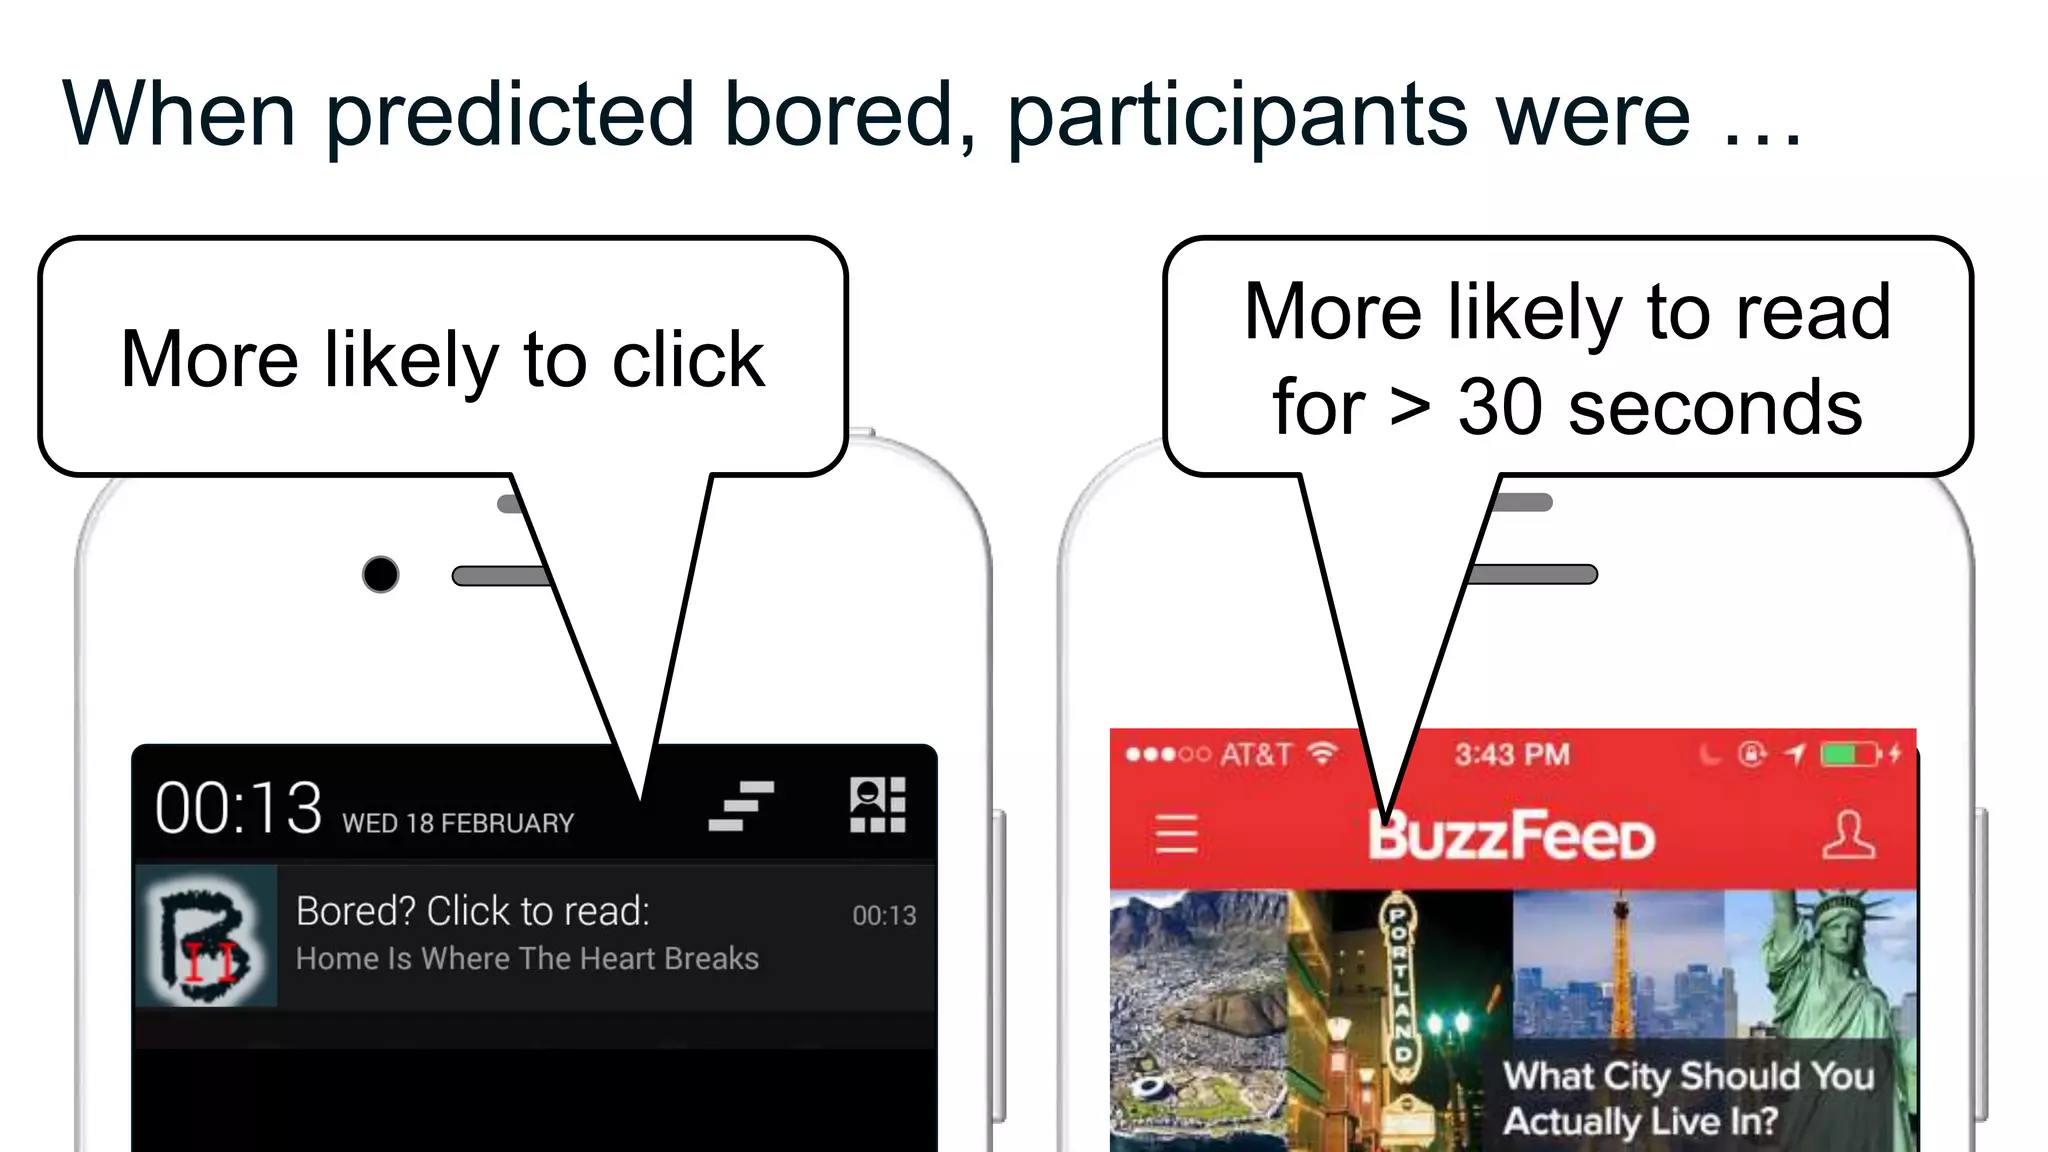
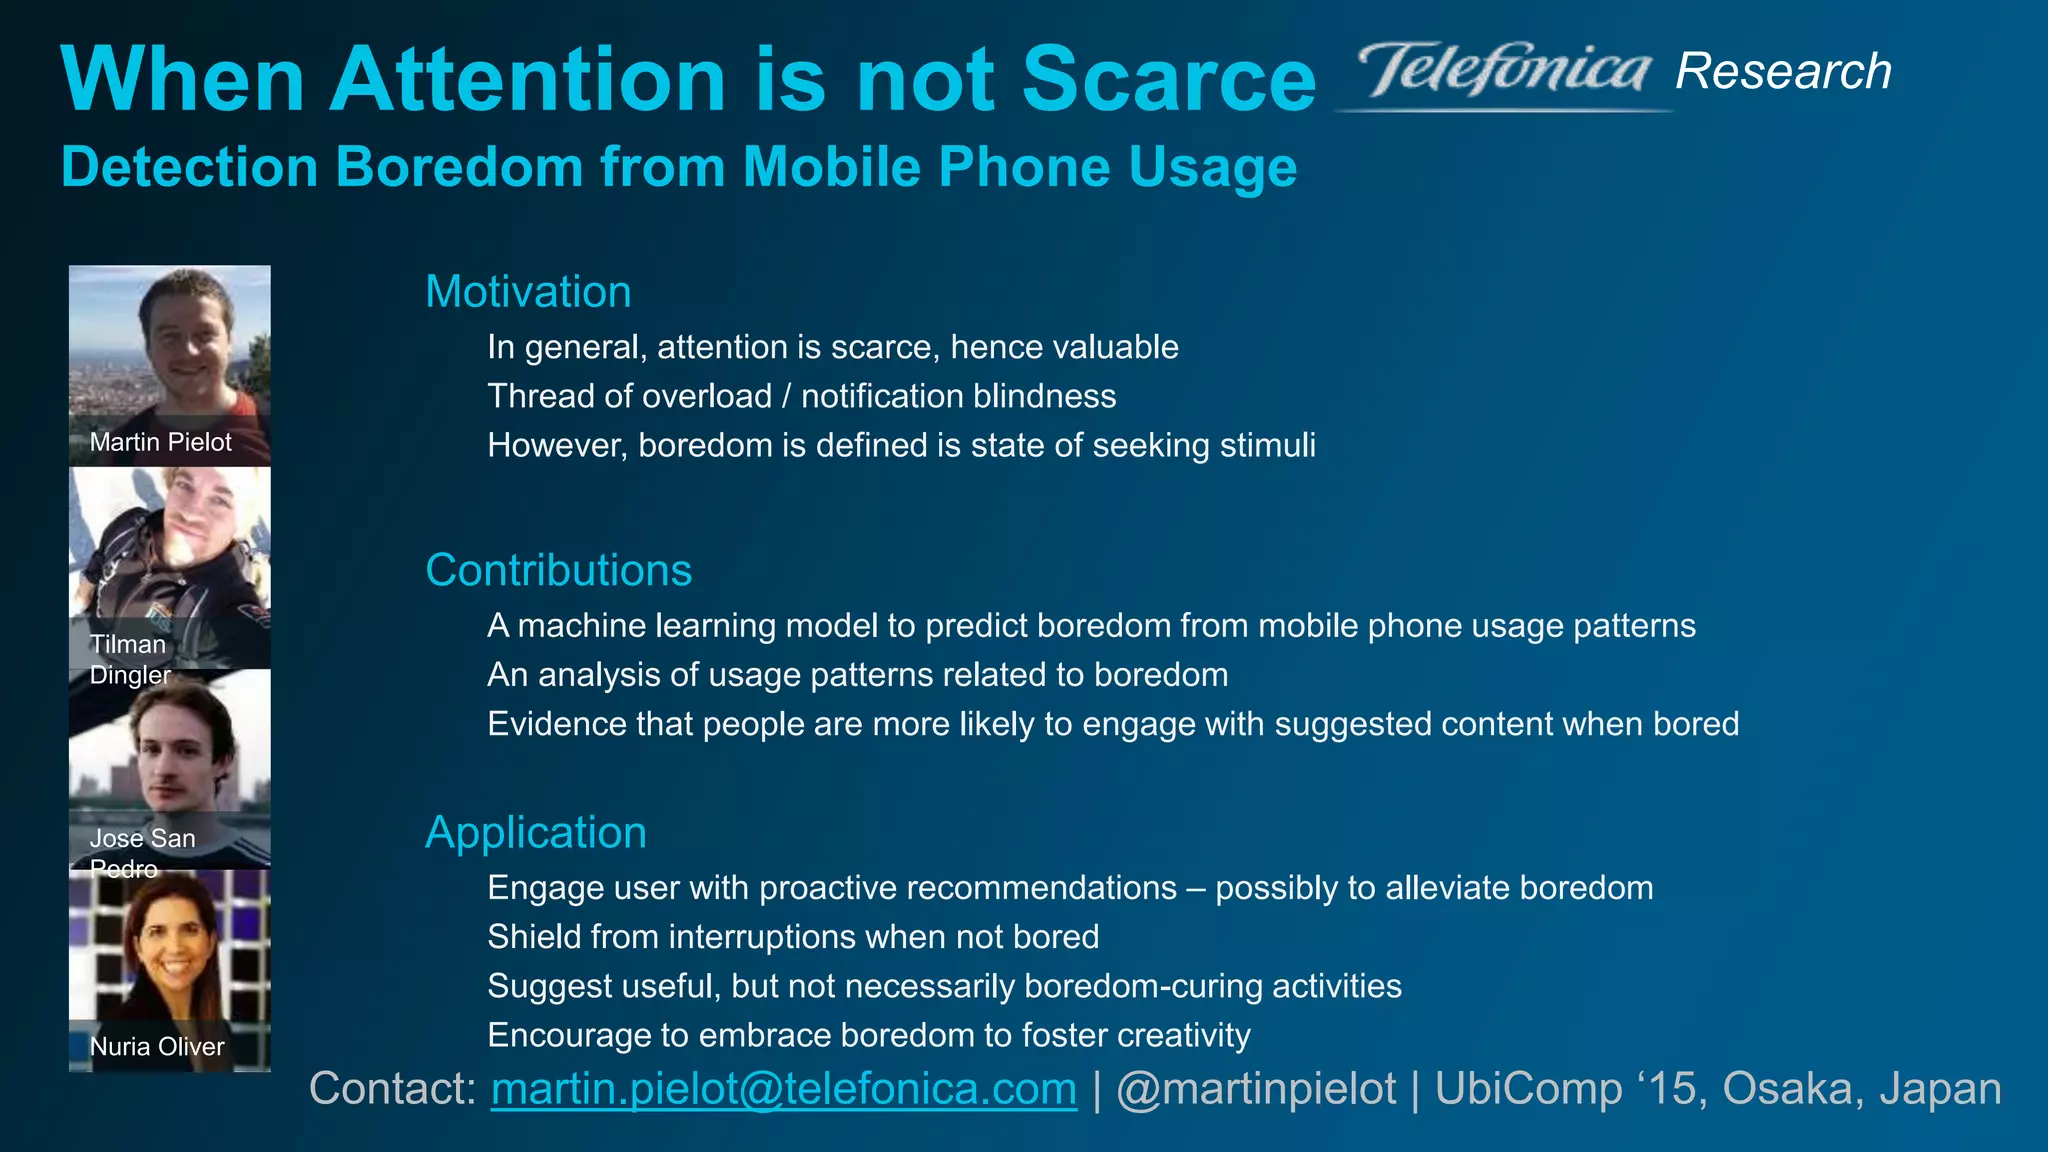

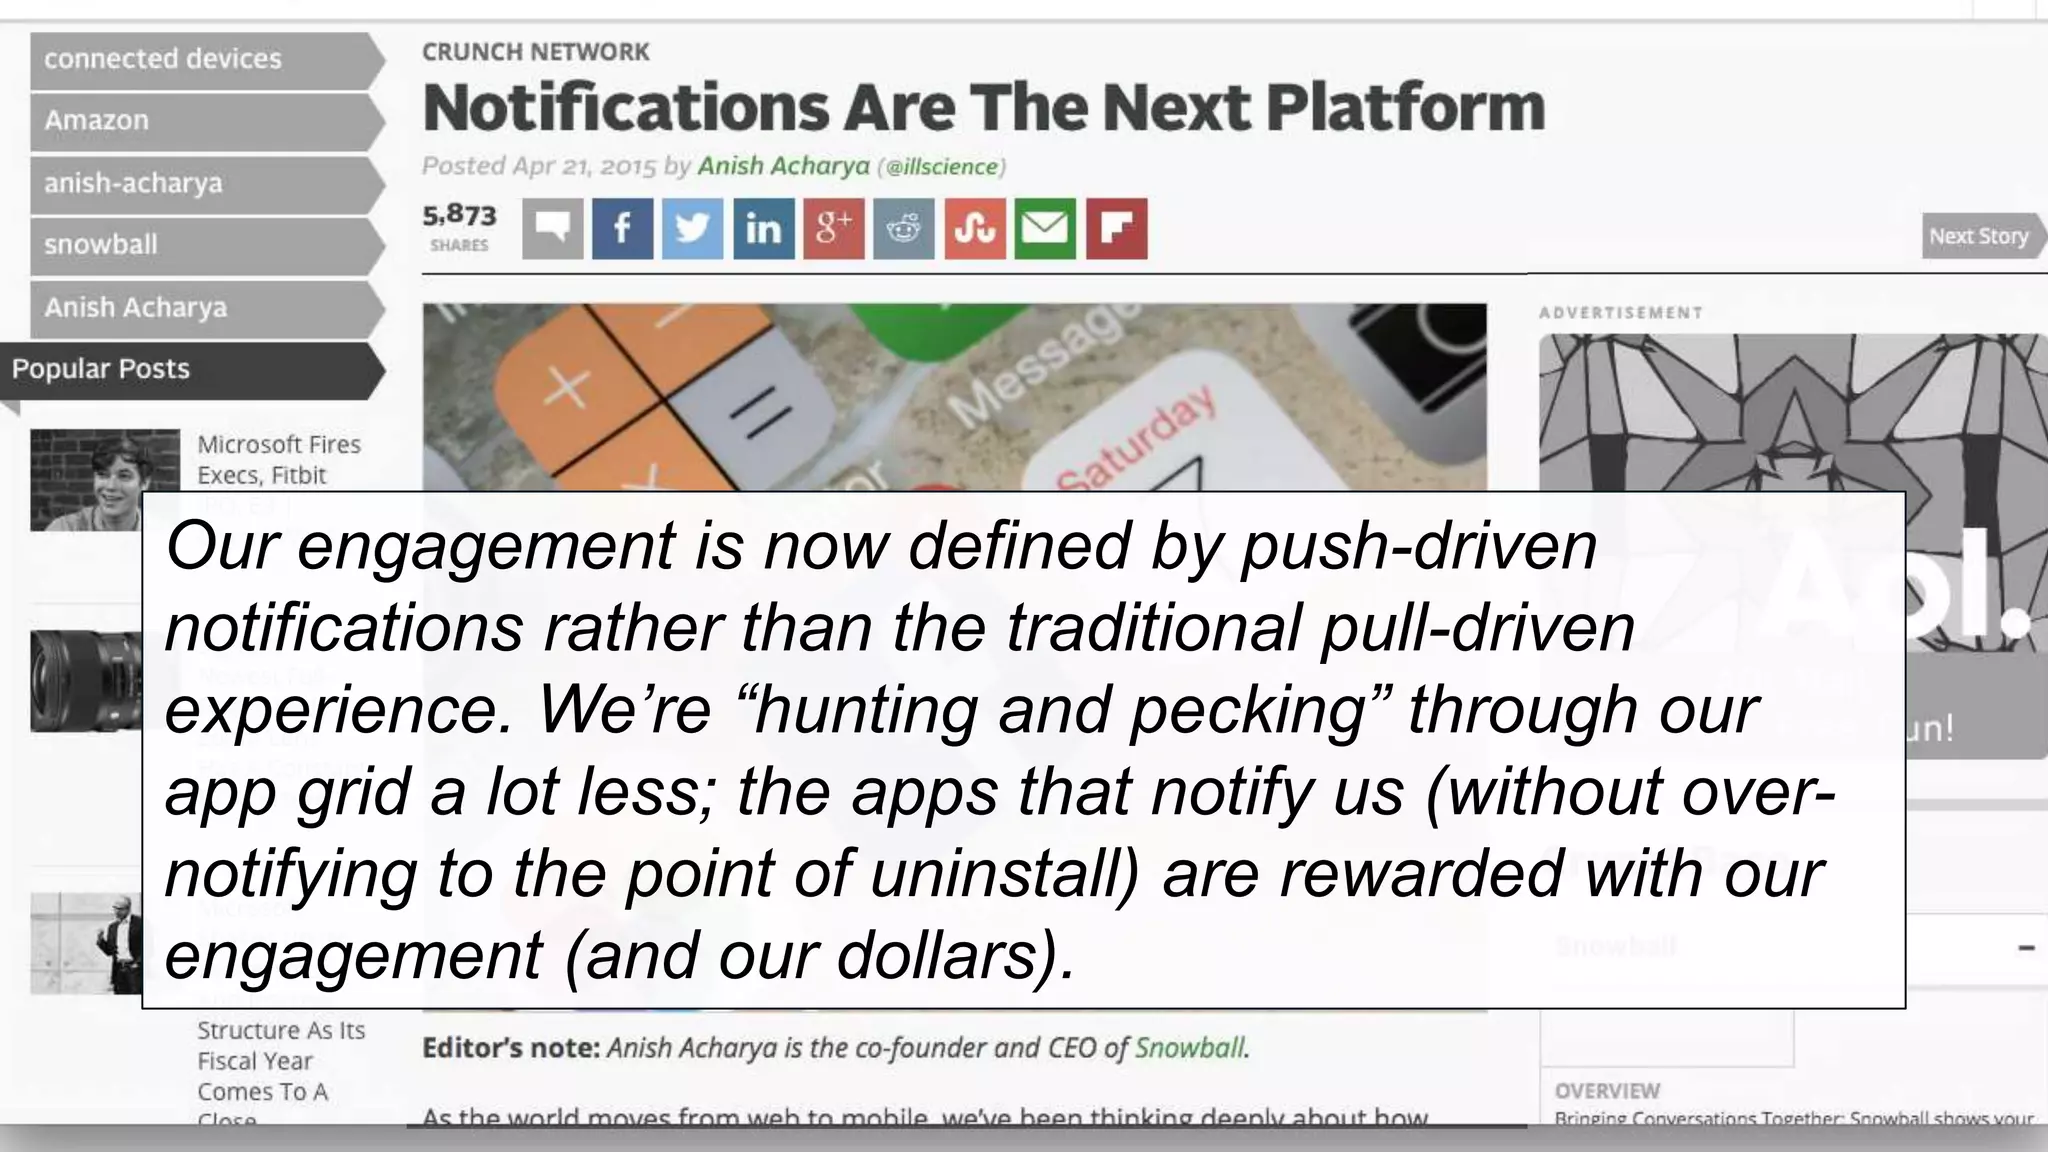
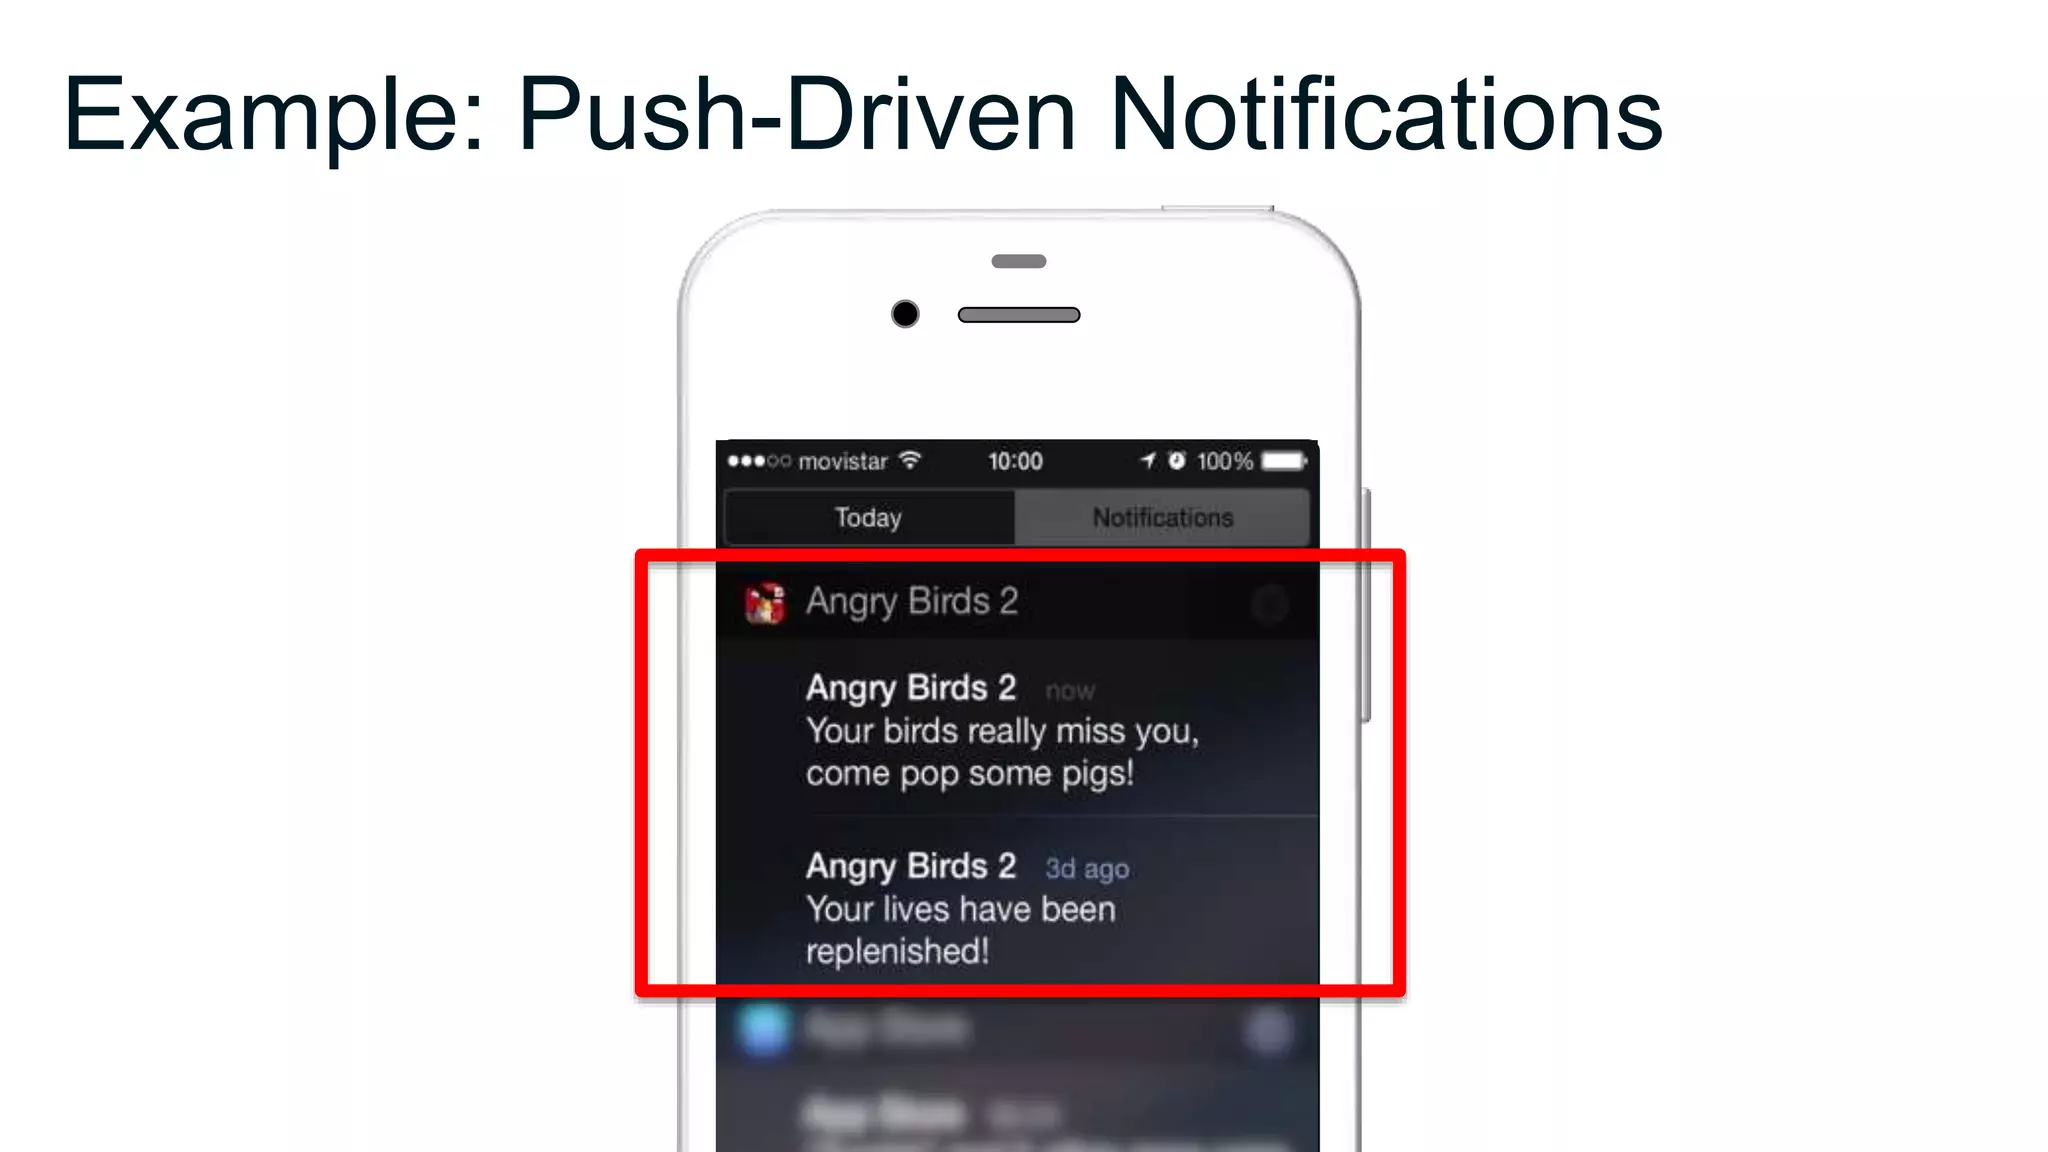
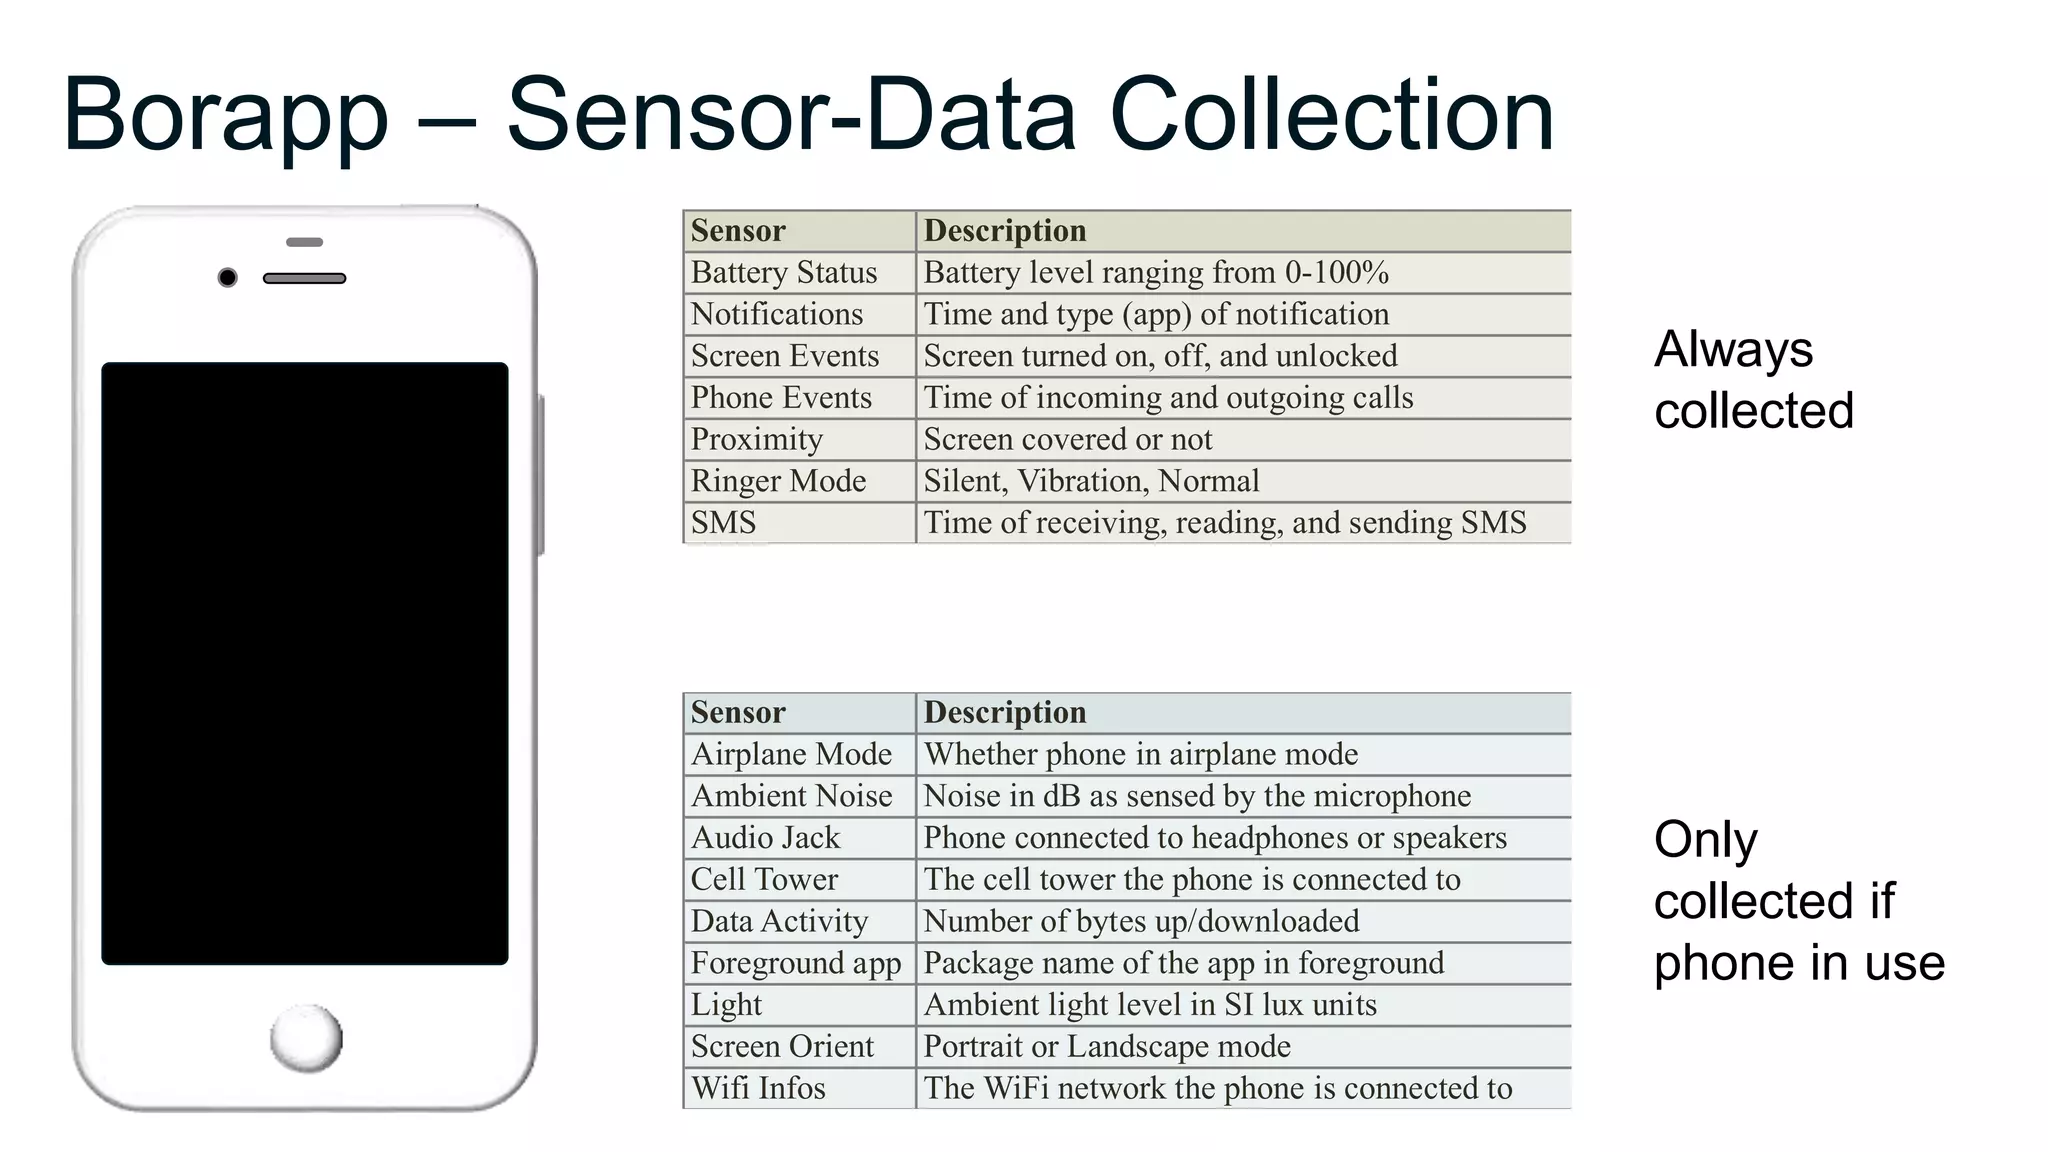
The document discusses research on detecting boredom through mobile phone usage patterns, emphasizing that attention is a limited resource in the context of the attention economy. It details the methodology and data collection involved in a study where participants reported their boredom levels, and the findings suggest that phone usage patterns can accurately indicate boredom with an accuracy ranging from approximately 75% to 83%. The study highlights the importance of understanding user engagement through push notifications and how phones could potentially suggest more constructive activities when users are bored.


![Coded Agents – with UiPath SDK + LangGraph [Virtual Hands-on Workshop]](https://cdn.slidesharecdn.com/ss_thumbnails/codedagentsdeck-251215155422-5497c599-thumbnail.jpg?width=640&height=640&fit=bounds)


