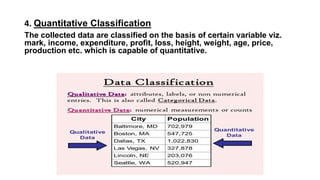
This document discusses statistics, including its definition as a branch of mathematics dealing with data collection, organization, analysis, interpretation and presentation. It then provides examples of how statistics are important in financial markets, quality testing, and election predictions. Next, it defines classification as the grouping of related facts into classes and describes four methods of classification: geographical, chronological, qualitative, and quantitative. Finally, it lists three limitations of statistics, which are that it concerns quantitative data, does not study individuals but aggregates, and requires experts to properly handle statistical data.
7 excellent reasons why statistics are important statsworkStats Statswork
Statistics are used to analyze what's happening within the world around us. In this data-driven world, all activities of ours are monitored by someone else every time. Statistics help us to convert whatever occurs in the past can be used in predicting the future. Statswork Is A Premier Statistics Consulting Company That Spearheaded Online Statistics Consultancy Service With Clientele Ranging From Educational Institutions, Academics, Corporations And Ngos. We Provide End-To-End Service And Assistance For Your Statistical Research And Analytical Needs From Data Collection, Data Mining, Data Analysis To Research Framework And Research Methodology.
Why Statswork?
Plagiarism Free | Unlimited Support | Prompt Turnaround Times | Subject Matter Expertise | Experienced Bio-statisticians & Statisticians | Statistics Across Methodologies | Wide Range Of Tools & Technologies Supports | Tutoring Services | 24/7 Email Support | Recommended by Universities
Contact Us:
Website: www.statswork.com/
Email: info@statswork.com
UnitedKingdom: +44-1143520021
India: +91-4448137070
WhatsApp: +91-8754446690
The science of statistics deals with the collection, analysis, interpretation, and presentation of data. We see and use data in our everyday lives. The measure of whether the results of research were due to chance. The more statistical significance assigned to an observation, the less likely the observation occurred by chance.
Top 5 tips on how to learn statistics more effectivelyStat Analytica
In this infographic, you will go through how to learn statistics more effectively than ever before. Have a look at this infographic to start learning statistics
This presents an overview about relevance and significance of statistics as a valid tool in enhancing quality of research. It also touches upon some misuse and abuse of statistics.
The field of statistics is the study of learning from data. Statistical learning causes you to utilize the best possible strategies to gather the information, utilize the right investigations, and adequately present the outcomes
Introduction to Research methodology: Orientation for Doctoral Program Course...niloysarkar
Despite this critical importance of research, the research and innovation investment in India is, at the current time, only 0.69% of GDP as compared to 2.8% in the United States of America, 4.3% in Israel and 4.2% in South Korea. (Source: NEP2020, GoI)
Big data and macroeconomic nowcasting from data access to modellingDario Buono
Parallel advances in IT and in the social use of Internet-related applications, provide the general public with access to a vast amount of information. The associated Big Data are potentially very useful for a variety of applications, ranging from marketing to tapering fiscal evasion.
From the point of view of official statistics, the main question is whether and to what extent Big Data are a field worth investing to expand, check and improve the data production process and which types of partnerships will have to be formed for this purpose. Nowcasting of macroeconomic indicators represents a well-identified field where Big Data has the potential to play a decisive role in the future.
In this paper we present the results and main recommendations from the Eurostat-funded project “Big Data and macroeconomic nowcasting”, implemented by GOPA Consultants, which benefits from the cooperation and work of the Eurostat task force on Big Data and a few external academic experts.
Minimizing the Impact of Forecast Error on Government Monetary and Fiscal Pol...Editor IJCATR
Forecasting is an important part of governments’ monetary and fiscal policies. Every forward-looking government uses economic forecasting as a necessary prerequisite for the success of its monetary and fiscal policies. Though economic forecasts are necessary, as they are essential underlying features of governments’ monetary and fiscal policies, economic forecasting is a difficult task. The difficulty in economic forecasting arises from the interplay of variables which certainly produces forecast errors. This study focused on minimizing the impact of forecast error on government monetary and fiscal policies through the use of suitable forecasting software. Hence in this study, forecasting software are examined as necessary tools for minimizing the impact of forecast errors on governments’ monetary and fiscal policies. Data is collected from both primary and secondary sources to elicit useful information from stakeholders in Forecasting Industry. The result of the study shows that there is a positive relationship between the use of forecasting software and minimizing the impact of forecast error on governments’ monetary and fiscal policies. The study revealed that the use of sound software, devoid of mathematical errors and inappropriate methods, will minimize the impact of forecast error on governments’ monetary and fiscal policies. The study also revealed that the major way to ensure an effective forecasting process and reduce forecast errors is to make use of intelligent forecast software that raises forecast accuracy.
statistics, the science of collecting, analyzing, presenting, and interpreting data.
Data are the facts and figures that are collected, analyzed, and summarized for presentation and interpretation. Data may be classified as either quantitative or qualitative. Quantitative data measure either how much or how many of something, and qualitative data provide labels, or names, for categories of like items. For example, suppose that a particular study is interested in characteristics such as age, gender, marital status, and annual income for a sample of 100 individuals. These characteristics would be called the variables of the study, and data values for each of the variables would be associated with each individual.
Methods of probability were developed initially for the analysis of gambling games. Probability plays a key role in statistical inference; it is used to provide measures of the quality and precision of the inferences. Many of the methods of statistical inference are described in this article. Some of these methods are used primarily for single-variable studies, while others, such as regression and correlation analysis, are used to make inferences about relationships among two or more variables.
Understanding the importance of statistics transcends mere numbers; it’s a cornerstone in various facets of life, particularly in the dynamic realm of business. Statistics is more than just crunching data; it’s the compass that guides decision-making, unveils patterns, and empowers informed choices within the business landscape. Statistics serves as the language that deciphers the story within data. It helps in interpreting information, spotting trends, and drawing conclusions vital for informed decision-making.
Unveiling the Power of Marketing Information Systems: Transforming Data into ...CIO Look Leader
Key Components of Marketing Information Systems: 1. Data Collection 2. Data Analysis 3. Information Storage 4. Information Retrieval 5. Information Dissemination
June 3, 2024 Anti-Semitism Letter Sent to MIT President Kornbluth and MIT Cor...Levi Shapiro
Letter from the Congress of the United States regarding Anti-Semitism sent June 3rd to MIT President Sally Kornbluth, MIT Corp Chair, Mark Gorenberg
Dear Dr. Kornbluth and Mr. Gorenberg,
The US House of Representatives is deeply concerned by ongoing and pervasive acts of antisemitic
harassment and intimidation at the Massachusetts Institute of Technology (MIT). Failing to act decisively to ensure a safe learning environment for all students would be a grave dereliction of your responsibilities as President of MIT and Chair of the MIT Corporation.
This Congress will not stand idly by and allow an environment hostile to Jewish students to persist. The House believes that your institution is in violation of Title VI of the Civil Rights Act, and the inability or
unwillingness to rectify this violation through action requires accountability.
Postsecondary education is a unique opportunity for students to learn and have their ideas and beliefs challenged. However, universities receiving hundreds of millions of federal funds annually have denied
students that opportunity and have been hijacked to become venues for the promotion of terrorism, antisemitic harassment and intimidation, unlawful encampments, and in some cases, assaults and riots.
The House of Representatives will not countenance the use of federal funds to indoctrinate students into hateful, antisemitic, anti-American supporters of terrorism. Investigations into campus antisemitism by the Committee on Education and the Workforce and the Committee on Ways and Means have been expanded into a Congress-wide probe across all relevant jurisdictions to address this national crisis. The undersigned Committees will conduct oversight into the use of federal funds at MIT and its learning environment under authorities granted to each Committee.
• The Committee on Education and the Workforce has been investigating your institution since December 7, 2023. The Committee has broad jurisdiction over postsecondary education, including its compliance with Title VI of the Civil Rights Act, campus safety concerns over disruptions to the learning environment, and the awarding of federal student aid under the Higher Education Act.
• The Committee on Oversight and Accountability is investigating the sources of funding and other support flowing to groups espousing pro-Hamas propaganda and engaged in antisemitic harassment and intimidation of students. The Committee on Oversight and Accountability is the principal oversight committee of the US House of Representatives and has broad authority to investigate “any matter” at “any time” under House Rule X.
• The Committee on Ways and Means has been investigating several universities since November 15, 2023, when the Committee held a hearing entitled From Ivory Towers to Dark Corners: Investigating the Nexus Between Antisemitism, Tax-Exempt Universities, and Terror Financing. The Committee followed the hearing with letters to those institutions on January 10, 202
Operation “Blue Star” is the only event in the history of Independent India where the state went into war with its own people. Even after about 40 years it is not clear if it was culmination of states anger over people of the region, a political game of power or start of dictatorial chapter in the democratic setup.
The people of Punjab felt alienated from main stream due to denial of their just demands during a long democratic struggle since independence. As it happen all over the word, it led to militant struggle with great loss of lives of military, police and civilian personnel. Killing of Indira Gandhi and massacre of innocent Sikhs in Delhi and other India cities was also associated with this movement.
Unit 8 - Information and Communication Technology (Paper I).pdfThiyagu K
This slides describes the basic concepts of ICT, basics of Email, Emerging Technology and Digital Initiatives in Education. This presentations aligns with the UGC Paper I syllabus.
The French Revolution, which began in 1789, was a period of radical social and political upheaval in France. It marked the decline of absolute monarchies, the rise of secular and democratic republics, and the eventual rise of Napoleon Bonaparte. This revolutionary period is crucial in understanding the transition from feudalism to modernity in Europe.
For more information, visit-www.vavaclasses.com
Instructions for Submissions thorugh G- Classroom.pptxJheel Barad
This presentation provides a briefing on how to upload submissions and documents in Google Classroom. It was prepared as part of an orientation for new Sainik School in-service teacher trainees. As a training officer, my goal is to ensure that you are comfortable and proficient with this essential tool for managing assignments and fostering student engagement.
Francesca Gottschalk - How can education support child empowerment.pptxEduSkills OECD
Francesca Gottschalk from the OECD’s Centre for Educational Research and Innovation presents at the Ask an Expert Webinar: How can education support child empowerment?
Embracing GenAI - A Strategic ImperativePeter Windle
Artificial Intelligence (AI) technologies such as Generative AI, Image Generators and Large Language Models have had a dramatic impact on teaching, learning and assessment over the past 18 months. The most immediate threat AI posed was to Academic Integrity with Higher Education Institutes (HEIs) focusing their efforts on combating the use of GenAI in assessment. Guidelines were developed for staff and students, policies put in place too. Innovative educators have forged paths in the use of Generative AI for teaching, learning and assessments leading to pockets of transformation springing up across HEIs, often with little or no top-down guidance, support or direction.
This Gasta posits a strategic approach to integrating AI into HEIs to prepare staff, students and the curriculum for an evolving world and workplace. We will highlight the advantages of working with these technologies beyond the realm of teaching, learning and assessment by considering prompt engineering skills, industry impact, curriculum changes, and the need for staff upskilling. In contrast, not engaging strategically with Generative AI poses risks, including falling behind peers, missed opportunities and failing to ensure our graduates remain employable. The rapid evolution of AI technologies necessitates a proactive and strategic approach if we are to remain relevant.
1. Statistics
Statistics is a branch of mathematics dealing with data collection,
organization, analysis, interpretation and presentation.
Importance of Statistics
1. Financial market also statistic plays a great role. Statistics are the
key of how traders and businessmen invest and make money.
2. Statistical concepts are used in quality testing. Companies make
many products on a daily basis and every company should make sure
that they sold the best quality items. But companies cannot test all the
products, so they use statistics sample.
3. News reporter makes a prediction of winner for elections based on
political campaigns. Here statistics play a strong part in who will be
your governments.
2. Classification of Data
Classification is the grouping of related facts into class.
Methods of Classification of Data
1. Geographical Classification
This data is classified on the basis of area or place, and as such, this
type of classification is also known as areal or spatial classification.
The areas may be in terms of countries, states, districts, or zones
according as the data are distributed.
3. 2. Chronological Classification
The data collected are classified on the basis of time of their
occurrence.This type of classification is suitable for chose data which
take place in course of time viz. population, production, sales, results
etc.
3. Qualitative Classification
The data obtained are classified on the basis of certain descriptive
character or qualitative aspect of a phenomenon viz. sex, beauty,
literacy, honesty, intelligence, religion, eye-sight etc.
4. 4. Quantitative Classification
The collected data are classified on the basis of certain variable viz.
mark, income, expenditure, profit, loss, height, weight, age, price,
production etc. which is capable of quantitative.
5. Limitation of Statistics
1. It concern with Quantitative Data.
2. It doesn't Study individuals. {Aggregates}
3.Only Experts Can handle statistical data properly.