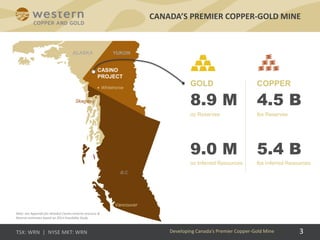
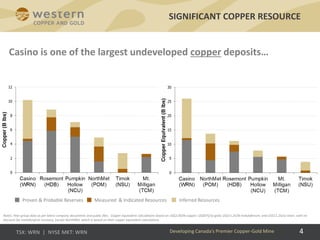
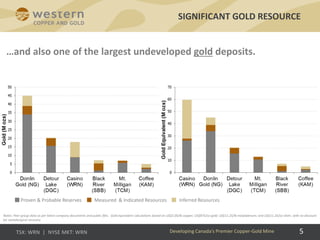
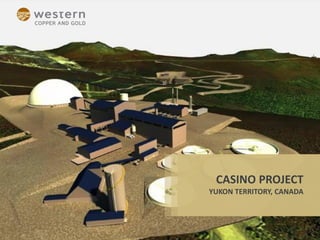
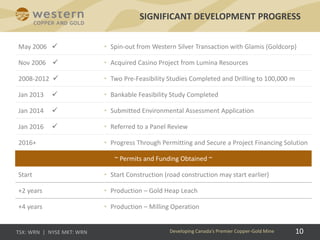
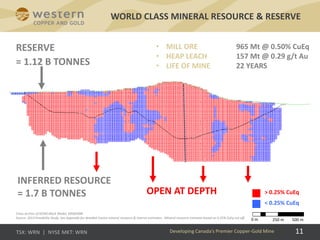
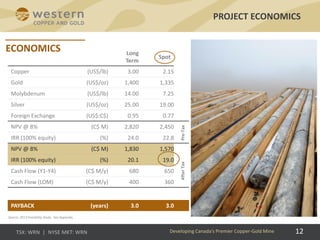
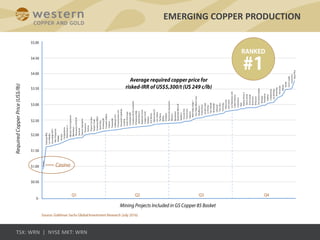
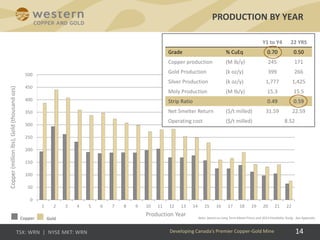
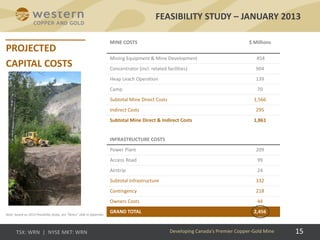
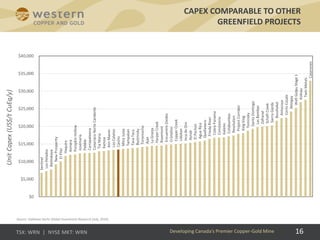
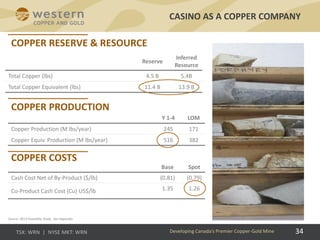
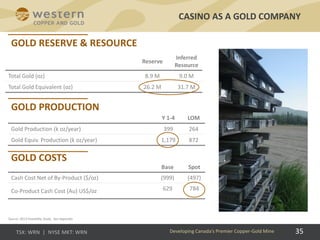
DEVELOPING CANADA'S PREMIER COPPER-GOLD MINE
September 2016
2
The information provided in this presentation is not intended to be a comprehensive review of all matters and developments concerning Western Copper and Gold Corporation
and its subsidiaries (collectively, the “Company”). This document should be read in conjunction with all other disclosure documents of the Company. No securities commission
or regulatory authority has reviewed the accuracy or adequacy of the information presented herein.
Statements contained in this presentation that are not historical fact are “forward-looking statements” as that term is defined in the United States Private Securities Litigation
Reform Act of 1995 and “forward-looking information” as that term is defined in National Instrument 51-102 of the Canadian Securities Administrators (collectively, “forward-
looking statements”). Forward-looking statements in this presentation include, without limitation, statements regarding mineral reserve and resource estimates, planned
exploration and development activities, corporate objectives, the economic prospects of the Company’s projects, the Company’s future plans or future revenues, and timing of
development, or potential expansion or improvements. Such forward-looking statements are based on certain assumptions that the Company believes are reasonable,
including, without limitation, with respect to any mineral reserve or resource estimate, the key assumptions and parameters on which such estimates are based, prevailing and
projected market prices and foreign exchange rates, projected capital and operating costs, continued availability of capital and financing, availability of equipment and personnel
required for construction and operations, the Company not experiencing unforeseen delays, unexpected geological or other effects, equipment failures, permitting delays, and
general economic, market or business conditions. Forward-looking statements are subject to known and unknown risks and uncertainties which could cause actual results to
differ materially from estimated results. Such risks and uncertainties include, but are not limited to, the Company’s ability to raise sufficient capital to fund development;
changes in general economic conditions or financial markets, changes in prices for the Company’s mineral products or increases in input costs; uncertainties relating to
interpretation of drill results and the geological continuity and grade of mineral deposits; that mineral resources and reserves are not as estimated; risks related to cooperation
of government agencies and First Nations in the exploration and development of the property; litigation; legislative, environmental and other judicial, regulatory, political and
competitive developments in Canada; technological and operational difficulties or inability to obtain permits encountered in connection with exploration and development
activities; labor relations matters, and changing foreign exchange rates, all of which are described more fully in the Company’s filings with the applicable regulatory agencies. The
Company expressly disclaims any intention or obligation to update or revise any forward-looking statements whether as a result of new information, future events or otherwise,
except as required by applicable securities legislation.
The technical information regarding the Casino Project in this presentation is based upon information contained in the technical report entitled “Casino Project, Form 43-101F1
Technical Report Feasibility Study, Yukon, Canada – Revision 1” (the “2013 Feasibility Study”) dated January 25, 2013 and prepared by M3 Engineering & Technology Corp.
Readers are encouraged to read the 2013 Feasibility Study, which is available under the Company’s profile on SEDAR, for detailed information regarding the Casino Project. See
also the Appendix hereto.
Cautionary Note to U.S. Readers/Investors:
The United States Securities and Exchange Commission (the “SEC”) permits U.S. mining companies, in their filings with the SEC, to disclose only those mineral deposits that a
company can economically and legally extract or produce.
We use certain terms in this presentation, such as “measured”, “indicated”, and “inferred” “resources”, that the SEC guidelines strictly prohibit U.S. registered companies from
including in their filings with the SEC. “Inferred mineral resources” have a great amount of uncertainty as to their existence, and their economic and legal feasibility. It cannot be
assumed that all or part of an inferred mineral resource will ever be upgraded to a higher category. Readers are cautioned not to assume that all or any part of an inferred
mineral resource exists or is economically or legally mineable. U.S. investors are urged to consider closely the disclosure in the Company’s Form 20-F, which may be obtained
from the Company or from the SEC’s website at www.sec.gov/edgar.shtml.
FORWARD LOOKING STATEMENTS
Developing Canada’s Premier Copper-Gold Mine
3
CANADA’S PREMIER COPPER-GOLD MINE
Developing Canada’s Premier Copper-Gold Mine
GOLD
8.9 M
oz Reserves
9.0 M
oz Inferred Resources
COPPER
4.5 B
lbs Reserves
5.4 B
lbs Inferred Resources
CASINO
PROJECT
Whitehorse
Vancouver
B.C
YUKONALASKA
Skagway
Note: see Appendix for detailed Casino mineral resource &
Reserve estimates based on 2013 Feasibility Study.
SIGNIFICANT COPPER RESOURCE
4
Casino is one of the largest undeveloped copper deposits…
Notes: Peer group data as per latest company documents and public files. Copper equivalent calculations based on US$2.00/lb copper; US$875/oz gold; US$11.25/lb molybdenum; and US$11.25/oz silver, with no
discount for metallurgical recovery, except NorthMet, which is based on their copper equivalent calculations.
Proven & Probable Reserves Measured & Indicated Resources Inferred Resources
Developing Canada’s Premier Copper-Gold Mine
SIGNIFICANT GOLD RESOURCE
5
…and also one of the largest undeveloped gold deposits.
Notes: Peer group data as per latest company documents and public files. Gold equivalent calculations based on US$2.00/lb copper; US$875/oz gold; US$11.25/lb molybdenum; and US$11.25/oz silver, with no discount
for metallurgical recovery.
Proven & Probable Reserves Measured & Indicated Resources Inferred Resources
Developing Canada’s Premier Copper-Gold Mine
6
WHY WRN AND THE CASINO PROJECT?
6Developing Canada’s Premier Copper-Gold Mine
*Notes: Goldman Sachs (July 2016) and IRR based on 2013 Feasibility. See Appendix.
World Class Project • Ranked #1 Economic Copper Project by Goldman Sachs
Robust Economics
• Greater than 16% IRR (after-tax) Maintained Throughout
Recent Downturn
Ideal Location
• Yukon, Canada is a Stable, Mining-Friendly Jurisdiction
• Recent Entry of Goldcorp to Area Confirms District Potential
Gold and Copper • Revenue Evenly Split Between Copper and Gold at Spot Prices
Healthy Treasury • Company History of Fiscal Discipline
Solid Track Record • Accomplished Development Team
KEY MANAGEMENT TEAM WITH
SUCCESSFUL TRACK RECORD
• Extensive experience in
mineral development,
financing, property
acquisition and evaluation.
Formerly Chairman & CEO of
Western Silver Corporation.
• Formerly Project Manager
for Bechtel Engineering and
Western Silver Corporation.
• Metallurgical Engineer with
significant management
and metallurgical
experience in increasingly
senior roles with BHP,
Placer Dome and Barrick.
• Has been CFO since 2006.
Previously Controller of
Western Silver Corporation
during Glamis Gold
takeover.
Paul West-Sells, PhD – President & CEO
Julien Francois, CPA, CA – VP Finance & CFO
Dale Corman, B.Sc., P.Eng – Executive Chairman
Cameron Brown, P.Eng – VP Engineering
Developing Canada’s Premier Copper-Gold Mine 7
8
KEY FINANCIAL INFORMATION
Developing Canada’s Premier Copper-Gold Mine
Cash & Short Term Investments C$ 8.6 million
Working Capital C$ 8.5 million
Short/Long Term Debt $Nil
Management & Board 8%
Private Investors* 53%
Institutional Investors 3%
Other 37%
Common Shares 100%
Share Price C$ 1.04
Market Cap C$ 98 M
Common Shares 94,448,936
Options 4,638,334
Warrants -
Fully Diluted 99,087,270
CASINO PROJECT
YUKON TERRITORY, CANADA
10
SIGNIFICANT DEVELOPMENT PROGRESS
Developing Canada’s Premier Copper-Gold Mine
May 2006  • Spin-out from Western Silver Transaction with Glamis (Goldcorp)
Nov 2006  • Acquired Casino Project from Lumina Resources
2008-2012  • Two Pre-Feasibility Studies Completed and Drilling to 100,000 m
Jan 2013  • Bankable Feasibility Study Completed
Jan 2014  • Submitted Environmental Assessment Application
Jan 2016  • Referred to a Panel Review
2016+ • Progress Through Permitting and Secure a Project Financing Solution
~ Permits and Funding Obtained ~
Start • Start Construction (road construction may start earlier)
+2 years • Production – Gold Heap Leach
+4 years • Production – Milling Operation
11
WORLD CLASS MINERAL RESOURCE & RESERVE
Developing Canada’s Premier Copper-Gold Mine
INFERRED RESOURCE
= 1.7 B TONNES
RESERVE
= 1.12 B TONNES
0 m 250 m 500 m
> 0.25% CuEq
< 0.25% CuEq
Cross section of GEMS Block Model, 6958500N
Source: 2013 Feasibility Study. See Appendix for detailed Casino mineral resource & reserve estimates. Mineral resource estimate based on 0.25% CuEq cut-off.
• MILL ORE 965 Mt @ 0.50% CuEq
• HEAP LEACH 157 Mt @ 0.29 g/t Au
• LIFE OF MINE 22 YEARS
OPEN AT DEPTH
12
Long
Term
Spot
Copper (US$/lb) 3.00 2.15
Gold (US$/oz) 1,400 1,335
Molybdenum (US$/lb) 14.00 7.25
Silver (US$/oz) 25.00 19.00
Foreign Exchange (US$:C$) 0.95 0.77
NPV @ 8% (C$ M) 2,820 2,450
IRR (100% equity) (%) 24.0 22.8
NPV @ 8% (C$ M) 1,830 1,570
IRR (100% equity) (%) 20.1 19.0
Cash Flow (Y1-Y4) (C$ M/y) 680 650
Cash Flow (LOM) (C$ M/y) 400 360
PAYBACK (years) 3.0 3.0
PROJECT ECONOMICS
Pre-TaxAfterTax
Developing Canada’s Premier Copper-Gold Mine
Source: 2013 Feasibility Study. See Appendix.
EMERGING COPPER PRODUCTION
14
PRODUCTION BY YEAR
Developing Canada’s Premier Copper-Gold Mine
0
50
100
150
200
250
300
350
400
450
500
1 2 3 4 5 6 7 8 9 10 11 12 13 14 15 16 17 18 19 20 21 22
Copper(millionlbs),Gold(thousandozs)
Production Year
Y1 to Y4 22 YRS
Grade % CuEq 0.70 0.50
Copper production (M lb/y) 245 171
Gold Production (k oz/y) 399 266
Silver Production (k oz/y) 1,777 1,425
Moly Production (M lb/y) 15.3 15.5
Strip Ratio 0.49 0.59
Net Smelter Return ($/t milled) 31.59 22.59
Operating cost ($/t milled) 8.52
Copper Gold Note: based on Long Term Metal Prices and 2013 Feasibility Study. See Appendix.
MINE COSTS $ Millions
Mining Equipment & Mine Development 454
Concentrator (incl. related facilities) 904
Heap Leach Operation 139
Camp 70
Subtotal Mine Direct Costs 1,566
Indirect Costs 295
Subtotal Mine Direct & Indirect Costs 1,861
INFRASTRUCTURE COSTS
Power Plant 209
Access Road 99
Airstrip 24
Subtotal Infrastructure 332
Contingency 218
Owners Costs 44
GRAND TOTAL 2,456
FEASIBILITY STUDY – JANUARY 2013
Note: based on 2013 Feasibility Study, see “Notes” slide in Appendix.
Developing Canada’s Premier Copper-Gold Mine 15
16
CAPEX COMPARABLE TO OTHER
GREENFIELD PROJECTS
Developing Canada’s Premier Copper-Gold Mine
Source: Goldman Sachs Global Investment Research (July, 2016)
Sentinel
LosHelados
Baimskaya
NewProsperity
ElPilar
Haquira
Asmara
PumpkinHollow
Josemaria
Pebble
Carrapateena
CanariacoNorteCandente
TiaMaria
Kamoa
AnnMason
LosCalatos
Casino
MinaJusta
Tampakan
TacaTaca
Bystrinsky
Toromocho
Ajax
LaGranja
HarperCreek
Rosemont
EncuentroOxides
Cristalino
CopperCreek
Udokan
IncadeOro
Aynak
ElPachon
AguaRica
Quellaveco
FriedaRiver
CobrePanama
Constancia
Galeno
Cotabambas
Resolution
ProjectCorridor
KingKing
Tominsky
SantoDomingo
LasBambas
Zafranal
SchaftCreek
SierraGorda
Bozshakol
Antucoya
CerroCasale
Aktogay
WafiGolpuStage1
Koksay
TwinMetals
Caserones
$0
$5,000
$10,000
$15,000
$20,000
$25,000
$30,000
$35,000
$40,000
UnitCapex(US$/tCuEq/y)
MOVING TOWARDS
PRODUCTION
18
 Strengthened Engineering
• Established Independent Engineering Review Panel to review tailings facility.
• Agreements Signed with M3 Engineering and Technology to Build and
Potentially Operate the Mine
• MOU signed with Siemens to Supply, Operate, and Fund Power Plant
• Agreement with FLSmidth Establishing Pricing Mechanism for Equipment
CONTINUING TO DE-RISK PROJECT
Developing Canada’s Premier Copper-Gold Mine
19
 Strong Community Outreach
• Ongoing Engagement with Local Communities
• Significant Yukon Government Collaboration and Support
• Federal Government Support as Part of $200M Infrastructure Request
• 10 Years Operating in the Yukon
CONTINUING TO DE-RISK PROJECT
Developing Canada’s Premier Copper-Gold Mine
CONTINUING TO DE-RISK PROJECT
Developing Canada’s Premier Copper-Gold Mine 20
 First Nations
• We are Committed to Developing the Casino Mine With our First
Nations Partners
• Casino Project is Located in Area With Settled First Nations Land Claims
• Cooperation Agreements Signed With Selkirk First Nation, Little
Salmon/Carmacks First Nation and Tr’ondëk Hwëch’in
• Minto Mine Within the Selkirk First Nation Territory
Fixed Timelines: 15 Months of YESAB Time to Review Project and Issue Decision
Final Decision: Either Recommend or Not Recommend Project to Proceed
YESAB PANEL REVIEW PROCESS
Developing Canada’s Premier Copper-Gold Mine 21
YESAB REVIEW TIMELINE
February 18, 2016  • Project Requires Panel Review
March 18, 2016  • Request Approved from Environment Minister
June 20, 2016  • YESAB Compiles List of Additional Information to be Submitted
~18 months • Company Completes and Submits Additional Information to YESAB
~ 1 month • YESAB Establishes Panel and Sets Terms of Reference
< 15 Months (YESAB) • Panel Review and Recommendation Issued
VALUE MEASURES
23
RECENT SIGNS OF MARKET
IMPROVEMENT
Developing Canada’s Premier Copper-Gold Mine
Source: Bloomberg Article February, 2016
• Gold Equites Have Risen with Gold Price and Renewed Interest in the
Sector
• M&A Activity in Sector is Significant (Kaminak, Reservoir, etc.)
• Copper Prices Have Stabilized Above US$2/lb
• Beginning to See New Investment in Copper Production (Olympic
Dam, Oyu Tolgoi)
• Base Metal Equities Have Begun to Move
24
SELECT PRECEDENT BASE METAL
DEVELOPER TRANSACTIONS
Developing Canada’s Premier Copper-Gold Mine
0.00x
0.25x
0.50x
0.75x
1.00x
1.25x
ThompsonCreek>
Terrane
HudBay>
Norsemont
Capstone>FarWest
Stillwater>
Peregrine
Mercator>Creston
Moly
CupricCanyon>
HanaMining
Lundin>EagleMine
PanAust>Frieda
RiverProject
HudBay>Augusta
FirstQuantum>
Lumina
Nevsun>Reservoir
WesternCopper&
Gold
2
Average P/NAV: 0.62x
Price/NetAssetValue
Announce Date April-16
2010 2011 2012 2013 2014
Note: Based on information provided by National Bank analysts, April 2016. Please note that any opinions, estimates or forecasts regarding Western Copper and Gold’s performance made by
these analysts are theirs alone and do not represent opinions, forecasts or predictions of Western Copper and Gold or its management. 
Western Copper and Gold does not by its reference above
or distribution imply its endorsement of or concurrence with such information, conclusions or recommendations.
2016 YTD
25
Royalty Sales Confirm Project Value
ROYALTY SALE CONFIRMS VALUE
Developing Canada’s Premier Copper-Gold Mine
Price – 5% NPI1 ~$28 M
Price – 5% NPI to 2.75% NSR $32 M
Total Price – NSR $60 M
Net Present Value of Royalty2
$230 M
1 – Estimated by Western Copper and Gold. For further information refer to Strategic Metals Ltd. news release dated August 10, 2012.
2 – Based on 2013 Feasibility Study assumptions, discounted at 8%; using Long Term Metal Prices. See Appendix.
VALUATION
METRICS
26
ANALYST COVERAGE
Developing Canada’s Premier Copper-Gold Mine
Alec Meikle
Tel: (416) 943-6729
Note: Western Copper and Gold is followed by the analysts listed above. Please note that any opinions, estimates or forecasts regarding Western Copper and Gold’s 
performance made by these
analysts are theirs alone and do not represent opinions, forecasts or predictions of Western Copper and Gold or its management. 
Western Copper and Gold does not by its reference above or
distribution imply its endorsement of or concurrence with such information, conclusions or recommendations.
Heiko F. Ihle, CFA
Tel: (212) 356 - 0500
Thank You
APPENDIX
28
SHARE PERFORMANCE
EA Submitted
Appendix
Source: Yahoo! Inc.
Referred to Panel Review
29
40 years experience as a senior corporate officer of publicly listed companies. Extensive expertise
in mineral exploration & development, financing, property evaluation and acquisition. Formerly
Chairman & CEO of Western Silver Corporation.
Former two term elected member of the Yukon Legislative Assembly appointed as Minister of
Energy Mines and Resources (2002-2008), Minister of Highway and Public Works (2008-2011)
and Minister of Community Services (2008-2011). Mr. Lang is experienced in developing and
managing projects in consultation and partnership with all levels of government, including First
Nations.
Formerly Partner of Peat Marwick Mitchell. Directed the accounting and financial matters of
public companies in the resource and non-resource fields since 1987. Currently Mr. Gayton sits
on the Board of Directors of Amerigo Resources Corp., B2 Gold Corp. and Nevsun Resources Ltd.
30+ years experience in the investment management business. Formerly Senior Partner of Beutel
Goodman, a value management company dealing in equity and fixed income assets. Currently
manages Roxborough Holdings Ltd., a family owned private equity holding company. Mr.
Williams also sits on the Board of Directors of Atlantis Systems and SQI Diagnostics.
30+ years experience in the mineral industry. Financed, built and managed mines worldwide.
Formerly Senior VP of Teck Cominco. Currently Executive Chairman of Amerigo Resources Corp.,
Chairman and Director of Los Andes Copper Ltd., and a Director of Tahoe Resources Inc.
BOARD OF DIRECTORS
Appendix
CASINO
31
REVENUE DISTRIBUTION
Appendix
Y1 to Y4 LOM
% of Revenue – Copper ($3) 48% 46%
% of Revenue – Gold + Silver 40% 37%
% of Revenue – Gold ($1,400) 37% 34%
% of Revenue – Silver ($25) 3% 3%
% of Revenue – Moly ($14) 12% 17%
Y1 to Y4 LOM
% of Revenue – Copper ($2.15) 44% 43%
% of Revenue – Gold + Silver 48% 46%
% of Revenue – Gold ($1,335) 45% 43%
% of Revenue – Silver ($19.00) 3% 3%
% of Revenue – Moly ($7.25) 8% 12%
Note: based on 2013 Feasibility Study, see “Notes” slide in Appendix.
32
PROJECTED OPERATING COSTS
Appendix
($/tonne)
Milling $5.13
Mining $3.05
General & Administrative $0.34
Total $8.52
($/tonne)
Heap Leach Operation $1.31
ADR/SART $2.73
Total $4.04
Note: based on 2013 Feasibility Study, see “Notes” slide in Appendix.
33
BEST IN CLASS OPERATING COSTS
Appendix
US$/lb
Cash Costs (Copper) 2.95
By-product Revenue (3.76)
Cash Cost (net of by-products) (0.81)
NSR Royalty 0.17
Yukon Royalty & Taxes 0.37
Reclamation Cost 0.03
Sustaining Capital Expenditure 0.10
All-in Cost (0.13)
Note: based on 2013 Feasibility Study and Long Term Metal Prices. See Appendix.
34
CASINO AS A COPPER COMPANY
Developing Canada’s Premier Copper-Gold Mine
Source: 2013 Feasibility Study. See Appendix.
Base Spot
Cash Cost Net of By-Product ($/lb) (0.81) (0.79)
Co-Product Cash Cost (Cu) US$/lb 1.35 1.26
Y 1-4 LOM
Copper Production (M lbs/year) 245 171
Copper Equiv. Production (M lbs/year) 516 382
Reserve
Inferred
Resource
Total Copper (lbs) 4.5 B 5.4B
Total Copper Equivalent (lbs) 11.4 B 13.9 B
35
CASINO AS A GOLD COMPANY
Developing Canada’s Premier Copper-Gold Mine
Source: 2013 Feasibility Study. See Appendix.
Base Spot
Cash Cost Net of By-Product ($/oz) (999) (497)
Co-Product Cash Cost (Au) US$/oz 629 784
Y 1-4 LOM
Gold Production (k oz/year) 399 264
Gold Equiv. Production (k oz/year) 1,179 872
Reserve
Inferred
Resource
Total Gold (oz) 8.9 M 9.0 M
Total Gold Equivalent (oz) 26.2 M 31.7 M
PROCESSING
MILLING
• Throughput: average LOM 124,000 tonnes per day
• Grinding Circuit: 40 ft SAG Mill (29 MW) + 2 x 28 ft Ball Mills (22 MW each)
• Medium – soft ore: BWi – 14.1 kWh/t, 200 µm primary grind
FLOTATION
• Conventional copper/moly circuit
• Recoveries: Copper 86%, Gold 67%, Moly 71%, Silver 53%
• Sulfide removal circuit to produce suitable tailings for dam construction
HEAP LEACH
• Conventional crush/conveyer stack valley fill heap leach
• 25,000 tonnes per day
• SART to remove copper from solution
• Recoveries: Gold 66%, Silver 26%, Copper 18%
36Appendix
EXCELLENT CONCENTRATE QUALITY
Element Avg Value Unit
Copper 28 %
Gold 25 g/t
Silver 120 g/t
Molybdenum 0.05 %
Iron 26 %
Sulphur 36 %
Arsenic 200 g/t
Antimony 250 g/t
Mercury 1 g/t
Cadmium 40 g/t
Fluorine 100 g/t
Silica 2 %
Appendix
Element Avg Value Unit
Molybdenum 57.4 %
Copper 0.39 %
Rhenium 133.5 g/t
Iron 0.8 %
Sulphur 37.9 %
Arsenic 1659 g/t
Antimony 100 g/t
Mercury <1 g/t
Cadmium 30 g/t
Fluorine ND g/t
Silicon 1.74 %
Copper Concentrate Molybdenum Concentrate
37
Note: based on 2013 Feasibility Study, see “Notes” slide in Appendix.
38
CASINO – MINERAL RESERVE &
RESOURCE ESTIMATES
Appendix
Note: based on 2013 Feasibility Study. See “Notes” Slide in Appendix.
39
2013 Feasibility Study
• Technical report entitled "Casino Project, Form 43-101 Technical Report Feasibility Study, Yukon, Canada –
Revision 1" dated January 25, 2013, a copy of which is available on Western Copper and Gold's website at
www.westerncopperandgold.com and under its profile at www.sedar.com
• Prepared by Conrad E. Huss, P. E., Thomas L. Drielick, P.E., Jeff Austin, P. Eng., Gary Giroux, P. Eng., Scott
Casselman, P.Geo. Graham Greenaway, P. Eng., Michael G. Hester, FAus IMM, and Jesse Duke, P. Geo.; each of
whom is a qualified person pursuant to National Instrument 43-101 ("Qualified Person")
The technical information in this presentation is based on the following key assumptions:
• "Long Term Metal Prices" were based on typical analyst projections of long term metal prices and $CAN:$US
exchange rates
• Capital and operating cost projections based on a foreign exchange rate of C$1.00 = US$1.00
Mineral Resource Cut-off grades:
• Supergene & Hypogene Zones at CuEq cut-off 0.25%
• Leached Cap / Oxide Zones at Cut-off Au 0.25 g/t
• No discount for metallurgical recovery in contained metal figures
Copper equivalent calculations in this presentation are based on:
• US$2.00/lb copper; US$875/oz gold; US$11.25/lb molybdenum; and US$11.25/oz silver
Technical information contained in this presentation is based on the 2013 Feasibility Study prepared by or under
the supervision of the Qualified Persons noted above.
NOTES
Appendix
WWW.WESTERNCOPPERANDGOLD.COM
INFO@WESTERNCOPPERANDGOLD.COM
604 684 9497

Western Copper and Gold September 2016 Presentation

  • 1.
    DEVELOPING CANADA'S PREMIERCOPPER-GOLD MINE September 2016
  • 2.
    2 The information providedin this presentation is not intended to be a comprehensive review of all matters and developments concerning Western Copper and Gold Corporation and its subsidiaries (collectively, the “Company”). This document should be read in conjunction with all other disclosure documents of the Company. No securities commission or regulatory authority has reviewed the accuracy or adequacy of the information presented herein. Statements contained in this presentation that are not historical fact are “forward-looking statements” as that term is defined in the United States Private Securities Litigation Reform Act of 1995 and “forward-looking information” as that term is defined in National Instrument 51-102 of the Canadian Securities Administrators (collectively, “forward- looking statements”). Forward-looking statements in this presentation include, without limitation, statements regarding mineral reserve and resource estimates, planned exploration and development activities, corporate objectives, the economic prospects of the Company’s projects, the Company’s future plans or future revenues, and timing of development, or potential expansion or improvements. Such forward-looking statements are based on certain assumptions that the Company believes are reasonable, including, without limitation, with respect to any mineral reserve or resource estimate, the key assumptions and parameters on which such estimates are based, prevailing and projected market prices and foreign exchange rates, projected capital and operating costs, continued availability of capital and financing, availability of equipment and personnel required for construction and operations, the Company not experiencing unforeseen delays, unexpected geological or other effects, equipment failures, permitting delays, and general economic, market or business conditions. Forward-looking statements are subject to known and unknown risks and uncertainties which could cause actual results to differ materially from estimated results. Such risks and uncertainties include, but are not limited to, the Company’s ability to raise sufficient capital to fund development; changes in general economic conditions or financial markets, changes in prices for the Company’s mineral products or increases in input costs; uncertainties relating to interpretation of drill results and the geological continuity and grade of mineral deposits; that mineral resources and reserves are not as estimated; risks related to cooperation of government agencies and First Nations in the exploration and development of the property; litigation; legislative, environmental and other judicial, regulatory, political and competitive developments in Canada; technological and operational difficulties or inability to obtain permits encountered in connection with exploration and development activities; labor relations matters, and changing foreign exchange rates, all of which are described more fully in the Company’s filings with the applicable regulatory agencies. The Company expressly disclaims any intention or obligation to update or revise any forward-looking statements whether as a result of new information, future events or otherwise, except as required by applicable securities legislation. The technical information regarding the Casino Project in this presentation is based upon information contained in the technical report entitled “Casino Project, Form 43-101F1 Technical Report Feasibility Study, Yukon, Canada – Revision 1” (the “2013 Feasibility Study”) dated January 25, 2013 and prepared by M3 Engineering & Technology Corp. Readers are encouraged to read the 2013 Feasibility Study, which is available under the Company’s profile on SEDAR, for detailed information regarding the Casino Project. See also the Appendix hereto. Cautionary Note to U.S. Readers/Investors: The United States Securities and Exchange Commission (the “SEC”) permits U.S. mining companies, in their filings with the SEC, to disclose only those mineral deposits that a company can economically and legally extract or produce. We use certain terms in this presentation, such as “measured”, “indicated”, and “inferred” “resources”, that the SEC guidelines strictly prohibit U.S. registered companies from including in their filings with the SEC. “Inferred mineral resources” have a great amount of uncertainty as to their existence, and their economic and legal feasibility. It cannot be assumed that all or part of an inferred mineral resource will ever be upgraded to a higher category. Readers are cautioned not to assume that all or any part of an inferred mineral resource exists or is economically or legally mineable. U.S. investors are urged to consider closely the disclosure in the Company’s Form 20-F, which may be obtained from the Company or from the SEC’s website at www.sec.gov/edgar.shtml. FORWARD LOOKING STATEMENTS Developing Canada’s Premier Copper-Gold Mine
  • 3.
    3 CANADA’S PREMIER COPPER-GOLDMINE Developing Canada’s Premier Copper-Gold Mine GOLD 8.9 M oz Reserves 9.0 M oz Inferred Resources COPPER 4.5 B lbs Reserves 5.4 B lbs Inferred Resources CASINO PROJECT Whitehorse Vancouver B.C YUKONALASKA Skagway Note: see Appendix for detailed Casino mineral resource & Reserve estimates based on 2013 Feasibility Study.
  • 4.
    SIGNIFICANT COPPER RESOURCE 4 Casinois one of the largest undeveloped copper deposits… Notes: Peer group data as per latest company documents and public files. Copper equivalent calculations based on US$2.00/lb copper; US$875/oz gold; US$11.25/lb molybdenum; and US$11.25/oz silver, with no discount for metallurgical recovery, except NorthMet, which is based on their copper equivalent calculations. Proven & Probable Reserves Measured & Indicated Resources Inferred Resources Developing Canada’s Premier Copper-Gold Mine
  • 5.
    SIGNIFICANT GOLD RESOURCE 5 …andalso one of the largest undeveloped gold deposits. Notes: Peer group data as per latest company documents and public files. Gold equivalent calculations based on US$2.00/lb copper; US$875/oz gold; US$11.25/lb molybdenum; and US$11.25/oz silver, with no discount for metallurgical recovery. Proven & Probable Reserves Measured & Indicated Resources Inferred Resources Developing Canada’s Premier Copper-Gold Mine
  • 6.
    6 WHY WRN ANDTHE CASINO PROJECT? 6Developing Canada’s Premier Copper-Gold Mine *Notes: Goldman Sachs (July 2016) and IRR based on 2013 Feasibility. See Appendix. World Class Project • Ranked #1 Economic Copper Project by Goldman Sachs Robust Economics • Greater than 16% IRR (after-tax) Maintained Throughout Recent Downturn Ideal Location • Yukon, Canada is a Stable, Mining-Friendly Jurisdiction • Recent Entry of Goldcorp to Area Confirms District Potential Gold and Copper • Revenue Evenly Split Between Copper and Gold at Spot Prices Healthy Treasury • Company History of Fiscal Discipline Solid Track Record • Accomplished Development Team
  • 7.
    KEY MANAGEMENT TEAMWITH SUCCESSFUL TRACK RECORD • Extensive experience in mineral development, financing, property acquisition and evaluation. Formerly Chairman & CEO of Western Silver Corporation. • Formerly Project Manager for Bechtel Engineering and Western Silver Corporation. • Metallurgical Engineer with significant management and metallurgical experience in increasingly senior roles with BHP, Placer Dome and Barrick. • Has been CFO since 2006. Previously Controller of Western Silver Corporation during Glamis Gold takeover. Paul West-Sells, PhD – President & CEO Julien Francois, CPA, CA – VP Finance & CFO Dale Corman, B.Sc., P.Eng – Executive Chairman Cameron Brown, P.Eng – VP Engineering Developing Canada’s Premier Copper-Gold Mine 7
  • 8.
    8 KEY FINANCIAL INFORMATION DevelopingCanada’s Premier Copper-Gold Mine Cash & Short Term Investments C$ 8.6 million Working Capital C$ 8.5 million Short/Long Term Debt $Nil Management & Board 8% Private Investors* 53% Institutional Investors 3% Other 37% Common Shares 100% Share Price C$ 1.04 Market Cap C$ 98 M Common Shares 94,448,936 Options 4,638,334 Warrants - Fully Diluted 99,087,270
  • 9.
  • 10.
    10 SIGNIFICANT DEVELOPMENT PROGRESS DevelopingCanada’s Premier Copper-Gold Mine May 2006  • Spin-out from Western Silver Transaction with Glamis (Goldcorp) Nov 2006  • Acquired Casino Project from Lumina Resources 2008-2012  • Two Pre-Feasibility Studies Completed and Drilling to 100,000 m Jan 2013  • Bankable Feasibility Study Completed Jan 2014  • Submitted Environmental Assessment Application Jan 2016  • Referred to a Panel Review 2016+ • Progress Through Permitting and Secure a Project Financing Solution ~ Permits and Funding Obtained ~ Start • Start Construction (road construction may start earlier) +2 years • Production – Gold Heap Leach +4 years • Production – Milling Operation
  • 11.
    11 WORLD CLASS MINERALRESOURCE & RESERVE Developing Canada’s Premier Copper-Gold Mine INFERRED RESOURCE = 1.7 B TONNES RESERVE = 1.12 B TONNES 0 m 250 m 500 m > 0.25% CuEq < 0.25% CuEq Cross section of GEMS Block Model, 6958500N Source: 2013 Feasibility Study. See Appendix for detailed Casino mineral resource & reserve estimates. Mineral resource estimate based on 0.25% CuEq cut-off. • MILL ORE 965 Mt @ 0.50% CuEq • HEAP LEACH 157 Mt @ 0.29 g/t Au • LIFE OF MINE 22 YEARS OPEN AT DEPTH
  • 12.
    12 Long Term Spot Copper (US$/lb) 3.002.15 Gold (US$/oz) 1,400 1,335 Molybdenum (US$/lb) 14.00 7.25 Silver (US$/oz) 25.00 19.00 Foreign Exchange (US$:C$) 0.95 0.77 NPV @ 8% (C$ M) 2,820 2,450 IRR (100% equity) (%) 24.0 22.8 NPV @ 8% (C$ M) 1,830 1,570 IRR (100% equity) (%) 20.1 19.0 Cash Flow (Y1-Y4) (C$ M/y) 680 650 Cash Flow (LOM) (C$ M/y) 400 360 PAYBACK (years) 3.0 3.0 PROJECT ECONOMICS Pre-TaxAfterTax Developing Canada’s Premier Copper-Gold Mine Source: 2013 Feasibility Study. See Appendix.
  • 13.
  • 14.
    14 PRODUCTION BY YEAR DevelopingCanada’s Premier Copper-Gold Mine 0 50 100 150 200 250 300 350 400 450 500 1 2 3 4 5 6 7 8 9 10 11 12 13 14 15 16 17 18 19 20 21 22 Copper(millionlbs),Gold(thousandozs) Production Year Y1 to Y4 22 YRS Grade % CuEq 0.70 0.50 Copper production (M lb/y) 245 171 Gold Production (k oz/y) 399 266 Silver Production (k oz/y) 1,777 1,425 Moly Production (M lb/y) 15.3 15.5 Strip Ratio 0.49 0.59 Net Smelter Return ($/t milled) 31.59 22.59 Operating cost ($/t milled) 8.52 Copper Gold Note: based on Long Term Metal Prices and 2013 Feasibility Study. See Appendix.
  • 15.
    MINE COSTS $Millions Mining Equipment & Mine Development 454 Concentrator (incl. related facilities) 904 Heap Leach Operation 139 Camp 70 Subtotal Mine Direct Costs 1,566 Indirect Costs 295 Subtotal Mine Direct & Indirect Costs 1,861 INFRASTRUCTURE COSTS Power Plant 209 Access Road 99 Airstrip 24 Subtotal Infrastructure 332 Contingency 218 Owners Costs 44 GRAND TOTAL 2,456 FEASIBILITY STUDY – JANUARY 2013 Note: based on 2013 Feasibility Study, see “Notes” slide in Appendix. Developing Canada’s Premier Copper-Gold Mine 15
  • 16.
    16 CAPEX COMPARABLE TOOTHER GREENFIELD PROJECTS Developing Canada’s Premier Copper-Gold Mine Source: Goldman Sachs Global Investment Research (July, 2016) Sentinel LosHelados Baimskaya NewProsperity ElPilar Haquira Asmara PumpkinHollow Josemaria Pebble Carrapateena CanariacoNorteCandente TiaMaria Kamoa AnnMason LosCalatos Casino MinaJusta Tampakan TacaTaca Bystrinsky Toromocho Ajax LaGranja HarperCreek Rosemont EncuentroOxides Cristalino CopperCreek Udokan IncadeOro Aynak ElPachon AguaRica Quellaveco FriedaRiver CobrePanama Constancia Galeno Cotabambas Resolution ProjectCorridor KingKing Tominsky SantoDomingo LasBambas Zafranal SchaftCreek SierraGorda Bozshakol Antucoya CerroCasale Aktogay WafiGolpuStage1 Koksay TwinMetals Caserones $0 $5,000 $10,000 $15,000 $20,000 $25,000 $30,000 $35,000 $40,000 UnitCapex(US$/tCuEq/y)
  • 17.
  • 18.
    18  Strengthened Engineering •Established Independent Engineering Review Panel to review tailings facility. • Agreements Signed with M3 Engineering and Technology to Build and Potentially Operate the Mine • MOU signed with Siemens to Supply, Operate, and Fund Power Plant • Agreement with FLSmidth Establishing Pricing Mechanism for Equipment CONTINUING TO DE-RISK PROJECT Developing Canada’s Premier Copper-Gold Mine
  • 19.
    19  Strong CommunityOutreach • Ongoing Engagement with Local Communities • Significant Yukon Government Collaboration and Support • Federal Government Support as Part of $200M Infrastructure Request • 10 Years Operating in the Yukon CONTINUING TO DE-RISK PROJECT Developing Canada’s Premier Copper-Gold Mine
  • 20.
    CONTINUING TO DE-RISKPROJECT Developing Canada’s Premier Copper-Gold Mine 20  First Nations • We are Committed to Developing the Casino Mine With our First Nations Partners • Casino Project is Located in Area With Settled First Nations Land Claims • Cooperation Agreements Signed With Selkirk First Nation, Little Salmon/Carmacks First Nation and Tr’ondëk Hwëch’in • Minto Mine Within the Selkirk First Nation Territory
  • 21.
    Fixed Timelines: 15Months of YESAB Time to Review Project and Issue Decision Final Decision: Either Recommend or Not Recommend Project to Proceed YESAB PANEL REVIEW PROCESS Developing Canada’s Premier Copper-Gold Mine 21 YESAB REVIEW TIMELINE February 18, 2016  • Project Requires Panel Review March 18, 2016  • Request Approved from Environment Minister June 20, 2016  • YESAB Compiles List of Additional Information to be Submitted ~18 months • Company Completes and Submits Additional Information to YESAB ~ 1 month • YESAB Establishes Panel and Sets Terms of Reference < 15 Months (YESAB) • Panel Review and Recommendation Issued
  • 22.
  • 23.
    23 RECENT SIGNS OFMARKET IMPROVEMENT Developing Canada’s Premier Copper-Gold Mine Source: Bloomberg Article February, 2016 • Gold Equites Have Risen with Gold Price and Renewed Interest in the Sector • M&A Activity in Sector is Significant (Kaminak, Reservoir, etc.) • Copper Prices Have Stabilized Above US$2/lb • Beginning to See New Investment in Copper Production (Olympic Dam, Oyu Tolgoi) • Base Metal Equities Have Begun to Move
  • 24.
    24 SELECT PRECEDENT BASEMETAL DEVELOPER TRANSACTIONS Developing Canada’s Premier Copper-Gold Mine 0.00x 0.25x 0.50x 0.75x 1.00x 1.25x ThompsonCreek> Terrane HudBay> Norsemont Capstone>FarWest Stillwater> Peregrine Mercator>Creston Moly CupricCanyon> HanaMining Lundin>EagleMine PanAust>Frieda RiverProject HudBay>Augusta FirstQuantum> Lumina Nevsun>Reservoir WesternCopper& Gold 2 Average P/NAV: 0.62x Price/NetAssetValue Announce Date April-16 2010 2011 2012 2013 2014 Note: Based on information provided by National Bank analysts, April 2016. Please note that any opinions, estimates or forecasts regarding Western Copper and Gold’s performance made by these analysts are theirs alone and do not represent opinions, forecasts or predictions of Western Copper and Gold or its management. 
Western Copper and Gold does not by its reference above or distribution imply its endorsement of or concurrence with such information, conclusions or recommendations. 2016 YTD
  • 25.
    25 Royalty Sales ConfirmProject Value ROYALTY SALE CONFIRMS VALUE Developing Canada’s Premier Copper-Gold Mine Price – 5% NPI1 ~$28 M Price – 5% NPI to 2.75% NSR $32 M Total Price – NSR $60 M Net Present Value of Royalty2 $230 M 1 – Estimated by Western Copper and Gold. For further information refer to Strategic Metals Ltd. news release dated August 10, 2012. 2 – Based on 2013 Feasibility Study assumptions, discounted at 8%; using Long Term Metal Prices. See Appendix. VALUATION METRICS
  • 26.
    26 ANALYST COVERAGE Developing Canada’sPremier Copper-Gold Mine Alec Meikle Tel: (416) 943-6729 Note: Western Copper and Gold is followed by the analysts listed above. Please note that any opinions, estimates or forecasts regarding Western Copper and Gold’s 
performance made by these analysts are theirs alone and do not represent opinions, forecasts or predictions of Western Copper and Gold or its management. 
Western Copper and Gold does not by its reference above or distribution imply its endorsement of or concurrence with such information, conclusions or recommendations. Heiko F. Ihle, CFA Tel: (212) 356 - 0500 Thank You
  • 27.
  • 28.
    28 SHARE PERFORMANCE EA Submitted Appendix Source:Yahoo! Inc. Referred to Panel Review
  • 29.
    29 40 years experienceas a senior corporate officer of publicly listed companies. Extensive expertise in mineral exploration & development, financing, property evaluation and acquisition. Formerly Chairman & CEO of Western Silver Corporation. Former two term elected member of the Yukon Legislative Assembly appointed as Minister of Energy Mines and Resources (2002-2008), Minister of Highway and Public Works (2008-2011) and Minister of Community Services (2008-2011). Mr. Lang is experienced in developing and managing projects in consultation and partnership with all levels of government, including First Nations. Formerly Partner of Peat Marwick Mitchell. Directed the accounting and financial matters of public companies in the resource and non-resource fields since 1987. Currently Mr. Gayton sits on the Board of Directors of Amerigo Resources Corp., B2 Gold Corp. and Nevsun Resources Ltd. 30+ years experience in the investment management business. Formerly Senior Partner of Beutel Goodman, a value management company dealing in equity and fixed income assets. Currently manages Roxborough Holdings Ltd., a family owned private equity holding company. Mr. Williams also sits on the Board of Directors of Atlantis Systems and SQI Diagnostics. 30+ years experience in the mineral industry. Financed, built and managed mines worldwide. Formerly Senior VP of Teck Cominco. Currently Executive Chairman of Amerigo Resources Corp., Chairman and Director of Los Andes Copper Ltd., and a Director of Tahoe Resources Inc. BOARD OF DIRECTORS Appendix
  • 30.
  • 31.
    31 REVENUE DISTRIBUTION Appendix Y1 toY4 LOM % of Revenue – Copper ($3) 48% 46% % of Revenue – Gold + Silver 40% 37% % of Revenue – Gold ($1,400) 37% 34% % of Revenue – Silver ($25) 3% 3% % of Revenue – Moly ($14) 12% 17% Y1 to Y4 LOM % of Revenue – Copper ($2.15) 44% 43% % of Revenue – Gold + Silver 48% 46% % of Revenue – Gold ($1,335) 45% 43% % of Revenue – Silver ($19.00) 3% 3% % of Revenue – Moly ($7.25) 8% 12% Note: based on 2013 Feasibility Study, see “Notes” slide in Appendix.
  • 32.
    32 PROJECTED OPERATING COSTS Appendix ($/tonne) Milling$5.13 Mining $3.05 General & Administrative $0.34 Total $8.52 ($/tonne) Heap Leach Operation $1.31 ADR/SART $2.73 Total $4.04 Note: based on 2013 Feasibility Study, see “Notes” slide in Appendix.
  • 33.
    33 BEST IN CLASSOPERATING COSTS Appendix US$/lb Cash Costs (Copper) 2.95 By-product Revenue (3.76) Cash Cost (net of by-products) (0.81) NSR Royalty 0.17 Yukon Royalty & Taxes 0.37 Reclamation Cost 0.03 Sustaining Capital Expenditure 0.10 All-in Cost (0.13) Note: based on 2013 Feasibility Study and Long Term Metal Prices. See Appendix.
  • 34.
    34 CASINO AS ACOPPER COMPANY Developing Canada’s Premier Copper-Gold Mine Source: 2013 Feasibility Study. See Appendix. Base Spot Cash Cost Net of By-Product ($/lb) (0.81) (0.79) Co-Product Cash Cost (Cu) US$/lb 1.35 1.26 Y 1-4 LOM Copper Production (M lbs/year) 245 171 Copper Equiv. Production (M lbs/year) 516 382 Reserve Inferred Resource Total Copper (lbs) 4.5 B 5.4B Total Copper Equivalent (lbs) 11.4 B 13.9 B
  • 35.
    35 CASINO AS AGOLD COMPANY Developing Canada’s Premier Copper-Gold Mine Source: 2013 Feasibility Study. See Appendix. Base Spot Cash Cost Net of By-Product ($/oz) (999) (497) Co-Product Cash Cost (Au) US$/oz 629 784 Y 1-4 LOM Gold Production (k oz/year) 399 264 Gold Equiv. Production (k oz/year) 1,179 872 Reserve Inferred Resource Total Gold (oz) 8.9 M 9.0 M Total Gold Equivalent (oz) 26.2 M 31.7 M
  • 36.
    PROCESSING MILLING • Throughput: averageLOM 124,000 tonnes per day • Grinding Circuit: 40 ft SAG Mill (29 MW) + 2 x 28 ft Ball Mills (22 MW each) • Medium – soft ore: BWi – 14.1 kWh/t, 200 µm primary grind FLOTATION • Conventional copper/moly circuit • Recoveries: Copper 86%, Gold 67%, Moly 71%, Silver 53% • Sulfide removal circuit to produce suitable tailings for dam construction HEAP LEACH • Conventional crush/conveyer stack valley fill heap leach • 25,000 tonnes per day • SART to remove copper from solution • Recoveries: Gold 66%, Silver 26%, Copper 18% 36Appendix
  • 37.
    EXCELLENT CONCENTRATE QUALITY ElementAvg Value Unit Copper 28 % Gold 25 g/t Silver 120 g/t Molybdenum 0.05 % Iron 26 % Sulphur 36 % Arsenic 200 g/t Antimony 250 g/t Mercury 1 g/t Cadmium 40 g/t Fluorine 100 g/t Silica 2 % Appendix Element Avg Value Unit Molybdenum 57.4 % Copper 0.39 % Rhenium 133.5 g/t Iron 0.8 % Sulphur 37.9 % Arsenic 1659 g/t Antimony 100 g/t Mercury <1 g/t Cadmium 30 g/t Fluorine ND g/t Silicon 1.74 % Copper Concentrate Molybdenum Concentrate 37 Note: based on 2013 Feasibility Study, see “Notes” slide in Appendix.
  • 38.
    38 CASINO – MINERALRESERVE & RESOURCE ESTIMATES Appendix Note: based on 2013 Feasibility Study. See “Notes” Slide in Appendix.
  • 39.
    39 2013 Feasibility Study •Technical report entitled "Casino Project, Form 43-101 Technical Report Feasibility Study, Yukon, Canada – Revision 1" dated January 25, 2013, a copy of which is available on Western Copper and Gold's website at www.westerncopperandgold.com and under its profile at www.sedar.com • Prepared by Conrad E. Huss, P. E., Thomas L. Drielick, P.E., Jeff Austin, P. Eng., Gary Giroux, P. Eng., Scott Casselman, P.Geo. Graham Greenaway, P. Eng., Michael G. Hester, FAus IMM, and Jesse Duke, P. Geo.; each of whom is a qualified person pursuant to National Instrument 43-101 ("Qualified Person") The technical information in this presentation is based on the following key assumptions: • "Long Term Metal Prices" were based on typical analyst projections of long term metal prices and $CAN:$US exchange rates • Capital and operating cost projections based on a foreign exchange rate of C$1.00 = US$1.00 Mineral Resource Cut-off grades: • Supergene & Hypogene Zones at CuEq cut-off 0.25% • Leached Cap / Oxide Zones at Cut-off Au 0.25 g/t • No discount for metallurgical recovery in contained metal figures Copper equivalent calculations in this presentation are based on: • US$2.00/lb copper; US$875/oz gold; US$11.25/lb molybdenum; and US$11.25/oz silver Technical information contained in this presentation is based on the 2013 Feasibility Study prepared by or under the supervision of the Qualified Persons noted above. NOTES Appendix
  • 40.