The document examines whether rising household debt or energy costs were more responsible for the 2008 economic crisis. It analyzes three ratios: 1) household financial obligations as a percentage of income, which includes debt payments but not energy costs; 2) household energy expenditures as a percentage of income; and 3) total household obligations, which combines 1) and 2). While the financial obligations ratio rose in recent decades, the total obligations ratio declined from 1980 to 2000 due to falling energy costs. The total ratio surged in 2008, possibly better explaining the recession than the smaller rise in just the financial obligations ratio. The total obligations ratio has since declined substantially, suggesting consumer recovery may be quicker than expected.
The document analyzes debt levels across various sectors in the US economy following the 2008 financial crisis to determine if conditions are ripe for a sequel to the book and film "The Big Short." It finds that household, financial institution, corporate, and state/local government debt all improved significantly from crisis levels. While federal debt ballooned, interest payments remain a small percentage of spending for now. With debt trends healthier overall, the conditions that caused the crisis are unlikely to reoccur, so a sequel called "The Big Short 2" would lack a true story to be based on.
The next President will need to confront a number of budgetary challenges and will likely sign into law many federal tax and spending changes. Yet too often, election campaigns are about telling voters what they want to hear rather than what they need to know. To separate fiction from reality, the new Fiscal FactChecker series will monitor the 2016 Presidential campaign on an ongoing basis. To start with, we have identified 16 myths that may come up during the campaign.
The document discusses the national debt of the United States, which currently stands at over $18 trillion. It explores the history of rising US debt levels and the economic effects of increasing versus consolidating the debt. Increasing debt leads to higher interest rates, less investment, and reduced GDP growth. Consolidating debt has short-term negative effects but long-term benefits like lower interest rates and more funding for programs. The document also examines threats of sovereign default and financial crises based on examples from other countries.
A Cosmopolitan Proposal for Balancing Budgetsguest13df98
The document discusses how the global economic crisis is hurting municipal budgets nationwide, including in Gotham City. It proposes several ways Gotham City could balance its budget, such as by increasing property taxes, making cuts to agency budgets, or generating revenue from special events organized with community support.
In the coming months and years, lawmakers will face a number of important budget-related deadlines, or Fiscal Speed Bumps, that will require legislative action. These Fiscal Speed Bumps will present challenges, risks, and opportunities. Addressed irresponsibly, they could cause serious disruptions and/or add as much as $3 trillion to the debt over the next decade above what current law would allow. But if dealt with thoughtfully, they offer an opportunity to pursue reforms that would grow the economy, improve the policy landscape, and reduce the risk of an uncontrollably growing national debt.
The household debt service ratio (DSR) measures the percentage of disposable personal income that goes toward paying household debt including mortgages and consumer debt. A higher DSR means consumers have more debt burden and are likely to cut back on spending, potentially leading to economic downturn. Data from the Federal Reserve shows the US DSR rose sharply during the 2007-2008 financial crisis but has since stabilized around 9-10%, indicating consumer financial stability. Graphs comparing consumer spending, GDP growth, and government budgets in the US and UK suggest consumer spending levels correlate with overall economic and fiscal conditions.
1) The document discusses the ongoing process of deleveraging (reducing debt levels) in developed countries since the 2008 financial crisis. It focuses on the experiences of the US, UK, and Spain.
2) US households have reduced their debt levels the most so far (4% decrease), possibly being halfway through the deleveraging process. UK and Spanish households have deleveraged much less (under 1% decrease).
3) Historical examples suggest countries can take 5-7 years to complete deleveraging. Private sector debt reduction typically precedes public sector deleveraging, which usually only occurs after GDP growth rebounds.
This document discusses trends in the global economy and implications for private equity. It analyzes the unprecedented levels of debt in the US economy and ongoing deleveraging process across sectors. Deleveraging involves debt repayment and defaults, which reduces spending and availability of credit, lowering asset prices and economic activity. The housing market downturn and end of mortgage equity withdrawals have further depressed the US economy into its most severe recession since WWII. Globalization of credit issues has spread the crisis to Europe and emerging markets through channels like falling trade and commodity prices.
STATEN DIE ECONOMIE ZOUDEN LATEN VALLEN, ASSOCIEERT MICRON GEOPENBAARDEwelford uniacke
Credit card debt is the third largest source of indebtedness in the US: Credit card debt management is the solution
According to the reports of the financial analysts, credit card debt is reportedly been the third largest source of household indebtedness only after the $14 trillion in the mortgage debt market and $1 trillion in the student loan debt market. Studies reveal that the average household owes a huge amount on credit cards but the average debt is gradually falling in the first quarter of 2012. Since the same time in 2010, the amount is down nearly by $2000. Does this show that the Americans are repaying their credit card debts? Or are they just walking away from their debt? Though there are so many professional debt relief options that you can take resort to when you fall in debt, most of them are choosing the debt management plan as it tends to help a person pay back debt and also boost his credit score at the same time.
Housing Market and Economic Outlook: July 2011REALTORS
- The housing market showed signs of improvement in the first quarter of 2011 compared to 2010, though sales were still down in many areas due to the end of the homebuyer tax credit.
- Job growth and economic factors like rising stock markets and rents are expected to support a more stable housing market going forward, with annual sales growth projected around 4% without tax credits.
- However, uncertainty remains around potential policy changes in Washington and high unemployment could continue hindering the recovery.
The document discusses two topics:
1. Housing affordability has returned to pre-bubble levels in many US markets according to a Moody's analysis, as the ratio of home prices to household income has fallen to its lowest level in 35 years.
2. The US Treasury Department released a report on reforming the US mortgage market that outlines three options but will take years to implement, shaping the future of mortgage liquidity and affordability.
3. The author notes their company's business model ensures they can continue serving clients through any housing reforms.
The Financial Crisis in Pictures: Antecedents of the CrisisAmy Kundrat
The US economy was weakening in the years leading up to the 2008 financial crisis, as productivity and labor force growth slowed, reducing potential GDP growth. Income inequality was rising to high levels not seen since the 1920s. Household debt levels, particularly mortgage debt, rose sharply as a share of income. Meanwhile, the financial system became increasingly fragile as risk migrated outside of regulated banks and the use of short-term funding like repo agreements tripled. Regulatory capital requirements were inadequate and did not account for the growing risks in the system. These factors created instability in the economy and financial system that contributed to the conditions for the 2008 crisis.
The residential and now commercial mortgage problem is still the biggest
issue facing the U.S. Economy. A year ago, I presented this Powerpoint
Slide show, "The Mortgage Mess" (see the attachment). It is very
interesting to see what has happened in the past almost 12 months.
* The situation has become worse, not better, in spite of throwing
hundreds of billions of dollars at the problem. The TARP funds were not
used as intended, and are being redirected for other purposes.
* The problem hasn't gone away. There will be as many foreclosures in the
next couple of years as have already occurred. One out of every seven
houses in the country is underwater: the home values are less than the
mortgages on the homes.
* Although the GDP shows some slight improvement, that is mostly due to
artificial stimulus, which cannot last.
* We are still losing 200,000 jobs every month; better than the 700,000
per month we were losing in the Spring, but still increasing nonetheless.
* Mark Zandi of Moody Economics has said within the last two days that
unemployment can be expected to peak at 10.6%; when counting in those who
have stopped looking and those who are underemployed (the engineer flipping
burgers), it is closer to 18% - 20%. Such unemployment rates cannot sustain
any solid economic recovery.
* The credit card bust is well underway. Whereas there were 400 million credit cards issued a year, now there are only 300 million in circulation,
and interest rates have increased significantly.
What is the "fiscal cliff"? It's the term being used by many to describe the unique combination of tax
increases and spending cuts scheduled to go into effect on January 1, 2013.
The document summarizes recent economic and real estate market trends. It discusses steps the government has taken to boost the economy through unemployment assistance and mortgage relief programs. Real estate indicators like home sales, prices, inventory and mortgage rates are also summarized. The document concludes with tips for home energy efficiency tax credits.
Elmhurst college thomasjohnson-taxpresentation 1 26 11 updatedStorer Rowley
This document discusses the fiscal challenges facing Illinois, including large budget deficits, unpaid bills, and underfunded pensions. It analyzes factors like declining tax revenues, high spending growth rates, and the state's debt obligations. Several reform proposals are presented, such as consolidating programs, reducing prison populations, privatizing higher education, and reengineering relationships between state and local governments. Overall, the document examines Illinois' budget shortfalls in detail and offers ideas for cutting costs and improving the state's fiscal situation.
The document provides an overview of recent developments in the US real estate market. It summarizes key data points like home sales, prices, inventory, and mortgage rates. It also outlines recent government actions to provide mortgage relief to unemployed homeowners and help underwater borrowers. New bills aim to stimulate hiring and the economy. The document concludes with tax tips for home energy efficiency upgrades.
The document summarizes recent developments in the US real estate market. It discusses signs of economic recovery and government efforts to boost the jobs market and help homeowners. Data shows existing home sales softened in February but prices remain low. Inventory is up while mortgage rates are near historic lows, improving affordability. The government aims to assist the unemployed and underwater homeowners to prevent foreclosures. New bills offer tax credits for home energy improvements and incentives to hire and retain employees.
A View at the Financial Collapses in the United States and the Evolution of t...Joel Stitt
MBA Thesis presentation on United States Financial Collapses, specifically the Housing Market Crash of 2008 and the Great Depression, and the evolution of the banking and financial services industry over the past century
The Wall Street-caused financial crisis and ongoing economic downturn have cost the American people an estimated $12.8 trillion so far. This includes actual losses in GDP as well as additional losses avoided through government spending and Federal Reserve actions. The crisis resulted in tens of millions of unemployed Americans, massive losses in household wealth totaling $19 trillion, and huge government bailouts and support programs. While the full costs are impossible to calculate, $12.8 trillion likely understates the true financial toll of the crisis on the US economy and its citizens.
- Missouri is facing major budget issues as state revenues have declined significantly due to the economic downturn. Federal stabilization funds have helped but will run out, leaving a large shortfall.
- State revenues are down 10% in the first quarter of FY2010 and are projected to decline further. Unemployment will remain high.
- Governor Nixon has already implemented $200M in budget cuts for FY2010 but further cuts will likely be needed. The stabilization funds have masked the true budget problems.
- When the federal funds expire after FY2011, Missouri faces a major fiscal crisis without new revenue sources or job growth to boost the economy.
Mercer Capital's Bank Watch | January 2018 | Credit Quality at a CrossroadsMercer Capital
Brought to you by the Financial Institutions Team of Mercer Capital, this monthly newsletter is focused on bank activity in five U.S. regions. Bank Watch highlights various banking metrics, including public market indicators, M&A market indicators, and key indices of the top financial institutions, providing insight into financial institution valuation issues.
Greenville Upstate Mortgage Bankers Association Economics Presentationdougiemac1
The document summarizes an economic outlook presentation given to an Upstate Mortgage Lenders Association. It discusses the current national economic environment including weak consumer spending, a struggling job market, and declining home prices. It also summarizes provisions of the new Housing and Economic Recovery Act and addresses questions about the housing market and mortgage industry.
This document provides a summary of major developments affecting the taxation of insurance companies in 2008. It describes the significant economic turmoil that year, including the collapse of major financial institutions like Bear Stearns, Lehman Brothers, and AIG. Government intervention increased through the year with billions of dollars in loans and investments provided to struggling companies. The turmoil dominated headlines and impacted many aspects of the insurance industry as well.
State of the Construction and Surety Industry Report (2009)Lisa Dehner
This document provides an overview of the state of the U.S. economy, construction industry, and surety industry. It finds that the current recession began in December 2007 and is the longest since the Great Depression. Both the construction industry and stock market typically follow trends in GDP. While the private construction sector has declined, public construction is forecast to grow due to a $131 billion stimulus package. Contractor profits are decreasing and surety losses are expected to rise in the coming years as economic conditions remain challenging.
The document summarizes the global economic outlook following the 2008 financial crisis. It discusses different theories on the shape and strength of economic recoveries after financial crises. It then analyzes the economic situations and outlooks of various regions and countries around the world, including challenges faced by developed economies in Europe and growth prospects for emerging economies such as China, India, and countries in the Middle East.
SPC is a third generation, family-owned, mid-size direct marketing company that takes a consultative approach and helps clients respond with agility and effectiveness. It has multiple production facilities and sales offices across the Midwest and other parts of the country. SPC applies its expertise and assets to help clients build their brands and businesses through data-driven and sustainable communications solutions.
Mortgage Network, Inc. is a large, independent mortgage company founded in 1988 with 34 regional lending offices. They offer a variety of mortgage solutions including fixed and adjustable rates, government programs, commercial financing, and reverse mortgages. As a direct lender, they have more control over the loan process compared to brokers. They pride themselves on providing exceptional customer service and competitive rates.
Realtors Recent Industry Changes 0909 B KellyBill Kelly
The document summarizes recent changes to the mortgage industry, including the Home Valuation Code of Conduct (HVCC) which prevents loan officers from selecting appraisers, the Mortgage Disclosure Improvement Act (MDIA) which requires new Truth-in-Lending disclosures if loan terms change, updated condo financing guidelines, and the impact of credit scores on interest rates and costs. It promotes using Mortgage Network for their expertise navigating these changes and providing financing solutions.
Este documento describe diferentes tipos de topologías de redes de computadoras, incluyendo redes WAN que cubren grandes distancias como países o continentes, redes LAN limitadas a edificios o campos de hasta 1 km, redes en bus donde todos los dispositivos comparten el mismo canal de comunicación, redes en anillo donde cada estación está conectada a la siguiente formando un ciclo, redes en estrella con todas las estaciones conectadas a un punto central, y redes en árbol donde los nodos se conectan de forma jerárquica.
Concorso a premi " W La Tuscia"
Puoi vincere 80 litri di olio d'oliva EVO, olio DOP di Tuscia.
45 litri del medesimo
weekend x 2 persone da DA BECCONE, NEL CUORE DELLA tUSCIA
Ponencia de Antonio Gimeno Calvo, Director de Marketing de Coguan en el evento de Camerpyme celebrado el 11 de febrero del 2011, enmarcado dentro de los Programas Masemprende.
This document provides various random facts about the human body and other topics. It states that hair grows faster in the morning, glass breaks at over 3,000 miles per hour, and starfish don't have brains. It also shares that ostriches have larger eyes than brains, wearing headphones for an hour increases ear bacteria by 700 times, and laughing benefits stress and immunity.
This 3-slide PowerPoint provides an overview of the Moodle Academy for the 2009-2010 year. Each slide contains a bullet point summarizing a topic, with the presentation introducing the academy, and then two additional slides on unspecified subjects related to the learning management system.
Debasish Mahapatra is a seasoned business analyst and project manager with over 3 years of experience in the IT industry. He has extensive skills in project management, requirements gathering, documentation, and testing. He is proficient in technologies like Java, J2EE, Oracle, and Agile methodologies. Debasish aims to contribute his analytical abilities and expertise in managing software development projects to deliver business solutions.
Title: Senior Business Analyst
Organization: Luminous Infoways Pvt. Ltd.
Role: Project management, system analysis and design, managing development teams, documentation, gap analysis, etc.
Responsibilities include: requirements gathering, documentation, project planning, resource management, risk assessment, stakeholder communication, and managing projects from inception to completion across various domains.
Notable accomplishments include awards, managing large projects, technical recruiting, and project experience across sectors like education, healthcare, government, etc.
This document summarizes economic trends from September 2009. It discusses six factors driving economic growth: 1) massive stimulus spending, 2) businesses reversing purges, 3) rising confidence, 4) housing and auto industries stabilizing, 5) improving exports, and 6) stalled increases in mortgage rates and oil prices. It argues the recovery will continue surpassing expectations with 4% GDP growth. It also says the consumer's role is unclear and inflation will likely remain stable.
1) Asynchronous activities in online classrooms involve threaded discussions where participants post comments, questions, and responses when available rather than at the same time.
2) Participants are expected to check postings regularly, at least three times a week, and respond politely and supportively to continue discussion.
3) The facilitator monitors participation and content to encourage discussion, ask questions, and build community among participants.
Why we will not experience a DepressionGaetan Lion
- The document discusses how government interventions on an unprecedented scale, including fiscal stimulus packages, monetary policy actions, and financial industry bailouts, will help prevent another Great Depression.
- During the Great Depression, bad government policies exacerbated the situation, but current interventions aim to stimulate the economy and stabilize financial markets.
- Corporations, small businesses, and households have strong financial positions and ability to finance themselves, giving government policies time to take effect before a depression could occur.
Mercer Capital's Bank Watch | April 2020 | Ernest Hemingway, Albert Camus, an...Mercer Capital
This document summarizes an article analyzing potential credit risk issues for banks due to the COVID-19 pandemic and economic downturn. It begins by noting that while current asset quality metrics don't yet show issues, bank stock prices have fallen due to expected problems. The article then discusses using the 2008 financial crisis as a reference, noting loan growth was more balanced this time. Historical loss rates are compared to today. Areas of potential concern include commercial and industrial loans and commercial real estate loans to hard-hit industries like hotels and retail. The impacts on rural vs. metropolitan banks are also considered. Rating agency data on at-risk loan categories is presented.
This document discusses the 2008 financial crisis and its impact on the UK. It begins by defining a financial crisis and explaining the housing bubble and subprime lending practices in the US that triggered the crisis. It then discusses the effects in the UK, including falling retail sales, rising unemployment, and GDP declining by 1.5% in the fourth quarter of 2008, officially pushing the country into recession. The document also outlines some measures taken by the UK government to stimulate the economy through recapitalizing banks, loan guarantees, and an asset protection scheme.
Daily Economic Update for December 20, 2010NAR Research
The Federal Reserve reported that the homeowner financial obligations ratio declined by 2.3% in the third quarter, indicating homeowners are less indebted. This decline was primarily due to a 2.3% drop in the consumer obligations ratio which includes consumer debt and car leases. While the mortgage/home related obligations ratio also fell by 0.9%, these financial obligations remain at around 2005 levels which are about ten times disposable income, helping explain the sluggish housing market.
The Great Recession document summarizes the causes and effects of the late-2000s financial crisis and recession in the United States. It discusses how a housing bubble fueled by subprime lending burst, triggering a credit crunch and widespread economic impacts. The recession resulted in job losses, rising unemployment, and high foreclosure rates. Government responses included stimulus packages under Presidents Bush and Obama, as well as financial bailouts. The recovery was predicted to be slow due to persistent effects of financial crises on economic growth.
The US national debt originated from government spending exceeding revenue in a given year. This includes response to economic crises like the 2008 financial crisis and wars in Iraq and Afghanistan, which increased debt levels. Mandatory spending like social security makes up over half the budget and is difficult to cut. Without tax increases or strong economic growth, it will be challenging to reduce the deficit and debt. China is currently the largest foreign creditor to the US, holding around $1 trillion of US debt.
Whitney Holding Corporation reported a net loss of $11.1 million for the first quarter of 2009 compared to a profit of $8.2 million in the previous quarter. The loss was attributed to lower net interest income from margin compression, higher credit costs from rising delinquencies, and increased expenses. Total loans declined by $129 million from the previous quarter due to weak demand. However, the company's capital position remained strong with a tangible common equity ratio of 6.68% at the end of the first quarter.
The document summarizes information about the national debt of the United States from the organization Fix the Debt. It discusses that the national debt is over $18 trillion and growing due to spending exceeding revenue in recent decades. It also notes that the debt levels threaten economic growth and flexibility and will require action to reduce the debt through tax and spending reforms.
Charting the Financial Crisis: A Narrative eBookShavondaBrandon
The global financial crisis of 2007-2009 and subsequent Great Recession constituted the worst shocks to the United States economy in generations. Books have been and will be written about the housing bubble and bust, the financial panic that followed, the economic devastation that resulted, and the steps that various arms of the U.S. and foreign governments took to prevent the Great Depression 2.0. But the story can also be told graphically, as these charts aim to do.
What comes quickly into focus is that as the crisis intensified, so did the government’s response. Although the seeds of the harrowing events of 2007-2009 were sown over decades, and the U.S. government was initially slow to act, the combined efforts of the Federal Reserve, Treasury Department, and other agencies were ultimately forceful, flexible, and effective. Federal regulators greatly expanded their crisis management toolkit as the damage unfolded, moving from traditional and domestic measures to actions that were innovative and sometimes even international in reach. As panic spread, so too did their efforts broaden to quell it. In the end, the government was able to stabilize the system, re-start key financial markets, and limit the extent of the harm to the economy.
No collection of charts, even as extensive as this, can convey all the complexities and details of the crisis and the government’s interventions. But these figures capture the essential features of one of the worst episodes in American economic history and the ultimately successful, even if politically unpopular, government response.
This document discusses the effects of inflation targeting and low interest rates on the development and bursting of the 2008 housing market bubble and credit crisis. It argues that keeping interest rates too low for too long from 2002 to 2004 accelerated housing activity and the sale of mortgages, fueling the growth of a housing bubble. When interest rates were then raised sharply from 2004 to 2006, this likely triggered the bursting of the bubble, as high household debt levels caused disposable incomes to decline sharply. The rapid spread of the subprime mortgage crisis then led to a global financial crisis.
This document provides information about the national debt of the United States from an organization called "Fix the Debt". It discusses that the current national debt is over $13 trillion and is projected to continue rising without action. It outlines some of the main causes of the debt as well as the effects, including higher costs of living and reduced ability to respond to future crises. It argues that reforms are needed to entitlement programs, taxes, and spending to put the debt on a sustainable long-term path.
The Case for AAA Underlying Municipal BondsIan Welch
4
Intent
• Create AAA Underlying Portfolio
• Create Default Resistant Portfolio
• Take advantage of sell side pressure
• Take advantage of negative perception of municipal bond market to amass AAA bonds
After the US dollar replaced gold, the US debt became the attention worldwide, thus the demand for the US dollar continued, furthermore the extremely low interest of the dollar. This helped the US government to borrow great amounts of debt as well as kept the creditors pleased. Due to the pandemic, the US economy retrograded because of the tax cut and unproductive rescue spending plan plus surpassing spending of the government. The rising inflation starts to increase to high levels, which certainly the government must cut back spending or its patterns, while this will lead to uncertain consequences for the long future. This paper discusses several different perspectives on the US government's sustainability as its ability to settle the debt in future, the fate of growth burdened with that debt through the neoclassical mode of growth, and also the effect of anxiety of defaults and unfunded obligations. Inversely, it explores the strength of the dollar with a low-interest rate and its sustainability worldwide. We also propose ways helping of strengthen the fiscal government position and solutions to help the economy recover in long term and to easiest the situation. In the synopsis, we propose something that could affect and shake the global market.
The document discusses the recent turmoil in global financial markets and argues that governments have failed to address the root causes of the economic crisis. It makes three key points:
1) Stock market declines show that the recovery is fragile and a double-dip recession may be on the horizon.
2) Governments have kicked the can down the road rather than fixing underlying problems, and the global economic landscape now has additional constraints making responses more difficult.
3) The US economy in particular remains weak with high unemployment, stagnant GDP, and a large budget deficit, showing similarities to Japan's "lost decade" raising the risk of prolonged low growth in the US.
- Cascade Financial reported a net loss of $4.8 million for Q1 2009 compared to earnings of $2.6 million in Q1 2008, due to increasing its provision for loan losses to $13.9 million.
- Checking deposits grew 83% year-over-year to a record level, while total loans increased 8% to $1.25 billion despite a slowdown in new loan originations.
- Nonperforming loans rose to represent 4.05% of total loans as the weak housing market continued to present challenges, leading to a higher allowance for loan losses.
- The company remained well capitalized with strong capital ratios, while continuing to focus on residential and small business lending to
This document provides an overview of the global financial crisis that began in 2008. It discusses the underlying factors such as easy credit conditions, international trade imbalances, and the bursting of real estate bubbles. It outlines some of the key events in the United States and Europe, such as the failures of Lehman Brothers, AIG, and other large financial institutions. It also summarizes the immediate effects on the economies of the US and UK, including rising unemployment, slowing GDP growth, and falling consumer confidence. Finally, it discusses the impact on and response of the Indian economy, including consequences for exports, the stock market, currency value, inflation, and economic growth.
To
help senior executives weather this economic storm, the Economist Intelligence Unit has updated its
answers to some of the questions most frequently asked by clients, following the publication of the
four previous editions of Global crisis monitor. In answering each question, we outline our current
forecast, explain our thinking, and highlight any key risks or alternative scenarios.
The document discusses the 2008 US economic crisis and its causes and effects. It begins by discussing the relationship between mortgages, the housing crisis, and Wall Street. It then notes how the crisis affected fiscal policy and government intervention. Lastly, it discusses the impacts on GDP, economic growth, inflation, unemployment, and actions needed to restore economic expansion.
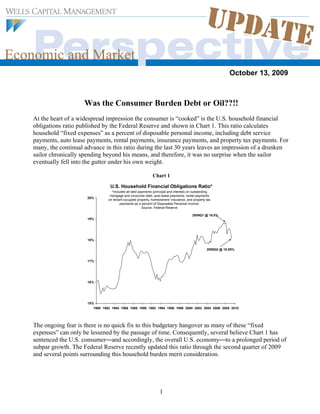
1. October 13, 2009
Was the Consumer Burden Debt or Oil??!!
At the heart of a widespread impression the consumer is “cooked” is the U.S. household financial
obligations ratio published by the Federal Reserve and shown in Chart 1. This ratio calculates
household “fixed expenses” as a percent of disposable personal income, including debt service
payments, auto lease payments, rental payments, insurance payments, and property tax payments. For
many, the continual advance in this ratio during the last 30 years leaves an impression of a drunken
sailor chronically spending beyond his means, and therefore, it was no surprise when the sailor
eventually fell into the gutter under his own weight.
Chart 1
U.S. Household Financial Obligations Ratio*
*Includes all debt payments (principal and interest) on outstanding
mortgage and consumer debt, auto lease payments, rental payments
20%
on tenant-occupied property, homeowners' insurance, and property tax
payments as a percent of Disposable Personal Income.
Source: Federal Reserve
2008Q1 @ 18.8%
19%
18%
2009Q2 @ 18.05%
17%
16%
15%
1980 1982 1984 1986 1988 1990 1992 1994 1996 1998 2000 2002 2004 2006 2008 2010
The ongoing fear is there is no quick fix to this budgetary hangover as many of these “fixed
expenses” can only be lessened by the passage of time. Consequently, several believe Chart 1 has
sentenced the U.S. consumer—and accordingly, the overall U.S. economy—to a prolonged period of
subpar growth. The Federal Reserve recently updated this ratio through the second quarter of 2009
and several points surrounding this household burden merit consideration.
1
2. Examining the Financial Obligations Ratio?!??
As illustrated in Chart 1, the financial obligations ratio has improved surprisingly fast since it peaked
in the first quarter of 2008. Already, the burden has dropped from 18.8 percent to about 18 percent
due to a combination of write downs of bad debt, some runoff of debt not replaced, and lowered
payments through refinancing. In any event, from its peak, the ratio has already declined by more in
the last five quarters than it rose between the end of 2001 and the beginning of 2008! Lest you think a
0.75 percent drop in the obligations ratio is not much to consider since the mid-1980s this ratio has
rarely been outside the range of 17 percent to 19 percent. At about 18 percent, it has already retraced
almost 50 percent (about 1 percent of a 2 percent range) of its historic range during the last 25 years,
it is little different than it was in 1987 and less than it was in 2001.
We also note the financial obligations ratio has changed little in the last decade. Although it rose
some between 2006 and 2007, does the rise in recent years really explain the complete collapse of
consumer spending and the economy in 2008? Or, could other factors be equally responsible? In
particular, was the 2008 economic collapse primarily the result of a rising household financial
obligations ratio or was it due to a surge in household energy costs?
2008 Crisis ….. A Debt Crisis or an Energy Crisis???!
We fail to understand why energy cost (also an essential and largely “fixed expense” for most
households) is not included in the household obligations ratio (particularly since the obligations ratio
seems to include almost every other “necessary” household expense). Chart 2 illustrates the U.S.
household energy obligations ratio (i.e., household spending on energy goods and services as a
percent of disposable personal income). In the last 30 years, as a proportion of overall disposable
personal income, the oscillation in the energy burden has actually been larger than changes in the
financial obligations burden. Since 1980, the energy burden has fluctuated by about five percentage
points (between about 3.5 percent and 8.5 percent), whereas the obligations ratio has swung by only
about 3.5 percent (from 15.5 percent to about 19 percent). Therefore, changes in the energy burden
are at least as important as changes in the financial obligations ratio in determining household
behaviors. Indeed, is the household recession of 2008 better explained by an approximate 1 percent
increase in the financial obligations ratio during the recovery or by the almost 3 percent surge in the
household energy burden over the same period?
2
3. Chart 2
U.S. Household ENERGY Obligations Ratio**
**Total Household Expenditures on Energy Goods and Services as a
percent of Disposable Personal Income.
8.5%
8.0%
7.5%
7.0%
2008Q3 @ 6.3%
6.5%
6.0%
5.5%
5.0%
4.5%
4.0% 2009Q2 @ 4.4%
3.5%
1980 1982 1984 1986 1988 1990 1992 1994 1996 1998 2000 2002 2004 2006 2008 2010
Is the U.S. Consumer Rational or Simply Foolish????
A widespread and common perception is the U.S. consumer has simply been irresponsible! For the
last 30 years, U.S. households have continuously spent beyond their means, destroying savings and
leading to an ever-rising debt burden. For many, the secular rise in the financial obligations ratio
shown in Chart 1 reflects years of consumer imprudence, which has now sentenced the U.S.
consumer to a prolonged period of slower “new-normal” growth.
However, a very different interpretation emerges when Chart 2 is considered in conjunction with
Chart 1. The chronic rise in the financial obligations ratio may simply reflect a rational augmentation
of debt in substitution for energy budget savings (i.e., a persistent decline in the household energy
obligations ratio). The consumer, rather than illustrating ignorance about long-run financial health,
simply took rational advantage of energy savings to raise commitments elsewhere. For example,
between 1980 and 2004, even though the financial obligations ratio rose by about 2 percent, the
energy obligations ratio declined during the same period by almost 4 percent! The fact the consumer
chronically took on more debt and persistently increased their financial obligations ratio during this
period was not evidence of foolishness. Rather, considering the energy obligations burden declined
faster than the financial obligations ratio rose, this period actually illustrated an era of household
conservatism!
The “TOTAL” Household Burden!?!?
Chart 3 combines the financial obligations ratio with the energy obligations ratio to illustrate the U.S.
household “total” obligations ratio. Despite a persistent rise in the financial obligations ratio (Chart
1), the total household obligations ratio persistently declined between 1980 and 2000 and remained
very modest until 2006. Compared to the financial obligations ratio, we believe the “total” household
obligations ratio better explains why U.S. consumption has remained stronger than most thought
3
4. possible during much of the last couple decades, why the consumer did not recess during the 2001
recession (even though the financial obligations ratio was very high by historic standards) and why
the U.S. consumer finally capitulated in 2008 once the “total” obligations ratio surged above its
record 1980 levels. Chart 1 suggests the U.S. consumer went on a spending spree for almost 30 years
even though its “fixed expenses” burden was chronically rising to record highs. By contrast, Chart 3
shows a steady decline in the total household burden (including energy costs) is probably what
sustained the prolonged U.S. household spending spree. Chart 1 leaves a conundrum as to why the
record high financial obligations ratio in 2000 did not produce a consumer recession. Chart 3 shows
the consumer did not shut down in 2000 because the “total” obligations ratio was near a record low!
Finally, Chart 1 does not show a rise in the obligations ratio commensurate with the severity of the
2008 calamity, whereas Chart 3 clearly shows a surge in the household “total” obligations ratio prior
to the recessionary collapse.
Chart 3
U.S. TOTAL Household Financial Obligations Ratio
Adjusted for Energy Outlays***
***Includes all debt payments (principal and interest) on outstanding mortgage
and consumer debt, auto lease payments, rental payments on tenant-occupied
25.0% property, homeowners' insurance and property tax payments, AND Total
Household Expenditures on Energy Goods and Services. All these outlays shown
as a percent of Disposable Personal Income.
24.5%
2008Q1 @ 24.9%
24.0%
23.5%
23.0%
22.5%
22.0%
2009Q2 @ 22.5%
21.5%
21.0%
20.5%
1980 1982 1984 1986 1988 1990 1992 1994 1996 1998 2000 2002 2004 2006 2008 2010
Hope for the U.S. Consumer???!
The household financial obligations ratio illustrated in Chart 1 does not give much hope for a quick
revival in U.S. consumption spending. Although the obligations ratio has declined some from its peak
in 2008, its decline thus far is only modest (less than 1 percent). Moreover, debt burdens can only
improve slowly over time as new debt is postponed, or existing debt is either written off or
refinanced. Consequently, this chart supports the widely held contention that U.S. consumer spending
will likely remain anemic for several years.
However, the “total” household obligations ratio (Chart 3) has already experienced substantial
improvement. This ratio has declined by 2.5 percent from its high in early 2008 and is as low today as
it was in 2000! Moreover, the total obligations ratio is currently below its average since 1980. The
swift and significant drop in the U.S. household “total” obligations ratio since the first quarter of
2008 suggests a quicker and more substantial consumer revival than most now anticipate.
4
5. Summary …… Perhaps the U.S. Consumer will Surprise?!?!
A widespread perception the U.S. consumer is buried under a mountainous debt burden has given rise
to a strongly held consensus view that household spending and the overall U.S. economy is sentenced
to a prolonged period of subpar “new-normal” growth. However, as this note suggests, perhaps
surging energy costs during 2007-08 rather than oppressive debt burdens is what ultimately pushed
the consumer into recession. If this is the case, then a near-term revival in job creation combined with
a significant 2.5 percent decline in the “total” U.S. household obligations ratio may produce a
consumer recovery next year that proves swifter and stronger than most now anticipate!?!
Wells Capital Management (WellsCap) is a registered investment adviser and a wholly owned subsidiary of Wells Fargo Bank, N.A. WellsCap provides investment
management services for a variety of institutions. The views expressed are those of the author at the time of writing and are subject to change. This material has been
distributed for educational/informational purposes only, and should not be considered as investment advice or a recommendation for any particular security, strategy or
investment product. The material is based upon information we consider reliable, but its accuracy and completeness cannot be guaranteed. Past performance is not a guarantee
of future returns. As with any investment vehicle, there is a potential for profit as well as the possibility of loss. For additional information on Wells Capital Management and
its advisory services, please view our web site at www.wellscap.com, or refer to our Form ADV Part II, which is available upon request by calling 415.396.8000.
5